Braking in EV
Q1: For a defined driving cycle, calculate the energy required for braking.
Q2: Why electric motor can’t develop braking torque at high speed similar to starting? How electric and mechanical brakes are coordinated?
Q3: Make a MATLAB program which plots contour of given motor speed, torque and efficiency values. Attach the code as a .m file attach a screenshot of all the plots
A:
Aim:
- To calculate energy required for braking for a defined driving cycle.
- To study about torque and brake relation and brakes coordination.
- To plot contours of given speed, torque and efficiency values using MATLAB.
A1:
Code explanation:
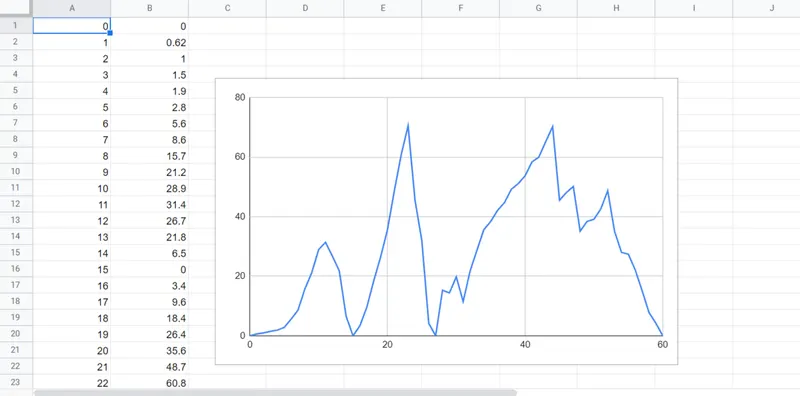
- Create a drive cycle using excel sheet. Create two columns consisting of time and speed values.
- Now insert this drive cycle into MATLAB.
- Add statements as follows for clearing previous stored values.
clear all
close all
clc - Insert values into MATLAB.
t = vtdc(:,1);
v = vtdc(:,2); - Insert mass value as 1000.
m = 1000; - Give for loop for calculating the brake energy.
for i = 1:(60-1)
if v(i)>v(i+1)
BE(i) = 0.5 * m * (v(i) - v(i + 1))^2;
end
end - Plot the graphs as subplots. In the first subplot, plot drive cycle and in the second subplot, plot the braking energy.
figure(1)
subplot(2,1,1)
plot(t,v, 'linewidth', 3, 'color', 'b')
xlabel('Time(s)')
ylabel('velocity(m/s)')
title('Drivecycle')subplot(2,1,2)
plot(BE, 'linewidth', 3, 'color', 'r')
xlabel('Time(s)')
ylabel('Braking energy')
title('Braking energy') - We have to make sum of all braking energies which is given by below.
TBE = sum(BE); - Now, run the program by saving the file.
Drive cycle in sheet:
Code:
clear all
close all
clc

% give initial values
t = vtdc(:,1);
v = vtdc(:,2);

% give mass as 1000 kg
m = 1000;

% finding braking energy for each value
for i = 1:(60-1)
if v(i)>v(i+1)
BE(i) = 0.5 * m * (v(i) - v(i + 1))^2;
end
end

% Plotting figures as subplots
figure(1)
subplot(2,1,1)
plot(t,v, 'linewidth', 3, 'color', 'b')
xlabel('Time(s)')
ylabel('velocity(m/s)')
title('Drivecycle')

subplot(2,1,2)
plot(BE, 'linewidth', 3, 'color', 'r')
xlabel('Time(s)')
ylabel('Braking energy')
title('Braking energy')

% Calculating total braking enrgy
TBE = sum(BE);
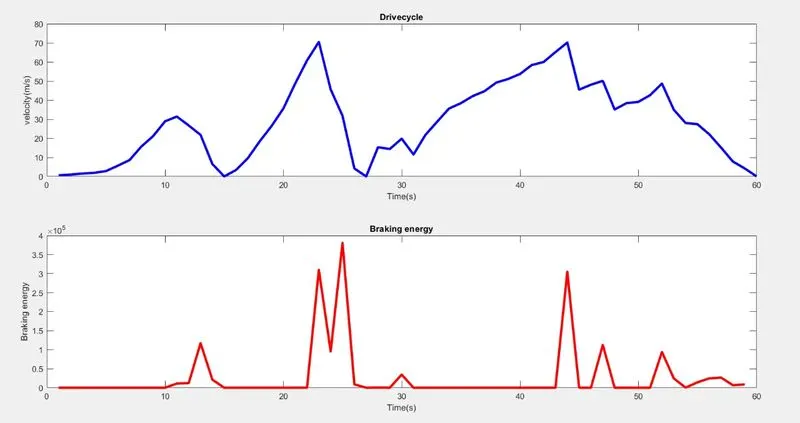
Plot: We can observe that, high braking energy is required to stop the vehiclewhen vehicle is at high speeds. At lower speeds less braking energy is required.
A2:
Regenerative braking: Regenerative braking stores energy in the form of kinetic energy during acceleration. When the brakes are applied the energy is dissipated in the form of heat or used as stopping the vehicle. The energy is typically too high. Regeneration can save a significant portion of energy, extending the range of a vehicle. The motor acts as a generator when it is reversed. Thus, energy is reversed and goes to source. As it runs as a generator, car speed reduces with regerative resistance of the electric motors. Thus slowing down of speed is done using regerative braking.
Mechanical brakes: Now a days in all vehicles, we can observe both normal brakes and hand brakes. Normal brakes are used to stop the vehicle at higher speeds and lower speeds. Hand brakes are used to stop the vehicle at parking spot. These are used for lower speeds. Hand brakes are used when service brakes(normal brakes) doesn't function. These brakes are hydraulic in nature. These are directly connected the tyres of the vehicle.
Differences between regenerative and mechanical:
| Electric | Mechanical |
| 1. Used for functional braking. | 1. Used for emergency stopping or for parking. |
| 2. Very smooth and comfortable. | 2. Rough and uncomfortable. |
| 3. No wear results. | 3. High wear reuslts and requires regular maintanance. |
| 4. Possible to store energy back to the source. | 4. Energy is always lost as heat, noise nad wear. |
| 5. Cannot be used as a safety device. | 5. It is a backup safety. |
|
6. Types of electric brakes:
|
6. Types of mechnaical brakes:
|
Electric motor can't develop high torque during high speeds. Initially the torque is high when the motor is on and the speed is low. Here the torque attains maximum and run the vehicle. Since the speed and torque are inversely proportional to each other, we can say that at high speeds, the torque is decreased and cannot operate further. But when the speed is already high and no extra load is applied it is not possible to increase the torque. Initially, the constant develops, further the vehicle attains in contain power region where braking torque cannot be applied. Thus, electric motor can't develop high torque during high speeds.
Electric and mechanica brakes are coordinated to stop the vehicle by two strategies.
- Series: In this strategy, either regenerative braking or mechanical braking is used. Brakes are applied one after other. Thus, we can say as series strategy.
- Parallel: Both the brakes are applied simultaneously to stop the vehicle. EDIB(Electric Driven Intelligent Braking) is a combination of mechanical and electric brake. It controls the reactive force from the pedal in order to unify the feeling when stepping down th pedal and sense the deceleration.
A3:
To plot contour motor speed, torque and efficiency values.
A motor has various losses while running. They are
- Copper losses: These losses can be calcuated by (CL = Kc*(T^2))
- Iron losses: These losses are magnetic losses and can be conducted by (IL = Ki * w)
- Winding losses: These are mechanical or fricion losses and calculated by (WL = Kw * w^3)
- Constant losses(C)
Where,
- w = speed(rad/s)
- T = Torque (Nm)
- Kc = Copper losses constant
- Ki = Iron losses constant
- Kw = Winding losses constant
Output power is the difference between input power and total losses.
Total losses are combination copper, iron, winding and constant losses.
∴ OP = IP - TL
where,
- OP = Output Power
- IP = Input Power
- TL = Total Losses = CL + IL + WL + C
Code explanation:
- Add statements as follows for clearing previous stored values.
clear all
close all
clc - Give speed and torque values starting from zero, using linspace command.
S = linspace(0, 1200);
T = linspace(0,300); - We have to create a matrix for speed and time values.
[X, Y] = meshgrid(S, T); - Output power can be given by product of speed and torque.
OP = (X.*Y); - Give constant values of all losses.
Kc = 0.3;
Ki = 0.008;
Kw = 0.0001;
C = 10; - Calculate all losses.
CL = Kc.*(Y.^2);
IL = Ki.*X;
WL = Kw.*(X.^3); - Total losses is equal to sum of all losses.
TL = CL + IL + WL + C; - Input power is calculated by the sum of output power and total losses.
IP = OP + TL; - Efficiency is defined by ratio of output power to input power.
E = OP./IP; - To map efficient points on contour, we need to assign values.
V = [0.7, 0.73, 0.77, 0.8, 0.83, 0.85, 0.87, 0.9, 0.92]; - Plot the values as contour.
contourf(X, Y, E, V)
colorbar - Give labels and necessary requirements.
title('Contour Plot');
xlabel('Speed (rad/s)');
ylabel('Torque N/m');
zlabel('Efficiency');
Code:
clear all
close all
clc

% give speed and torque values
S = linspace(0, 1200);
T = linspace(0,300);

% Converting into matric form
[X, Y] = meshgrid(S, T);

% Calculating all values
OP = (X.*Y);
Kc = 0.3;
Ki = 0.008;
Kw = 0.0001;
C = 10;

% Calculating all losses
CL = Kc.*(Y.^2);
IL = Ki.*X;
WL = Kw.*(X.^3);
TL = CL + IL + WL + C;

% Calculating input power and efficiency
IP = OP + TL;

E = OP./IP;

% Plotting figures at certain velocities
V = [0.7, 0.73, 0.77, 0.8, 0.83, 0.85, 0.87, 0.9, 0.92];

contourf(X, Y, E, V)
colorbar

title('Contour Plot');
xlabel('Speed (rad/s)');
ylabel('Torque N/m');
zlabel('Efficiency');
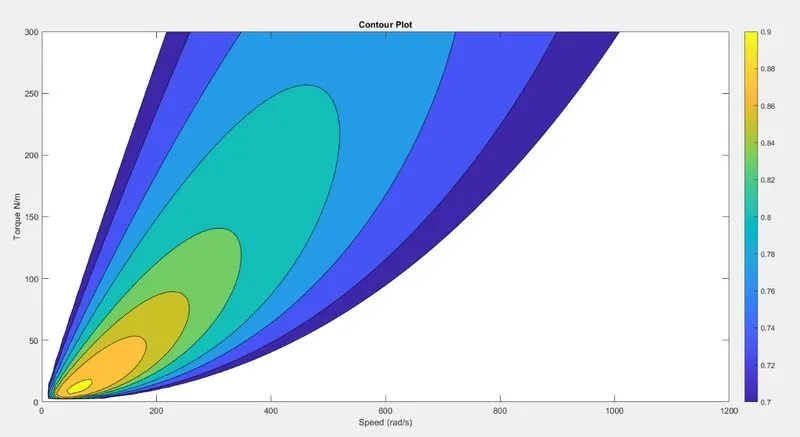
Output plot: The pllot we get contains three values. Efficiency, torque and speed.
Conclusion:
- Total Braking energy for a drive cycle is calculated and plotted.
- Due to the high speed the vehicle is in constant power region, torque cannot be applied further. Mechanical and electric brake startegies are involved in vehicles.
- Plotted the contour of motor speed, efficiency and torque values.