Week-11 Challenge: Braking
Q: For a defined driving cycle, calculate the energy required for braking.
Braking is required to slow down the moving vehicle or to stop when ever required. The technique used in braking is friction. Some amount of energy is required for accelerating the vehicle.
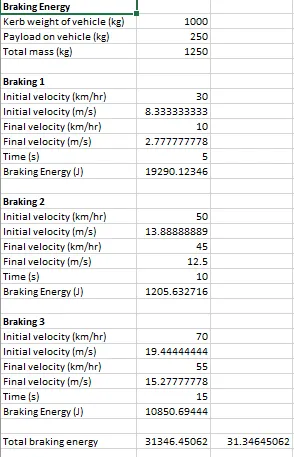
Braking energy = (1/2)*m*v^2
where m is mass of the vehicle, v is velocity.
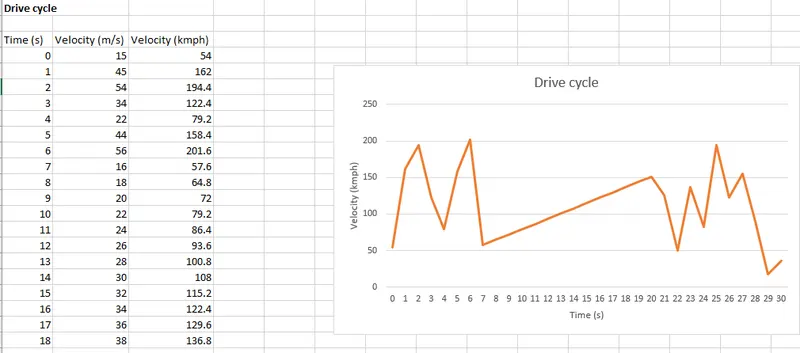
Therefore the total braking energy is 31.34 KJ
Q: Why electric motor can’t develop braking torque at high speed similar to starting? How electric and mechanical brakes are coordinated?
An electric motor requires a high current at starting to make a motor run which produces the high torque at the time of starting. The speed-torque characteristics of an electric motor show us that the torque of a motor will be high and constant for speed below critical speed whereas the torque starts reducing once it reaches the critical speed and maintains the constant power at high speeds, hence EV motors can't develop braking torque at high speeds.
Electric and mechanical brakes control strategies: These strategies are used in order to apply the brakes. As the acceleration torque is higher than deceleration torque, only electric braking is not sufficient to stop the vehicle. Also while reducing the speed, the speed is not directly reduced, as a process, the regeneration takes place, where the curve enters into 2nd quadrant and again enter to 3rd to a reduced speed. In such cases to obtain the reduction in speed, series and parallel strategies are used. In series, mechanical and electric brakes are applied one after another, whereas, in parallel brakes, these are applied at a time. In order to control the system, Electric Driven Intelligent Brake System is used in order to control the vehicle. For low-speed generally, only one braking system is used, as a regenerative brake system, whereas for high-speed operations combination is used.
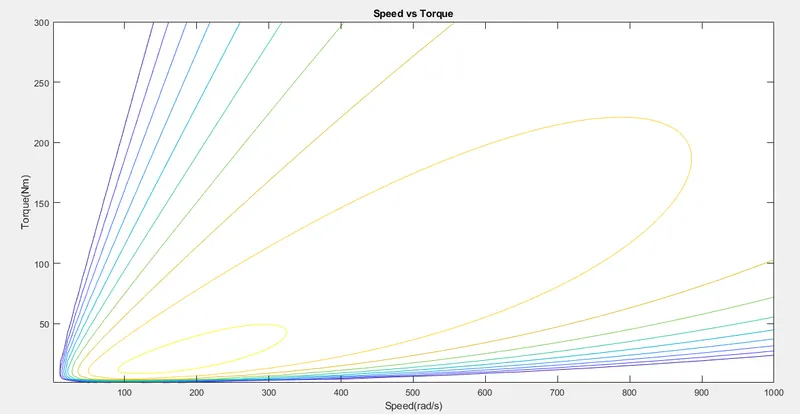
Q: Make a MATLAB program which plots contour of given motor speed, torque and efficiency values. Attach the code as a .m file attach a screenshot of all the plots.
Matlab code: