Week-11 Challenge: Braking
BRAKING
1. For a defined driving cycle, calculate the energy required for braking.
Ans. - Braking is a dynamic state in which a vehicle slows down from a predetermined speed. The vehicle requires a specific amount of time to accelerate or decelerate. When a vehicle accelerates, either in motion or from rest, it generates kinetic energy, and when it decelerates, the opposite occurs.
For an object with mass (m) & moving at velocity (V), kinetic energy can be defined as:
E = 1/2 * m * V2
The engine provides kinetic energy to accelerate the vehicle from a standstill to the required speed. During braking, this energy is wasted as heat. The Drive cycle is a collection of statistics that represents the relationship between vehicle velocity and time.
If the vehicle is decelerating from its initial velocity (Vi) to final velocity (Vf), then the energy required for braking is given as:
E = 1/2 * m * (Vi - Vf)2
clear all
close all
clc

%% Inputs
Mass = 1000;
data = readtable ('Drive_Cycle_Braking.xls');       % Reading the file
time = data.TIME;       % Reading the TIME data from the file
speed = data.SPEED;     % Reading the SPEED data from the file
Kin_Energy = zeros (1, length(time));
Break_Energy = 0;

for i = 1 : length (speed) - 1
    if speed (i) > speed (i + 1)
        Kin_Energy (i) = 0.5  * Mass * ((speed (i)^2) - (speed (i + 1)^2));
        Break_Energy = Break_Energy + Kin_Energy (i);
    end
end

disp ("Breaking energy is " + Break_Energy/1000 + " kWh");


%% Plotting
figure(1)

plot (time, speed, linewidth = 2);
xlabel ('Time in sec');
ylabel ('Speed in m/s');
title ("Drive Cycle");

figure(2)
plot (time, Kin_Energy, linewidth = 2);
xlabel ('Time in sec');
ylabel ('Kinetic Energy in kJ');
title ("Breaking Energy");

figure(3)
plot(speed,'DisplayName','speed');
hold on;
plot(Kin_Energy,'DisplayName','Kin_Energy');
hold off;
xlabel ('Time in sec');
ylabel ('Breaking Energy in kJ');OUTPUT:
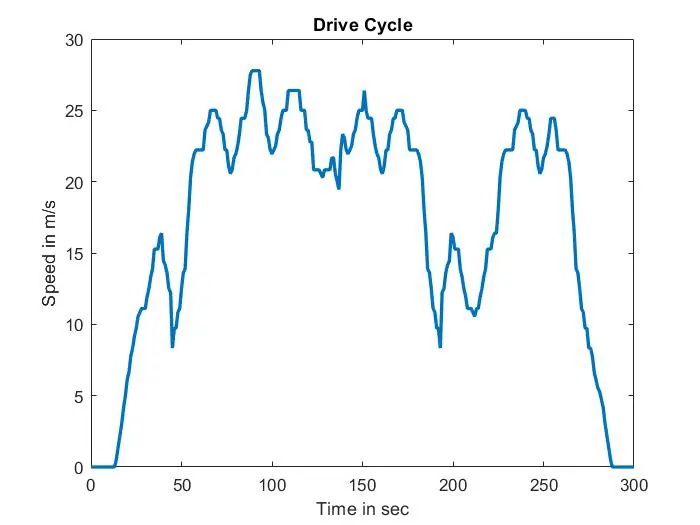
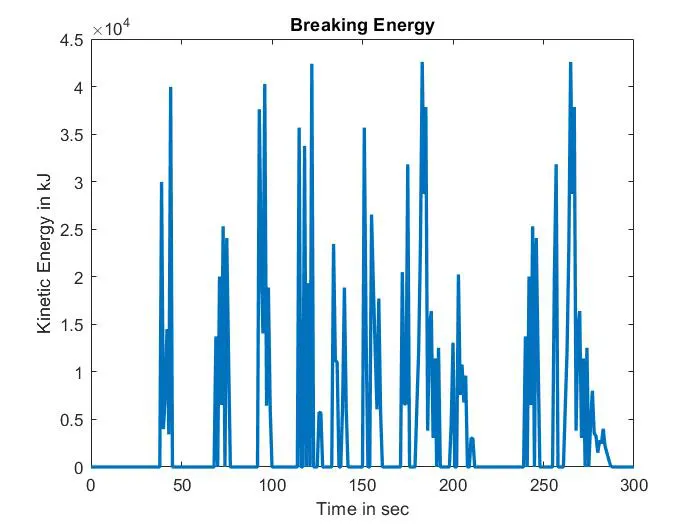
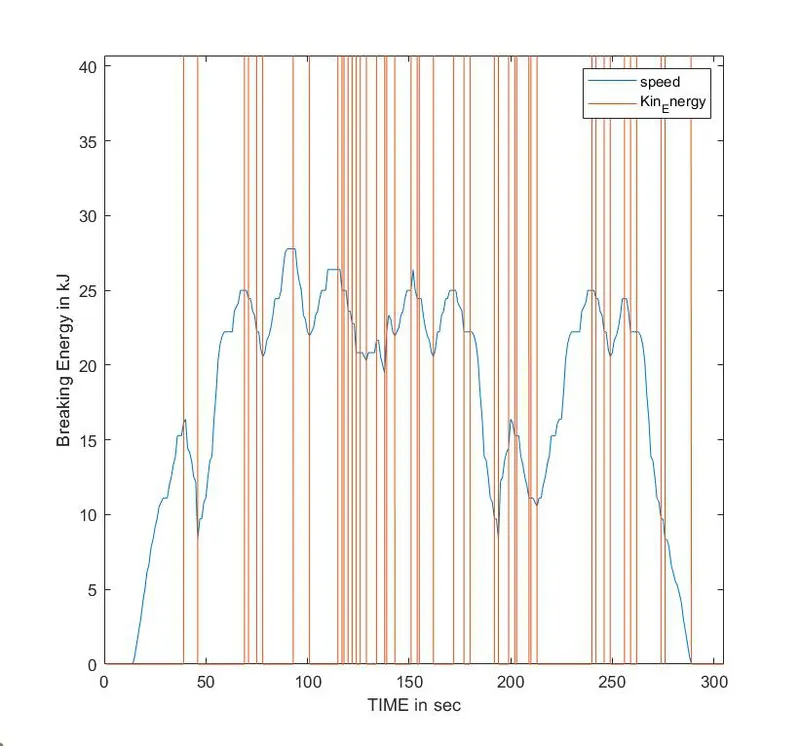
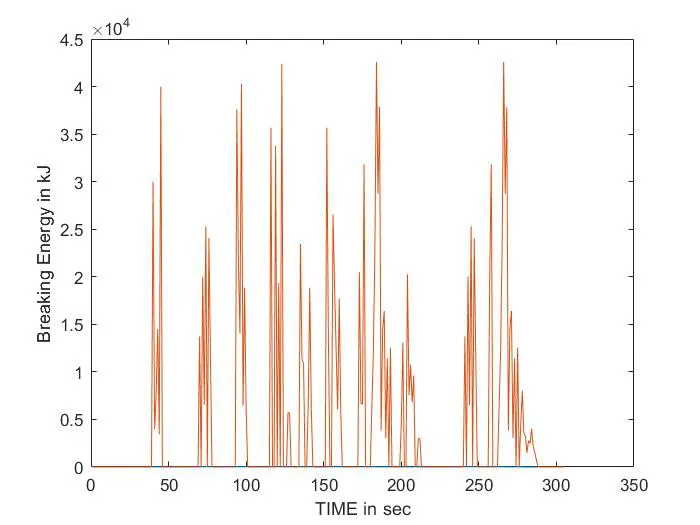
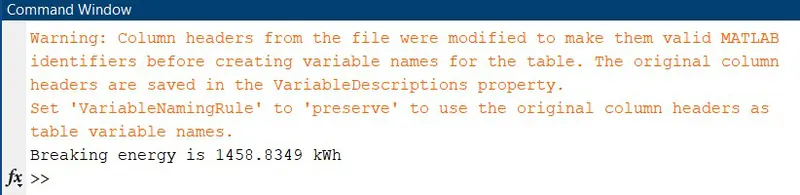
In the graphs we can observe that as the speed of the vehicle increases, the stopping power or the braking energy also increases.
2. Why electric motor can’t develop braking torque at high speed similar to starting? How electric and mechanical brakes are coordinated?
Ans. - Regenerative braking in EVs and HEVs complicates braking system design. An important element of electric cars is the ability of an electric motor to convert kinetic energy back into electrical energy. As we know the torque equation is given by,
T = F.r
Where, T = torque of the motor,
F = force applied,
r = radius of the wheel;
As a result, the motor is initially at rest during the vehicle's starting conditions. When the throttle pedal is depressed, the electric motor begins to spin and a significant amount of force is applied to the steering wheel. Because the produced force has little external resistance, nearly all of the provided power is transferred to torque, resulting in a larger beginning torque at the wheels during start.
The electric motor now has some speed and momentum connected with it while the vehicle is operating or performing in dynamic mode. At the same time, the force opposing the wheel or the motor during deceleration or when the brakes are applied at high speed is comparatively less than the force applied by the motor during forward motoring. According to the torque equation, as the value of braking force falls, so does the braking torque created. As a result, the electric motor cannot generate braking torque at high speeds, as it can when starting.
When the motor's speed exceeds the synchronous speed, regenerative braking occurs. This baking method is known as regenerative braking because the motor acts as a generator and the supply receives power from the load, i.e. motors. The main criterion for regenerative braking is that the rotor must rotate faster than synchronous speed; only then will the motor act as a generator, and the direction of current flow through the circuit and torque direction reverse, and braking occurs.
After accelerating, you may not be able to reach the maximum torque. The reason for this is that no matter how much the current loop wants to increase current (proportional to torque) by increasing the power stage's PWM duty cycle, the Vmotor is too close to Vbemf and thus current cannot increase any further. This does not happen at the start of an acceleration because the majority of the torque is used to increase the kinetic energy of the load (and motor). However, when the speed is already high and no additional load is applied, increasing the torque is not possible.
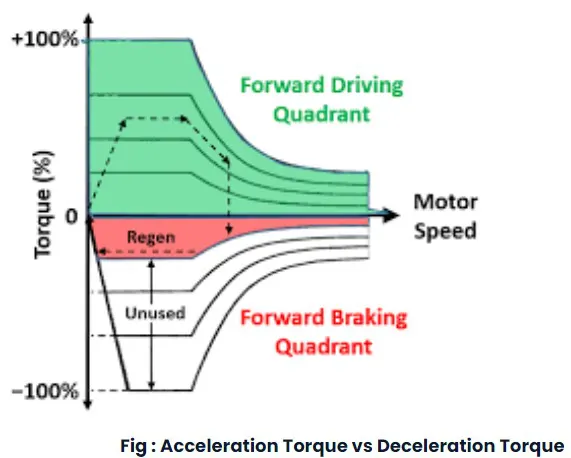
Peak Acceleration Torque and Peak Deceleration Torque for an Electric Vehicle Motor are not equal. As a result, the Peak Torque during acceleration is not equal to the Peak Torque during deceleration or braking. Acceleration is usually greater; at low speeds, we get more torque; at high speeds, the torque value decreases. As a result, we cannot say that a motor that produces 7Nm of torque for acceleration can also produce -7Nm of braking torque. So, because we are operating the motor in the Field Weakening region or above base speed, we must be aware that the torque is compromised or the torque value is lower. Because the braking torque of an EV motor is not as high as the acceleration torque, it cannot develop braking torque at high speeds similar to starting. As a result, regenerative braking cannot occur effectively enough to return all of the power to the battery.
Electrical and mechanical braking systems can are coordinated by using a Brake strategy subsystem
1) Serial Braking Strategy
2) Parallel Braking Strategy
1) Serial Braking Strategy
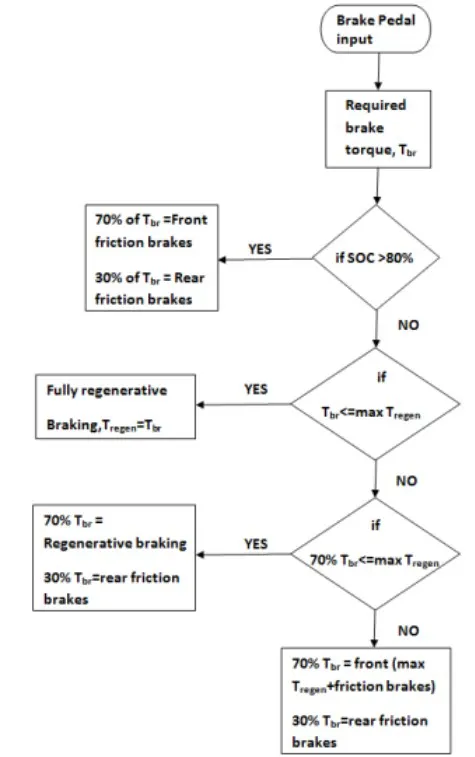
When the brake pedal is depressed, brake torque is sent depending on the level of depression. This brake torque is now routed to the brake control strategy block. The battery state-of-charge is first checked to see if it is less than 80%, which is set as the maximum permissible level of charge. If that condition is met, the battery is recharged. The requested brake torque is compared to the motor-maximum generator's regenerative torque limit. If the requested overall brake torque is less than or equal to the maximum regenerative torque, the vehicle brakes solely on regenerative torque and the battery is charged. The efficiency of both battery charging and motor-generator operating affects the final amount of charge applied. The friction brakes engage if the total amount of brake torque required is higher than what the motor-generator can supply. Since the car is front-driven, it is now verified that the total braking torque demanded from the front is less than or equal to the motor-full generator's regenerative torque capacity. If so, rear (non-driven axle) and front (driven axle) braking is accomplished solely by friction. When the total need for brake torque rises even higher, front friction brakes (on the driven axle) are used in conjunction with rear friction brakes and front regenerative braking to meet the demand.
2) Parallel Braking Strategy
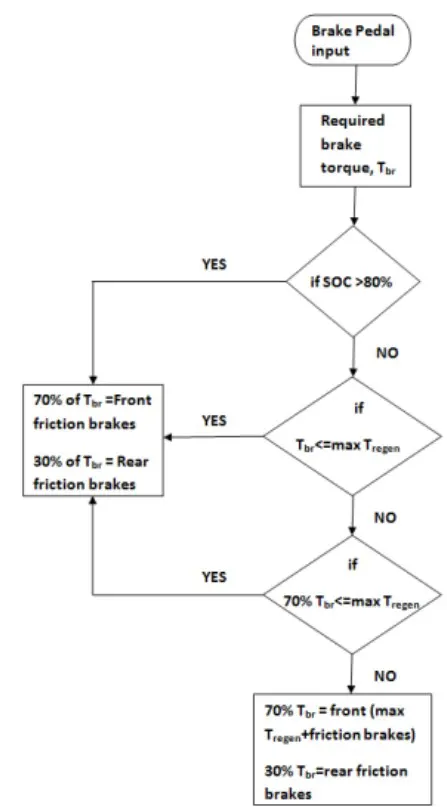
When the brake pedal is depressed, the driver block sends a request for the desired overall brake torque. This braking torque is always divided between regeneration and friction braking as it passes through the brake control strategy. The strategy is designed with the comfort and feel of the brake pedal in mind. Because parallel regenerative braking is an add-on to traditional systems, it lacks integrated control. So, in order to smooth the transition and eco-performance of regenerative braking with friction, it is assigned in such a way that there is a clear distinction between the amount of brake torque obtained from regeneration and friction braking. It is designed to operate the generator in a constant generator torque region when the brakes are applied and in accordance with the design of the motor-generator. At or below the base speed, the motor-generator can produce up to 322 Nm of generator torque. The generator is scaled so that its base speed corresponds to a velocity of 124 [kmph], the maximum speed limit on most highways. As a result, regeneration works as long as the vehicle is braking at less than 124 [kmph] and the requested brake torque on the front-driven wheels after the front-rear brake split is greater than or equal to the maximum generator torque. If that condition is satisfied, then regenerative and friction braking operates in tandem else it’s just the friction brakes at the driven and non-driven axle.
3. Make a MATLAB program which plots contour of given motor speed, torque and eff. values. Attach the code as a .m file attach a screenshot of all the plots.
Ans. - To plot contour line for a given Motor. A Motor have various types of losses happening inside. The various types of losses are
Copper Losses - I2⋅R, where R is the Armature resistance and we say that Torque is proportional to Current, this copper loss can be considered as
kc⋅T2.
where kc is to take care of resistance of brushes and also take care of flux and its effect.
Copper losses = kc⋅T2
Iron Losses - Iron Losses are nothing but Magnetic losses, which is denoted as ki⋅ω, where ki factor is based on the Magnetic field effect. For Permanent Magnets have constant Magnetic field and this Iron losses is based on the value of ki and this are going to change according to the Speed. At Various Speed have different value of Back EMF and that is going to affect the Iron Losses.
Iron Losses = ki⋅ω
Windage Losses - This is a Mechanical or friction of Windage losses. This is based on size of shape of Motor and the amount of windage losses that the motor is going to experience.
Windage Losses = kw⋅ω3
Constant Losses - This is denoted as C.
Total Losses - The Total Losses are considering the above four losses and denoted as,
Total Losses = kc⋅T2 + ki⋅ω+ kw⋅ω3 + C
All Motors are modeled as per the above equation of losses. This above equation is not only applicable for Permanent Magnet DC Motor, but other motors as well like induction motor.
clear all
close all
clc


%% Input of Speed & Torque

Speed = linspace (1, 1000);
Torque = linspace (1, 250);

%% Losses
Cop_Los = 0.2;              % For Copper Loss
Iron_Los = 0.008;           % For Iron Loss
Wind_los = 0.00001;         % For Windage Loss
Const_Mot_Los = 20;         % For Constant Motor Loss

%% Meshing
[S, T] = meshgrid (Speed, Torque);

%% Calculating Power = Speed * Torque
Output_power = (S.*T);

%% Calculating Losses
Cu = (T.^2) * Cop_Los;           %Copper Losses
Fe = S * Iron_Los;               %Iron Losses
W = (S.^3) * Wind_los;           %Windage Losses

Input_power = Output_power + Cu + Fe + W + Const_Mot_Los;
Efficiency = Output_power./Input_power;

%% Setting Efficiency to plot Contour
V = [0.70, 0.80, 0.85, 0.90, 0.91, 0.92, 0.925, 0.93];      % Efficiency scale range
[C, h] = contour(S, T, Efficiency, V);
clabel (C, h);
xlabel ('Speed (rad/s)')
ylabel ('Torque (Nm)')
title ('Motor Speed - Torque Efficiency Contour Plot')
hold on

%% Now Plot a contour of Power Output
% Additionally Plotting contour of 8kw and 10kw
V = [8000, 10000];
[C, h] = contour (S, T, Output_power, V);
clabel (C, h);
Code Explanation: -
-
Defined input points of Speed and Torque.
-
Initialized Copper loss, Iron Loss, Windage Loss and Constant Motor Loss.
-
Created meshgrid of Speed and Torque
-
Calculating the output power.
-
Calculated the losses, input power and efficiency.
-
Defined efficiency scale range for contour.
-
Plotting contour using S, T, Efficiency and V.
OUTPUT:
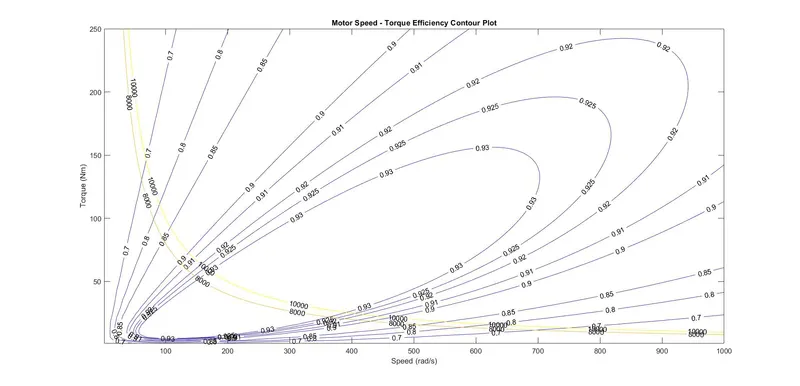
Output Explanation:
The contour of motor speed, torque, and efficiency values has been plotted, as seen in the above plot. Using the data cursor, you can get the values for any point on the plot.
If we want to see the actual efficiency values on the contour plot, we can use the following contour command for plotting:
				[C, h] = contour (S, T, Efficiency, V);
                                                             clabel (C, h);
and [C, h] = contour (S, T, Output_power, V);
                                                             clabel
(C, h);
This command returns the contour matrix C, which contains the data used to define the contour lines, as well as the Contour object h. The contour matrix is used by the clable function to label the contour lines. The efficiency values are visible in the plot above.