Week-11 Challenge: Braking
(1)
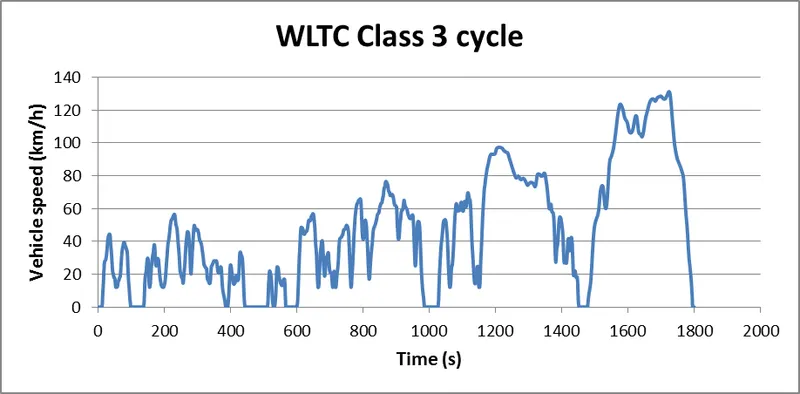
The above drive cycle is for WLTC (Worldwide harmonized Light vehicles Test Cycles )_class 3.
All related data has been attached in the Excel file format.
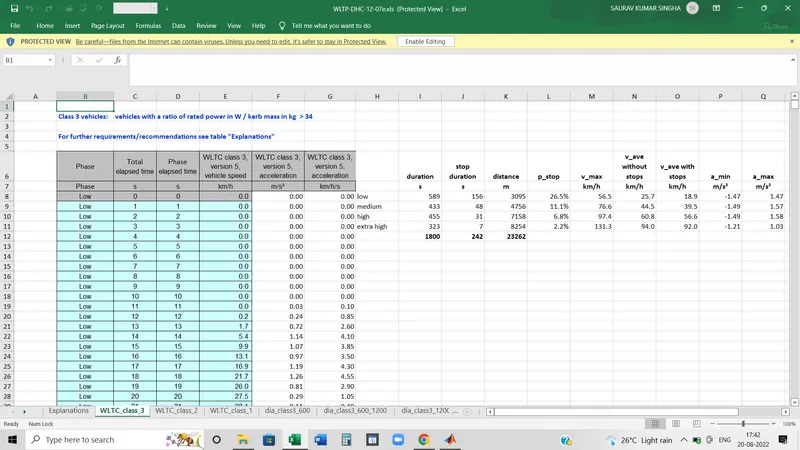
Objective: Calculation of energy required for braking.
Excel(.xlx) file is attached in the name of 'Calculation of Braking Energy' where all the calculation has been done to calculate braking energy.
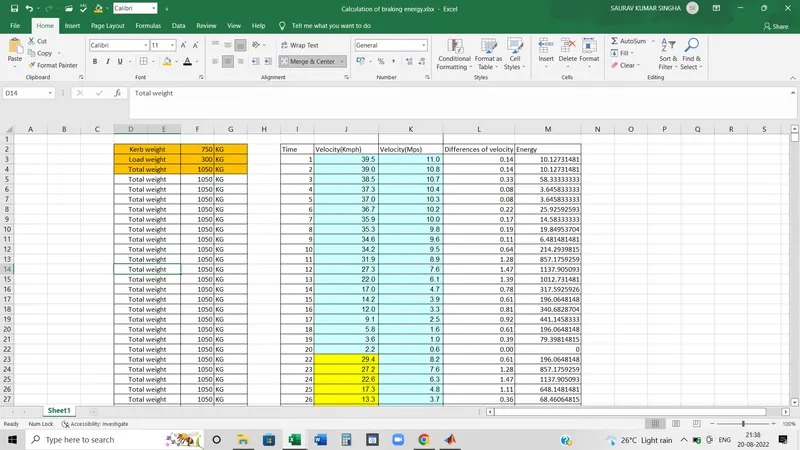
Here took, Kerb weight=750 Kg.
Load weight=300 Kg.
Total weight= 1050 Kg.
Braking Energy= 1/2*Mass*(velocity)^2
velocity= (v1-v2)=difference between two velocity
v1=Initial velocity when the brake is applied
v2= Final velocity (when again the brake is applied or throttle is applied for acceleration).
This formula is put in M column and calculated energy dissipation during every braking interval.
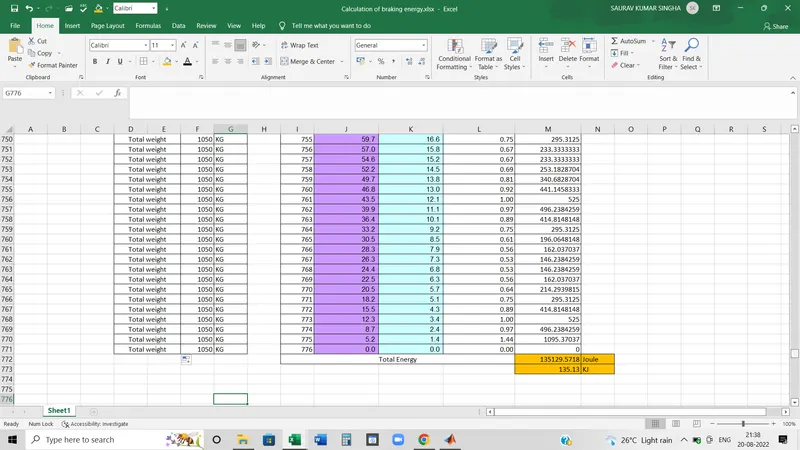
By adding all this energy dissipation, got the total energy dissipation for braking in the vehicle for the WLTC class3 drive cycle.
So, For WLTC_class_3 drive cycle
Total Energy required for braking is= 135129.57 Joule
= 135.13 Kilo Joule
(2)
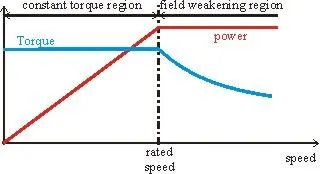
This graph shows the torque speed characteristics of DC drive. Here we can see that till the rated speed, the motor runs in the constant torque region and after critical speed, it shifts to the constant power region, which is also called the field weakening region. During this period motor runs in the highest speed and lower torque mode.
Now the question is why the motor does not achieve higher torque during braking similar to the acceleration mode. The reason behind the question is if the motor could achieve the highest torque so the speed would be lower and for that, power could be fed to the battery for a longer period and that would be more efficient for the drive.
During braking, the torque value turns negative and speed remains positive so the graph switches to the different quadrant of the x-y axis. As I mentioned torque is negative and speed is positive so the graph switches to the fourth quadrant.
During braking, the torque speed curve just flips. It means the graph will be like a mirror of the above one. So the torque value is very low and the speed remains the same.
Now if, to achieve critical speed motor is driven on 10 N.m, during deceleration motor torque would be lower than the -10 N.m on the y-axis or nearer to the 0 points. So it clearly clarifies that during braking motor torque will be lower and the speed would be higher.
This is one of a drawback of regenerative braking.
As regenerative braking has few limitations so for EV application Electrical and mechanical brakes both are needed to apply.
Limitations of Regenerative braking:
1. Power Converter: For regenerative braking, a bidirectional power converter is needed because, during braking, power goes back to the battery. But bi-directional power converter is complicated in design and use.
2. Battery: Charging time is more than the discharge time.
3. Motor: Motor drive runs in negative torque and positive speed region for that it takes a very short time to come in a standstill which does not efficient for battery charging.
So brake control strategy is Electrical and mechanical both brakes are needed to apply. Brake applying strategy is two types.
i) Series brake control strategy: In this method, two brakes are applied but one after another. First, we need to apply the electrical brake and then a mechanical brake.
ii) Parallel Brake Control Strategy: Here both electrical and mechanical brakes are applied at a time.
Note:
- At low speed: Regenerative braking is applied
- At high speed: Regenerative and mechanical brakes are applied.
- Nissan has developed a practical brake strategy called ELECTRIC DRIVEN INTELLIGENT BRAKE.
(3)
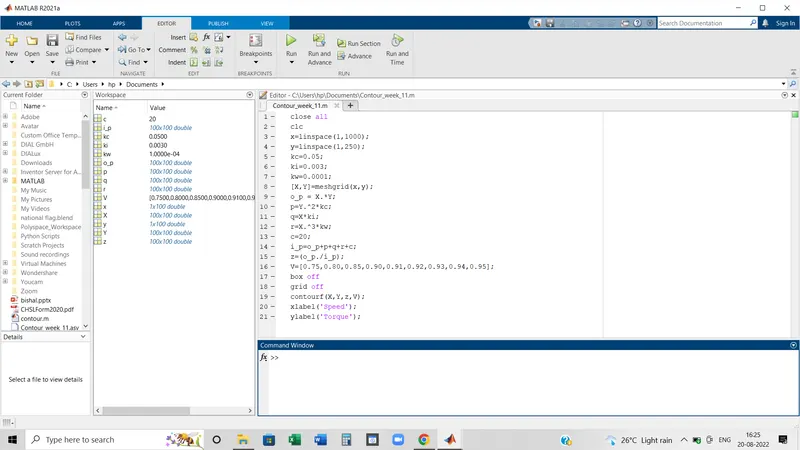
Steps:
- x and y have been taken as Speed and Torque respectively.
- As we know to deliver power input to output there have some losses like Copper losses, Iron losses, Windage losses and some constant losses.
- Copper Loss= Copper_loss_constant*Torque
- Iron loss=Iron_loss_constant*Speed
- Windage Loss=Windage_loss_constant*(speed)^3
- As per the standard value of various constant, calculated the various loss as per the formulas.
- Output Power=Input power+Copper Loss+Iron loss+Windage Loss+Constant losses
- Efficiency=(Output Power/input Power)
- input power= Torque*speed. but as both are vector quantities, so we need to make a cross-product between them. That's why in the script file, used (.*) between Torque and speed.
- Contour(z) creates a contour plot containing the isolines of the matrix, which
Zcontains height values on the x-y plane. MATLAB® automatically selects the contour lines to display. The column and row indicesZare the x and y coordinates in the plane, respectively. - C
ontour(X,Y,Z)specifies the x and y coordinates for the values inZ. - V specifies the range of efficiencies that will be plotted in the graph.
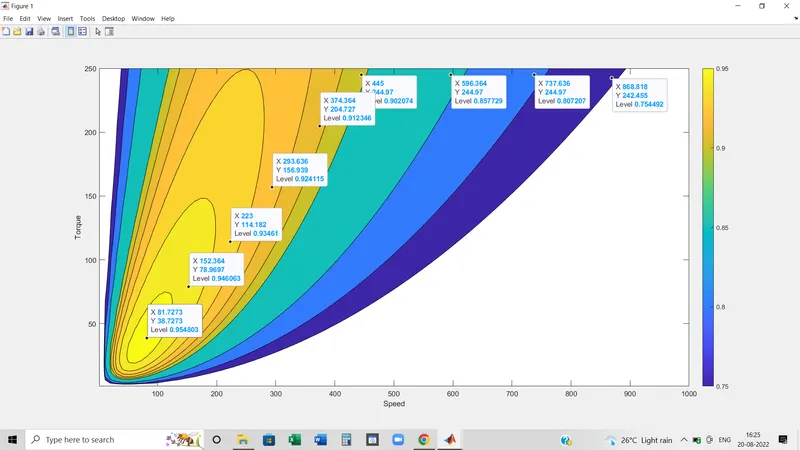
- Different colors are showing the different range of efficiencies.
- .m file has been attached.