Week-11 Challenge: Braking
1. For a defined driving cycle, calculate the energy required for braking.
Energy required for Braking
Under the condition of braking, some amount of energy is required t do the same as that of energy required for accelerating the vehicle. Hence, to calculate energy, we use the acceleration energy equation.

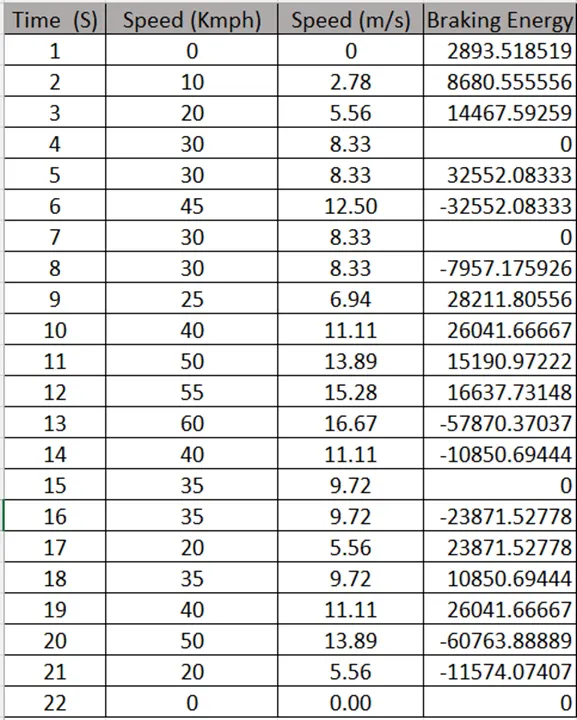
First a drive cycle is created in the excel sheet and then the braking energy is calculated using the formula,
Braking Energy = 0.5 * m * (Vf2 – Vi2)
Where m = mass of the vehicle = 750kg
Vf = Final speed
VI = Initial Speeds
Drive Cycle
Result
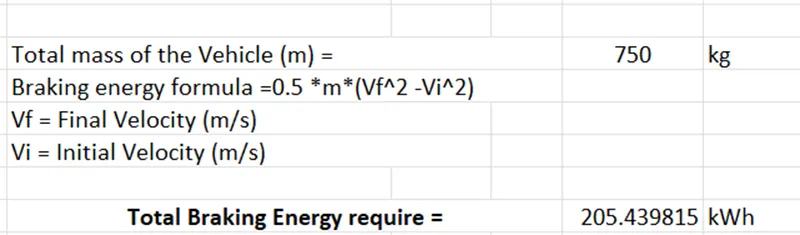
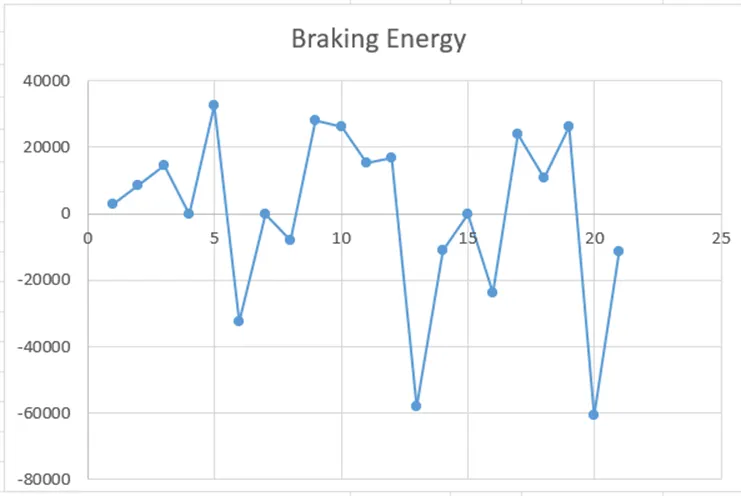
The braking energy for the above defined drive cycle was 205.4 kWh
2. Why electric motor can’t develop braking torque at high speed similar to starting? How electric and mechanical brakes are coordinated?
when the motor is at rest and it has to operate from a standstill position to reach the moderate speed the higher torque is required to bring the motor to operate. whereas when the vehicle is already at high speed the capping or the limit reached by the motor operation and thus any further higher torque could not be obtained while braking. This braking operation happens in the motion which is distributed as per proportion in the brake energy and the regenerative braking.
Electric and Mechanical Brakes Coordination
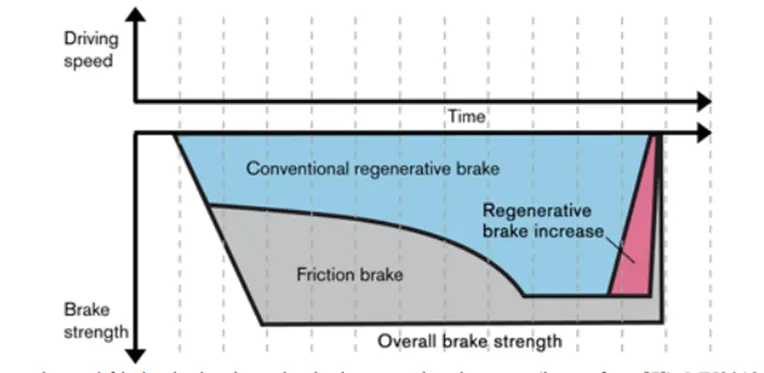
The coordination between hydraulic and regenerative braking involves various reasons such as electromagnetic torque oscillation at low speed, the requested braking torque is higher than the power absorption capacity of the electric source (including conductors) and emergency situation. Also, below a certain speed, the kinetic energy is very low, there is no enough regenerative braking, and it is proposed to use the mechanical braking system with the help of brake pedals. This coordination between the electric and mechanical braking system in an electric vehicle helps in the efficient running of the vehicle.
In mechanical braking which we usually see and experience in all vehicles, the brake pedal in the vehicle helps us to engage or disengage the brakes. Currently, braking technology has done wonders by inventing life-saving braking technologies such as ABS, EBD, BA, and many others. All these technologies play a vital role in stopping the vehicle and coming back to rest from high speed. In all these vehicles when the driver applies the brakes the brake pads come closer to the disc connected with the driving disc. The brake pads usually help inefficient braking.
There are two generic methods by which the vehicle could be braked,
- Series - The regenerative braking and the mechanical braking both are applied one after the other.
- Parallel -Both the regenerative braking and the mechanical braking are applied parallelly.
When the brake pedal is applied it supplies the hydraulic fluid to the disc to slow down the tires at the same time when the acceleration pedal is lifted a certain amount of electric brakes are applied. At high speed, since the braking force required is a high, large amount of hydraulic brakes are applied and once the speed is reduced and the torque value is also high so the electric brakes become predominant so the battery charging occurs efficiently. The ECU system with a feedback system to find the torque region and regenerative braking predominate in the high torque region.
3. Make a MATLAB program which plots contour of given motor speed, torque and efficiency values. Attach the code as a .m file attach a screenshot of all the plots?
An efficiency map of an electric motor is a contour plot of torque and speed. It is used to describe the speed and torque combinations required at different efficiency ranges. In order to model the efficiency, contour we must consider the losses that occur in electric motors and these losses are,
- Copper losses (KcT2)
- Iron losses (Kiω)
- Windage losses (Kωω3)
- Constant losses (C)
Based on the above losses the MATLAB program to plot the efficiency contour is written below.
Parameters
Motor Speed = 0 to 1000 rpm
Motor torque = 0 to 700 N-m
Motor Constants
Kc = 0.2
Ki = 0.008
Kω = 0.00001
Constant Loss = 20
MATLAB Script
%A program for plotting efficiency contours for electric motors
%the x-axis corresponds to motor speed (w) and the y-axis to torque (T)
%first setup arrays for range
X = linspace (1,1000);
Y = linspace (1,1250);
%allocate motor loss constants
Kc = 0.2; %For copper losses
Ki = 0.008; %For iron losses
Kw = 0.00001; %For windage losses
ConL = 20; % For Constant motor losses
% now make mesh
[X,Y] = meshgrid (X,Y);
Outputpower = (X.*Y); %Torque x speed power
B = (Y.^2)*Kc; % copper losses
C = X.*Ki; % Iron losses
D = (X.^3)*Kw; % windage losses
Inputpower = Outputpower+B+C+D+ConL;
Z = Outputpower./Inputpower;
% we now set efficiencies for which a contour will be plotted
V = [0.70,0.80,0.85,0.90,0.91,0.92,0.925,0.93];
box off
grid off
contour (X,Y,Z,V);
xlabel ('speed/rads^-^1');ylabel ('Torque/N-m');
hold on
% Now plot a contour of the power output
% The array output power has already been calculated
% we draw contours at 8 and 10Kw
V = [8000,10000];
contour(X,Y,Outputpower,V);
Results
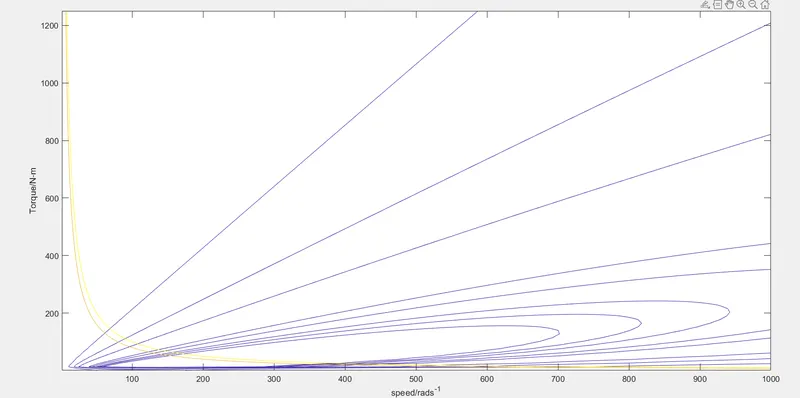
The contour plot of the motor with defined constant is plotted in the defined speed Vs torque region based on efficiency. It can be seen that for increasing speed and torque, the efficiency of the motor gradually decreases.