Week-11 Challenge: Braking
1.For a defined driving cycle, calculate the energy required for braking
Aim of the question is to calculate energy required for braking for our defined driving cycle.
Braking: for arresting or preventing the motion of a mechanism usually by means of friction apply the brakes took his foot off the brake. something used to slow down or stop movement or activity use interest rates as a brake on spending. It is the process of reducing motor speed.
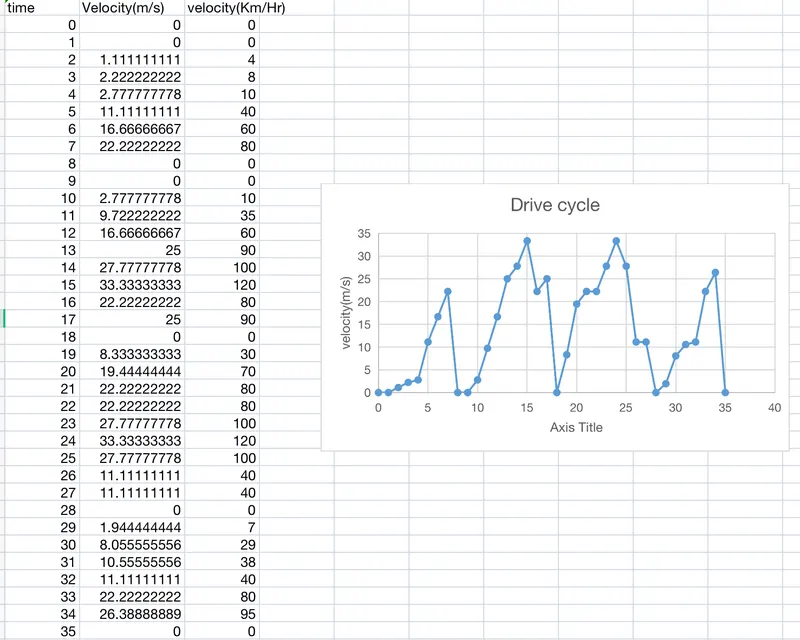
in order to implement the solution for the question. First we need to develope a drive cycle. Here i have developed a drive cycle for 36secs which is given below.
The Formula used to calculate energy required for braking is
General formula for acceleration is 1/2mv^2
for deceleration we consider initial velocity and final velocity

where,
m=mass of the vehicle
v1=inital velocity
v2=final velocity
we just implement the formula to find the braking energy required for braking in our drive cycle and also we find average energy required for deceleration.
clear all
close all
clc
%input
Mass=800; %mass of the vehicle
D=xlsread("drivecycleweek11.xlsx");
T=D(:,1);
V=D(:,2);

for k = 1:(length(V)-1)
    if V(k)>V(k+1)
        DA(k)=0.5*Mass*(V(k)^2-V(k+1)^2);
    end

end
TotalEnergy = sum(abs(DA));
fprintf('total brake energy is %d\n',TotalEnergy)
AverageEnergy = mean(abs(DA));
fprintf('Average brake energy is %d',AverageEnergy)

% Plotting result as graph
figure(1)
subplot(2,1,1)
plot(T,V,'LineWidth',3,'Color','g')
xlabel('Time(s)')
ylabel('speed(m/s)')
title('Drive cycle')

subplot(2,1,2)
plot(DA,'LineWidth',3,'Color','r')
xlabel('Time(s)')
ylabel('Braking energy')
title('Braking energy')
In matlab code,
- we take the time and velocity from the xlsx file and read its time& velocity value.
- By using for loop energy required for deceleration is measured for every time period and it has been stored in DA.
- from the decelearation energy we calculate total sum and mean. here sum value gives the overall energy required for braking over the drive cycle and mean value gives the average energy required.
- Then two plots were plotted. one is simply the drive cycle whereas the next graph shows the braking energy required over the time period.
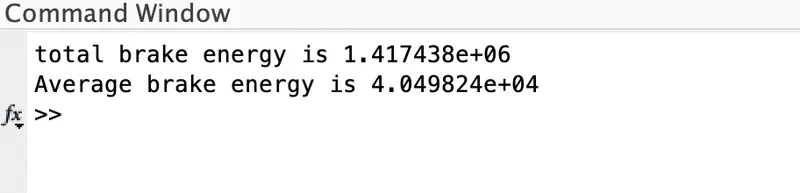
Output window:
- in command wondow, we get the total brake energy and average brake energy.
 Output graph:
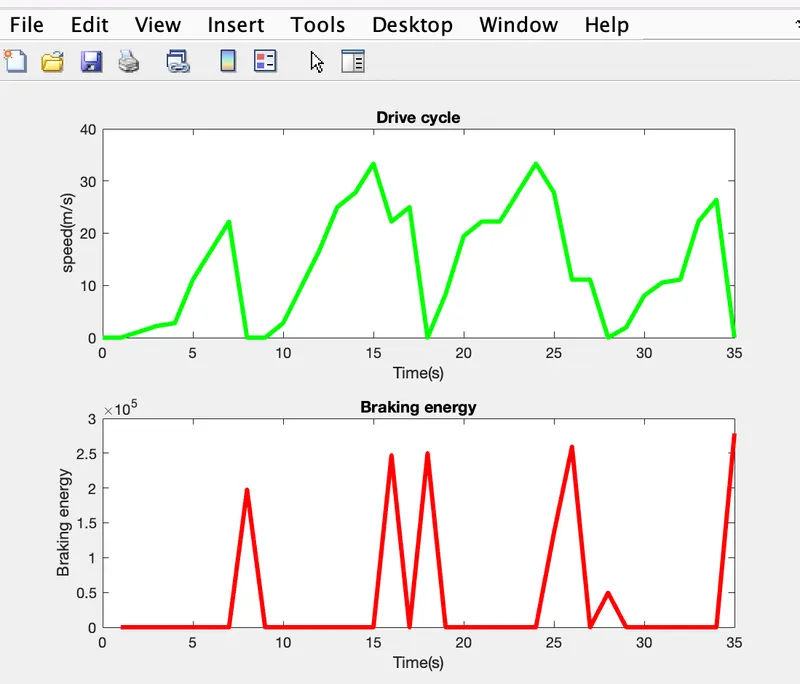
Conclusion: By using our own drive cycle, we calculated the total energy required for braking and also average energy required for braking.
2.Why electric motor can’t develop braking torque at high speed similar to starting? How electric and mechanical brakes are coordinated?
Electric motor can not develope braking torque at speed similar to starting:
with variable voltage and variable frequency three case are possible
- Below base speed. This is the constant torque region where V/f control can be applied, with low frequency voltage boosting.
- Constant power. Above base frequency there is a region where slip speed can be increased without exceeding rated currents and without coming too close to pull-out torque. Voltage must remain at the rated value, so this is a field weakening region.
- Field weakening, constant slip speed. As the field is weakened, a pint is reached where slip speed cannot be increased any further. In this region, τωe2 is constant
the four quadrant torque speed curve is given below:
By seeing the first and fourth quadrant, it is very clear that both are the mirror image of each other.
- Peak torque during acceleration and deceleration are not equal. Braking torque is not as high as acceleration.
- During Peak speed: acceleration will have high torque and deceleration will have low torque.
- Reason:regenerative braking cannot happen so effectively since all the power aren't stored back into the battery. Battery can accept typical charging current only. i.e, charging rate is lesser than the discharging rate.
Electric and mechanical brakes are coordinated:
2control stragies are there
- series brake control strategies
- parallel brake control strategies.
Series brake control strategy: Mechanical and regenerative braking are connected in series which means that it can be used one after another and could not be used at the same time.
Parallel brake control strategy: Mechanical and regenerative braking are connected in parallel which means that it can be used simultaneously. i.e, both can be used at the time.
Electric Driven intelligent Brake: It is developed by Nissan leaf.In the Electric Driven Intelligent Braking System, the braking force is provided with the help of a ECU controlled motor and ball screw arrangement. This means that no direct load on the engine while applying brakes. This means that a motor operated the brake for providing the braking energy. A more controlled and uniform braking force is applied since its ECU controlled, this helps to recover braking losses when regenerative braking system is used.
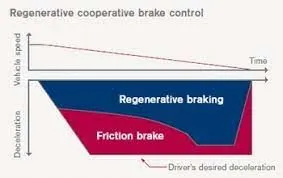
from the above graph we can conclude the following points:
- at low speed, regenerative braking increases
- at high speed, initially both braking is in combine
Conclusion: we discussed about the torque value at starting and braking situtation and also discussed about the brake control strategies.
3.Make a MATLAB program which plots contour of given motor speed, torque and efficiency values. Attach the code as a .m file attach a screenshot of all the plots.
we are going to write a m file for the plot of conyour fro given motor speed, torque and efficiency values
Program is
%set up arrays for range
w=linspace(0,1000);% speed
t=linspace(0,250);%0 to 40Nm
%assumption of motor constant
kc=0.2;%copper losses constant
ki=0.008;% iron losses constant
kw=0.00001;% windage losses constant
ConL=20;% constant motor losses

%making mesh
[X,Y]=meshgrid(w,t);
Outputpower=(X.*Y);% power=torque x speed
B=(Y.^2).*kc;
C=X.*ki;
D=(X.^3).*kw;
Inputpower=Outputpower+B+C+D+ConL;
Z = Outputpower./Inputpower;
%setting efficiency to whichmcontour plotted
V=[0.60,0.65,0.70,0.75,0.85,0.87,0.89,0.90,0.92];
box off
grid off

contourf(X,Y,Z,V);
colourbar
xlabel('speed(rpm)')
ylabel('Torque(Nm)')
hold on
V=[8000,10000];
contour(X,Y,Outputpower,V);
Explanation:
- initally we define the velocity and torque values.
- then motor constant such as ki, kw and kc are assumed.
- velocity and torque are obtained as 2D using meshgrid command.
- Input power is calculated by the sum of output power plus losses.
- Efficiency is calculated with the formula output power divided by input power.
- we define the efficiency values as V.
- At last contour graph is plotted with speed, torque and efficiency. with the help of colourbar command, color is given to contour.
- labels are given for x and y axis.
Output contour graph:
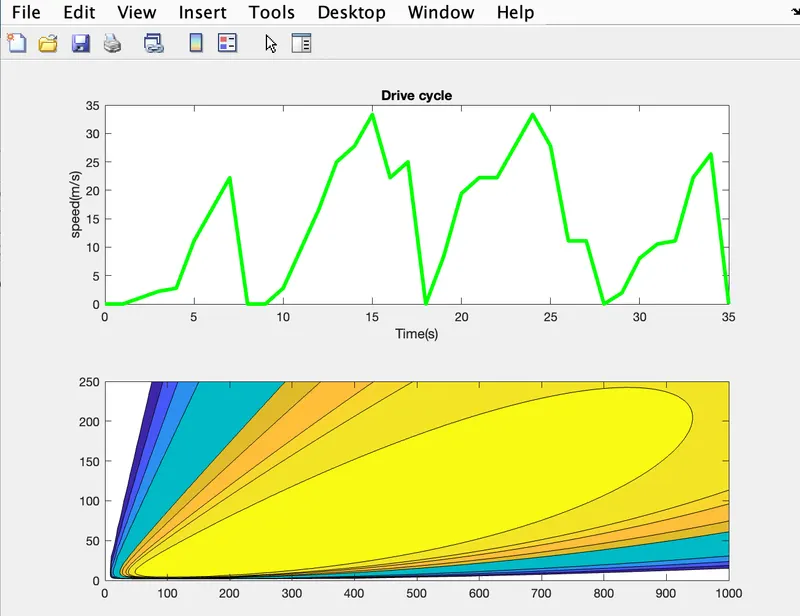
Conclusion: we developed a MATLAB program which plots contour of given motor speed, torque and efficiency valuesand also Attached the code and screenshot of all the plots.