Week-11 Challenge: Braking
PART1: For a defined driving cycle calculate the energy for "braking"
Driving cycles are set of vehicle speed points and the time, it is mainly used to analyze the battery state and energy consumption in electric vehicles.
Braking is nothing but stopping the vehicle forcefully. While applying the brakes, the vehicle which is in motion produces losses that are generated in the form of heat. The process of braking follows the law of conversation of energy that is energy neither be created nor be destroyed it can be changed from one form to another.
E = 1/2*m*v^2
Where m = mass of the vehicle in m/s
v = velocity of the vehicle in KJ
In this case, velocity will be (vi - vf), vf is the speed where braking speed starts and vi is the speed where braking speed ends.
The USSD driving cycle has taken into consideration which is stands for urban dynamometer driving schedule. Even the driving cycle has a total time of 1370s, for simpilicity, I have taken 150s only. The speed which is in miles/hour has converted to meter/second.
The driving cycle has given given
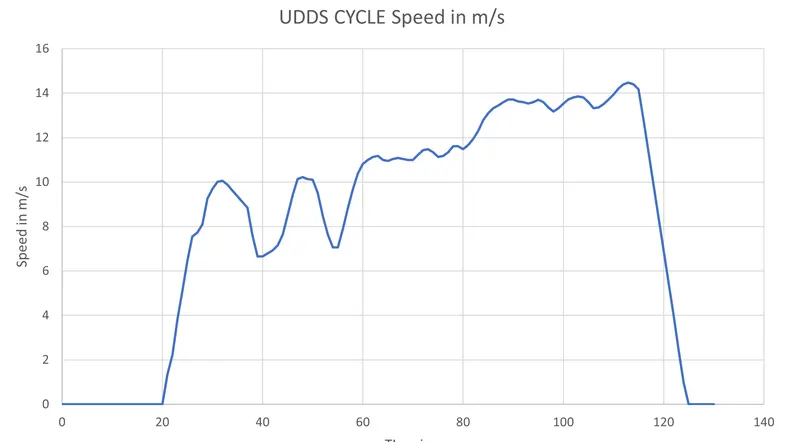
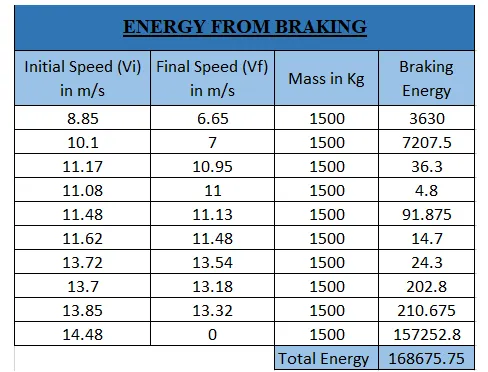
From the driving cycle, i have considered 10 braking points. The mass is set at 1500kg. The energy required for braking is given below
Matlab code for the calculation of energy consuming during accelraion and decelration
>> % Read the drive cycle data
>> DC=xlsread('Newdrivecycle (2).xlsx');
>> T=DC(:,1); %TIME IN SECONDS
>> T=DC(:,2);% SPEED IN m/s
>> %other data
>> m=1000; %mass in kg
>> % To create an array for to store the values of decelration and brakbraking energy
>> Z=length(T);
>> deceleration=zeros(1,Z);
>> accelration=zeros(1,Z);
>> BE=zeros(1,Z);
>> AE=zeros(1,Z);
>> for i=1:(length(T)-1)
if V(i)>V(i+1)
>> BE(i)=0.5*(V(i)-V(i+1))^2; %Braking energy in joules
>> speed_decreases(i)=V(i+1)-V(i);
>> decelration(i)=speed_decreases(i);
>> %since time delta is Acc/Dec=V/T...m/s^2 where T=1
>> end
>> if V(i)
>> speed_increase(i)=V(i+1)-V(i);
>> accelration(i)=speed_increase(i);
>> end
>> end
%Total braking energy in joule/sec
>> B_E=(sum(BE)/1000)
>> %total accelration energy in joule/sec
>> A_E=(sum(AE)/1000)
>> %PLOTING CURVES
>> figure(1)
>> subplot(2,1,1)
>> plot(T,S,'color','b')
>> xlabel('Time(s)')
>> ylabel('speed(kmph)')
>> title('drivecycle')
>> subplot(2,1,2)
>> plot(T,deceleration,'color','r')
>> hold on
>> plot(T,accelration,'color','g')
>> xlabel('Time(s)')
>> ylabel('Acc/Dec(m/sec^2)')
>> title('accelration-decelration')
>> figure(2)
>> plot(T,BE)
>> hold on
>> plot(T,AE)
>> xlabel('time(s)')
>> ylabel('Energy(j)')
>> title('Energy consumed during braking and required for accelrating throughout the driving cycle')
>> legend('braking energy','accelrating energy')
>> fprintf('total energy consumed during braking is% f KJ',B_E)
>> disp('')
>> fprintf('total energy consumed during accelration is%f KJ',A_E)
- An excel sheet that contains time and velocity values has to be imported into the Matlab workspace and the time and velocity values are inserted into the array
- All the values like mass and speed are defined first in the code, velocity is converted into m/s
- A for loop for the length of the time value has been created
- Acceleration and deceleration values are calculated inside a for loop
- The total energy will be calculated
- All the required inputs have been mentioned for plotting graphs
PART2: Why electric motors can't develop braking torque at high speed similar to staring.How electric and mechanical brakes are coordinated?
Let us consider the torque sped characteristics of the induction machine
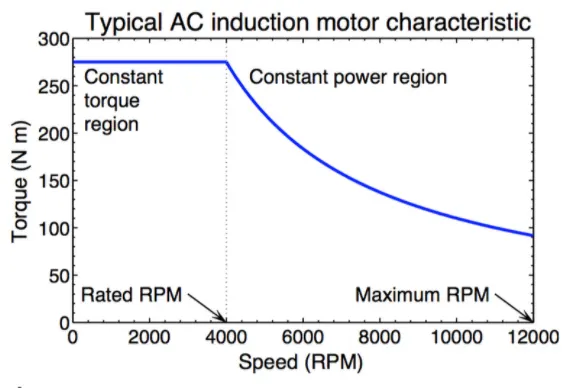
At the time of starting, the speed is very low and the torque is very high, we can observe from the graph that we have two regions, the constant torque region and the constant power region. At the time of starting, the motor achieves its peak torque and it continues till the motor achieves its critical speed. This is called the constant torque region. From there it will start dropping its torque and the region where it starts dropping is called as constant power region. Here the motor reaches its top speed and hence the torque is low, the motor is unable to produce enough braking torque in the constant power region.
In electric vehicles, two types of braking systems are used electrical braking and mechanical braking system.
Electric braking system: In electrical braking, there are different ways to produce braking torque in the vehicle. Changing input terminals, and implementing regenerative braking by using bidirectional power converters. Some other methods are also available and produce braking torque which will oppose the motion of the moving shaft or motor. depending on the method of braking applied, the motor torque-speed characteristics will obtain.
Mechanical braking system: In mechanical braking frictional force acts between the rotating part and the brake drum producing required braking. There are two common methods are used in mechanical brakes air brakes and hydraulic brakes. In the case of the disc brake system when the brake pedal is applied the friction pad rubs against disc and the kinetic energy is converted into heat and the vehicle slows down.
Coordination of electrical and mechanical braking system:
Two types of brake control strategies are used to organize elec and mechanical brake systems. They are,
- Series control strategy
- parallel control strategy
Series control strategy: When the brake is applied, according to the brake pedal travel front-wheel friction brake, the rear wheel friction brake, and the regenerative braking will applied one after another. If the braking requirement increases friction brakings will be applied subsequently.
Parallel control strategy: When the brake is applied according to the brake pedal applied, the front wheel friction brakes, the rear wheel friction brakes and the regenerating brakes are applied simultaneously. The higher the travel of brake pedal the higher the amount of braking will be done.
PART3: Make a MatLab program that plots the contour of given motor speed, torque, and efficiency values. Attach the codes as a .m file attach the screenshots of all the plots.
Iron losses: Iron losses are made of two components which are hysteresis and eddy current losses. Hysteresis losses occur as we switch the electromagnets in our motor on and off. Eddy current losses depend on many variables and it produces currents which opposes the main current.
Copper losses: Copper losses are due to the resistance of the copper conductors and the current which flows through the copper conductors is opposed by the resistance and produces heat which is called copper losses.
Windage losses: The loss caused by air friction between the rotor and surrounding air is called windage losses
Matlab program for contour plots absed on these losses
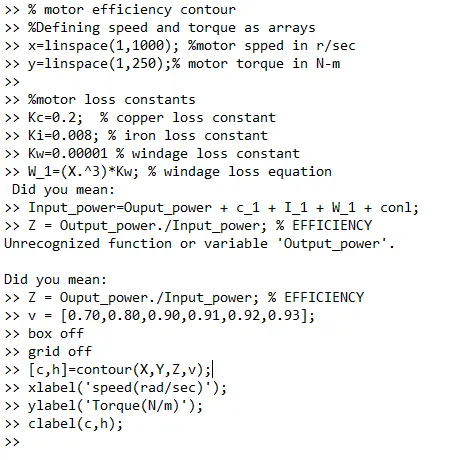
Contour plots of the above program
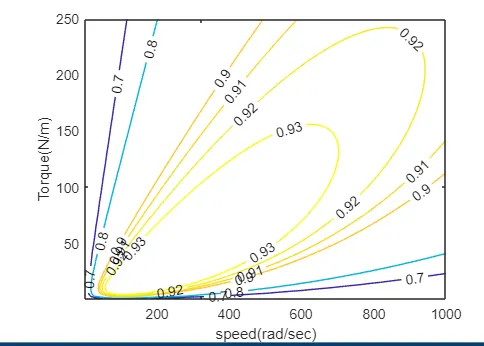
- From the plots we can observe, that speed and torque vary as efficiency increases. Greater efficiency lower the speed-torque combination is required to overcome the losses.