Week-11 Challenge: Braking
I AM A STUDENT OF LIVE BATCH-16
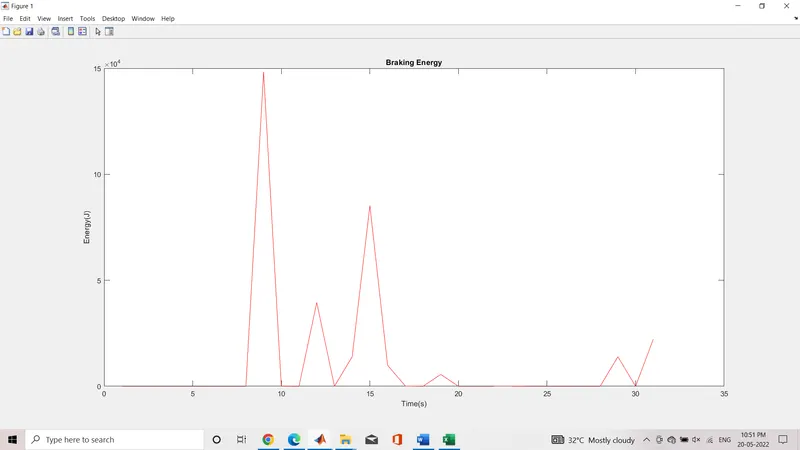
- For a defined driving cycle, calculate the energy required for braking.
SOLUTION:
.m file _https://drive.google.com/file/d/1Wp_ueDNY9DPdVMCrYFa85SEOAFGoHZf1/view?usp=sharing
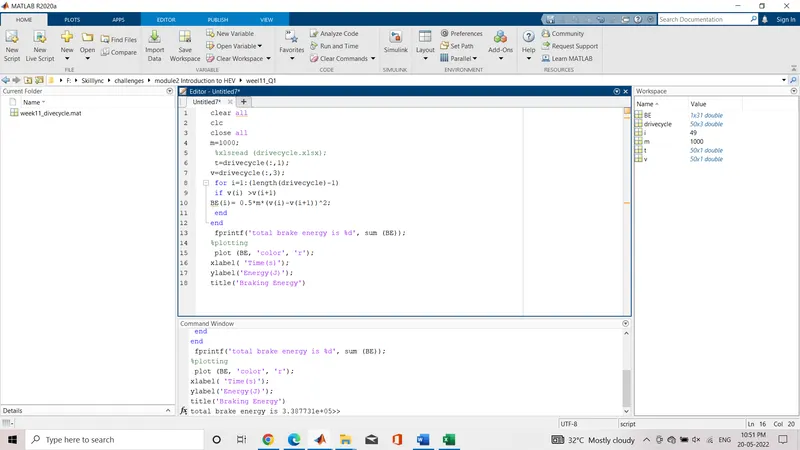
clear all
clc
close all
m=1000;
 %xlsread (drivecycle.xlsx);
 t=drivecycle(:,1);
v=drivecycle(:,3);
 for i=1:(length(drivecycle)-1)
 if v(i) >v(i+1)
BE(i)= 0.5*m*(v(i)-v(i+1))^2;
 end
end
 fprintf('total brake energy is %d', sum (BE));
%plotting
 plot (BE, 'color', 'r');
xlabel( 'Time(s)');
ylabel('Energy(J)');
title('Braking Energy')
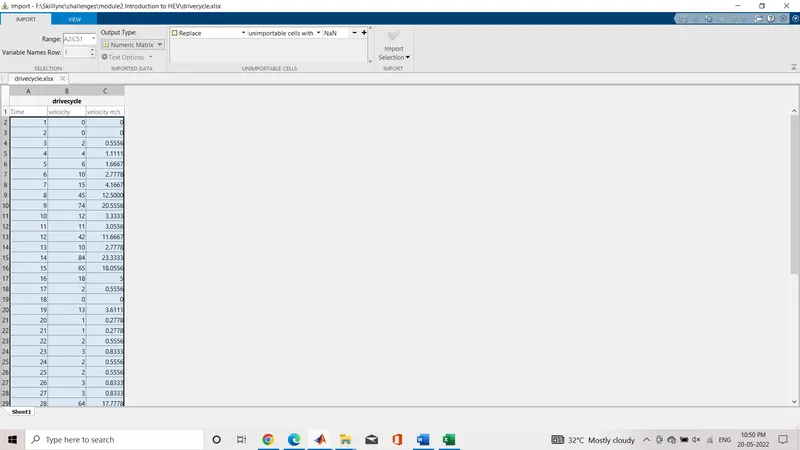
drive cycle:

IMPORTING DATA
MATLAB program:
plot:
2. Why electric motor can’t develop braking torque at high speed similar to starting? How electric and mechanical brakes are coordinated?
SOLUTION:
Electric motor can't develop breaking torque at high speed because from speed torque characteristics of motor
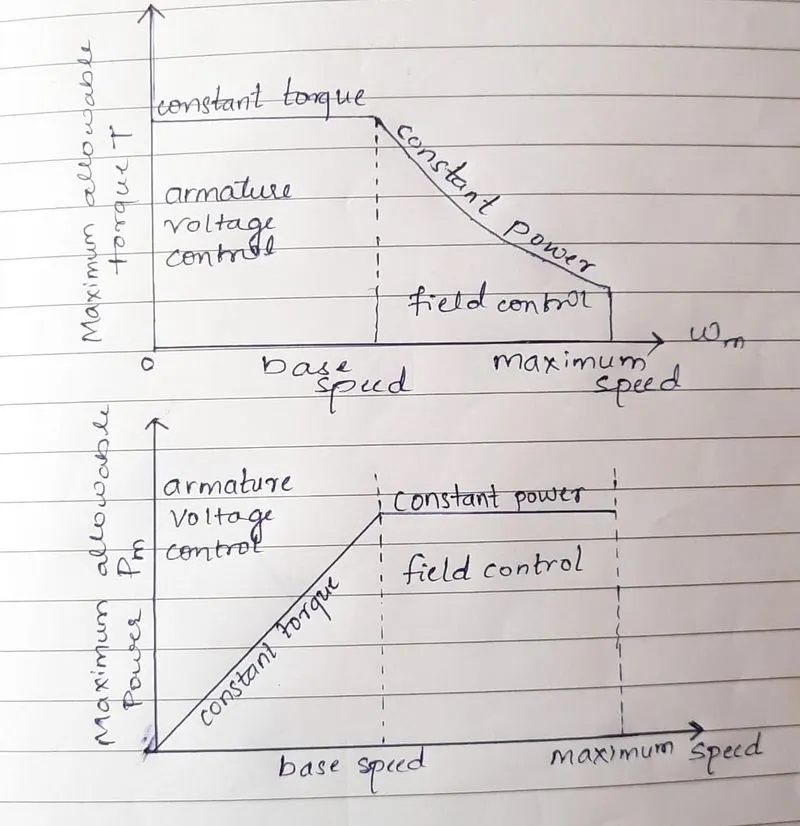
it is clearly shown in the first graph That Till the motor reaches the critical speed it has constant torque and once it reaches the critical Speed the curve is having a down slope which is a constant power region. And this graph denote the accelerating operating of the motor. For the deceleration of breaking operation of the motor the graph is mirror the down which will be having the speed positive and torque negative.
for example we can say that and EV can achieve zero to 100 km per hour in 10 second acceleration operation goes this way with low speed and high torque constant torque region is achieved which has a accelerating power and by reaching the critical speed it shifts to constant power region and thus it easy for an EV to reach 0-100 km per hour.
as said the breaking of operation graph will be the mirror image of above plot so we can say that the motor producing 7 Nm torque for acceleration can also produce - 7 Nm for breaking. Because we are operating in the field weakening region and operating above the base speed. Thus peak acceleration torque is greater than the peak decceleration torque. thus for acceleration it has high torque with low speed and for deceleration it has low torque for high speed.
In a electric motor the total breaka distribution is in to aspects which are electrical break which is called region to breaking and mechanical break or classical break with hydraulic cylindrical system. Breakfast distribution must be uniform, if the regenerative breaking power requirement is more than the charging limit of the battery or more than regenerative capacity of the machine we must apply mechanical breaks as well. In practical case the combination of these two is applied. So usually it is combined response of mechanical break and regenerate you break the reason for how this break force are combine that particular phenomena is called break control strategies there are two break control strategies which are series and parallel.
Series-In case of series we apply mechanical break and regenerative electric bake one after another. We can apply only one break strategy at a time either apply regenerative or apply mechanical break.
The series break control strategy has further classification that is based on whether we want comfort of driver or Break behaviour compared to Energy Efficiency.
Parallel-In case of parallel we apply both brakes simultaneously. This particular parallel breaking is going to happen both at a time.
Electric driven intelligent break is a combination of hydraulic break or mechanical break along with a regenerative brake. It is a parallel breaking technique. The control criteria such that at low speed use regenerative breaking higher and at high speed or during initial breaking period we actually combined the both.
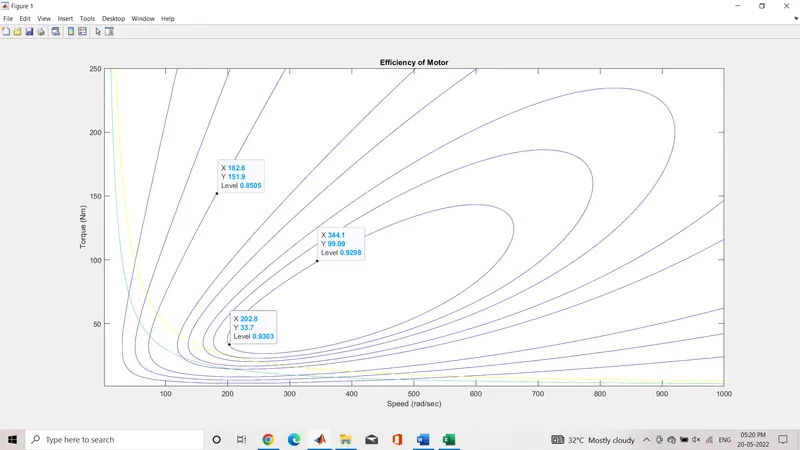
3. Make a MATLAB program which plots contour of given motor speed, torque and efficiency values. Attach the code as a .m file attach a screenshot of all the plots.
SOLUTION:
.m file_ https://drive.google.com/file/d/1IpB6H4O7AB5WyX8-n7YML2vGb8k36lBa/view?usp=sharing
x = linspace(1,1000);  % motor speed (rad/sec)

y = linspace(1,250);   % Motor Torque (Nm)

% allocate motor losses

Kc = 0.2; % copper loss

Ki = 0.008; % iron loss

Kw = 0.00001; % windage loss

ConstL = 200;   % constant loss

% now make mesh

[X,Y] = meshgrid(x,y);

OutputPower = (X.*Y);  % Power = Torque * Speed

B = (Y.^2)*Kc;  % Copper loss

C = X*Ki;  % Iron loss

D = (X.^3)*Kw;  % Windage Loss

InputPower = OutputPower + B + C + D + ConstL;

Z = OutputPower./InputPower;

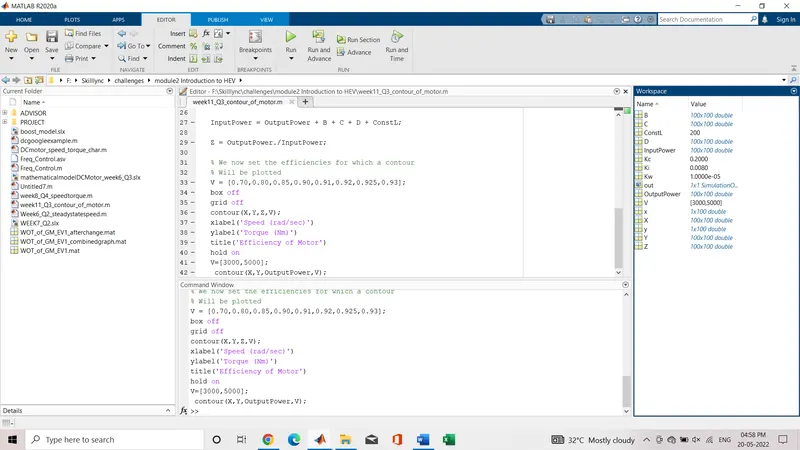
% We now set the efficiencies for which a contour
% Will be plotted
V = [0.70,0.80,0.85,0.90,0.91,0.92,0.925,0.93];
box off
grid off
contour(X,Y,Z,V);
xlabel('Speed (rad/sec)')
ylabel('Torque (Nm)')
title('Efficiency of Motor')
hold on
V=[3000,5000];
 contour(X,Y,OutputPower,V);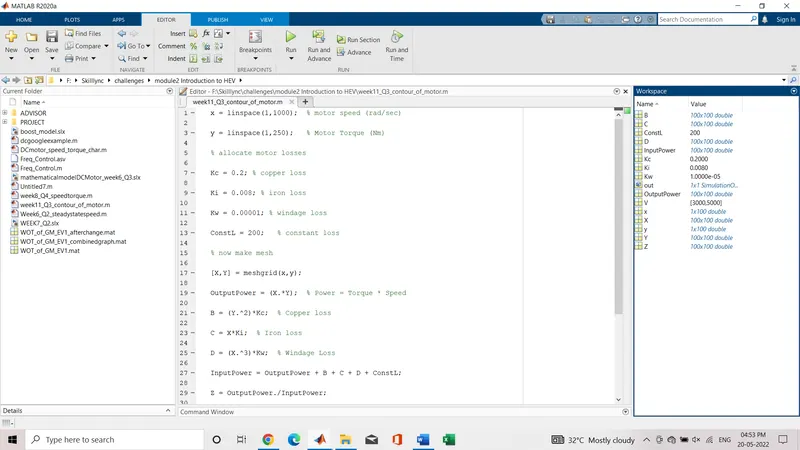
plot: