Week - 4
- Aim: Implement control logic of a “washing machine” using Stateflow as per given sequence:
- If the power supply is available, the system gets activated
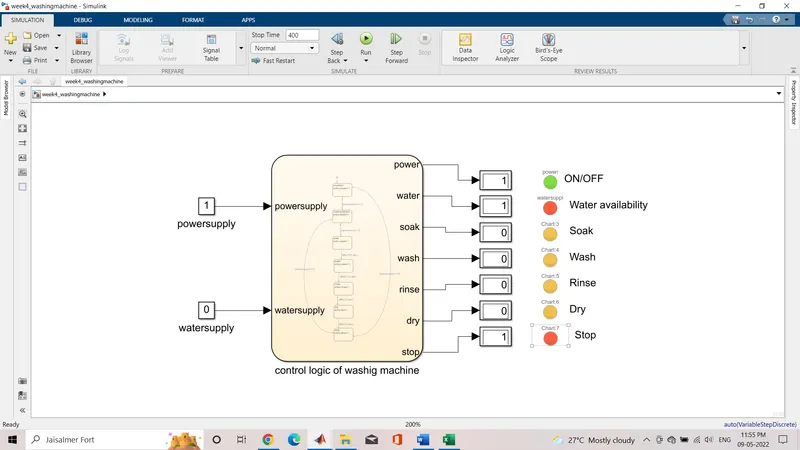
- If the Water supply is not available, stop the process & indicate through LED
- Soaking time should be 200s followed by Washing time of 100s.
- Then rinsing happens for next 20s & dryer runs for 50s
After all the processes have completed turn on the finished LED
Answer:
steps involved:
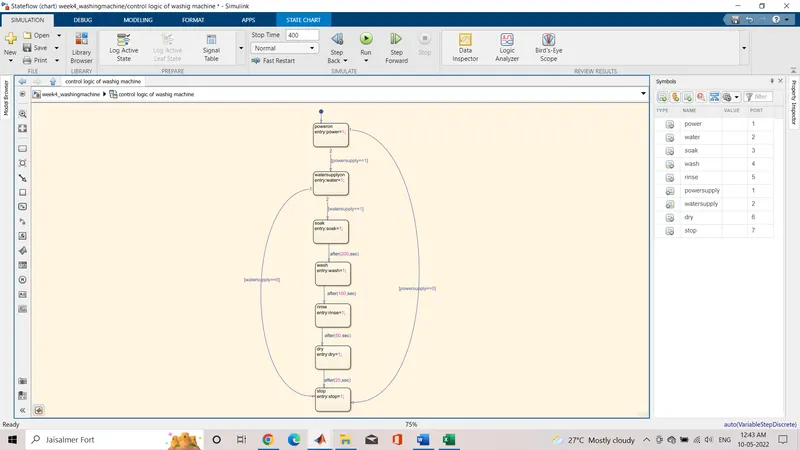
- Creator chart block for defining the state flow as per the given conditions.
- Inside it state flow or control logic of washing machine is given.
- If Power is off i.e., 0 the process is terminated and if Power is on i.e., 1 the process is processed forward.
- If water is off i.e., 0 the process is terminated and if water is one i.e., 1 the process is carried forward.
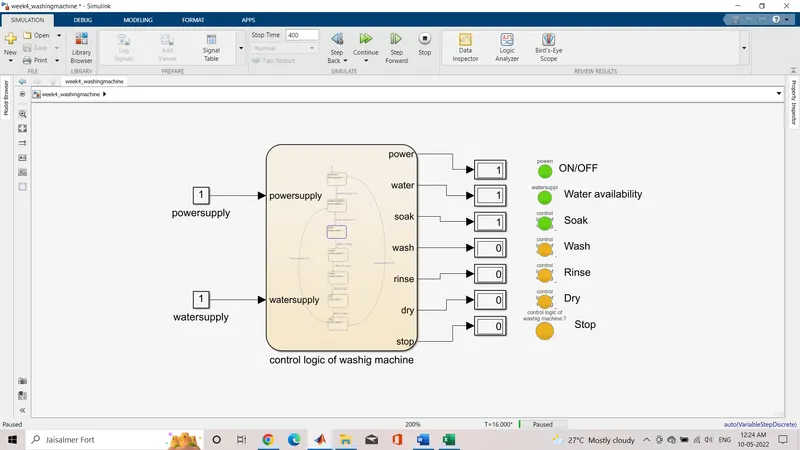
- After this soak block gets activated and soaking action takes place for 200 seconds
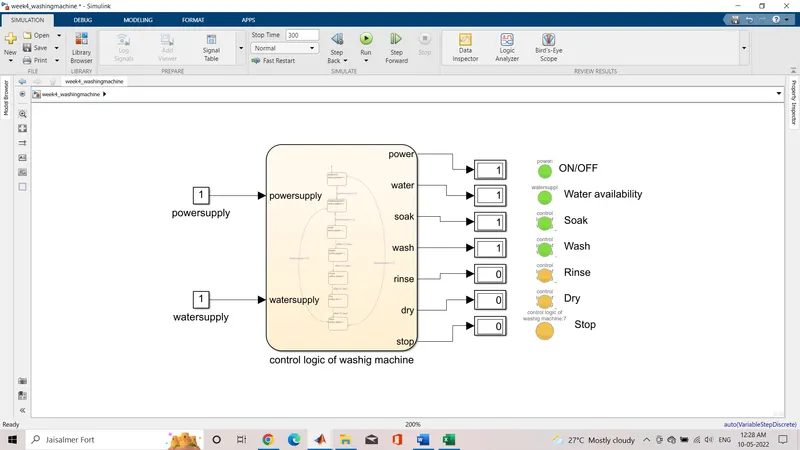
- After soaking wash blocks get activated and washing action takes place for next 100 seconds.
- Now, Rinse block get activated now and releasing action takes place for next 20 seconds.
- After rinse dry blocks get activated and drying action takes place for next 50 seconds.
- After this stop block is to terminate the signal flow in the process and exits from the chart.
- power supply and water supply are inputs whereas so wash, rinse, dry and stop are outputs
- We have connected the chart block with constant blocks for power supply and water supply inputs.
- lamps are attached to observe the on/off condition of the machine.
Blocks Used
- Chart: In an event-driven system, the system responds to an event by making a transition from one state (mode) to another. This transition occurs if the condition defining the change is true.
-
Display: The Display block shows the value of the input data. You can specify the frequency of the display. For numeric input data, you can also specify the format of the display.
-
Constant: The Constant block generates a real or complex constant value signal. Use this block to provide a constant signal input.
-
Lamp: The Lamp block displays a color indicating the value of the input signal. You can use the Lamp block with other Dashboard blocks to build an interactive dashboard of controls and indicators for your model. You can specify pairs of input values and colors to provide the information you want during the simulation.
Stateflow or contro logic of washing machine is shown below:
when the powersupply=1 & watersupply=0 lamp(water availability) is glowed red
when the powersupply=1 & watersupply=1 machine is activated and soak action is carried for 200 seconds
when the powersupply=1 & watersupply=1 wash process is done for 100 seconds
when the powersupply=1 & watersupply=1 rinse is done for 50 seconds
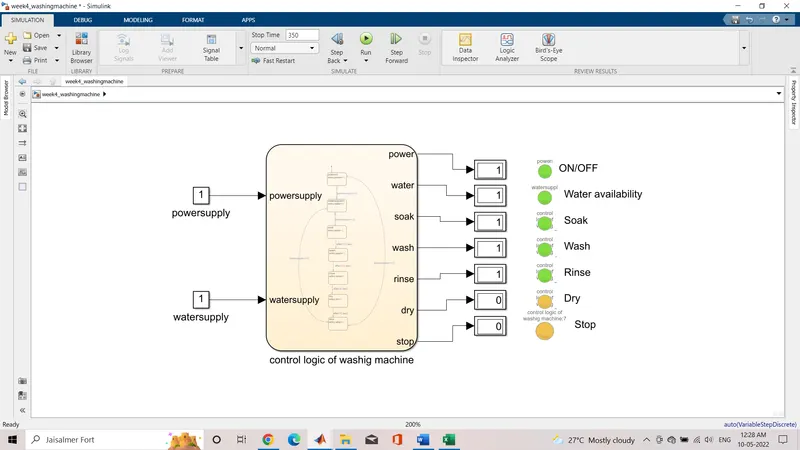
when the powersupply=1 & watersupply=1 dry is done for 20 seconds and machine is stoped and res led is glowed:
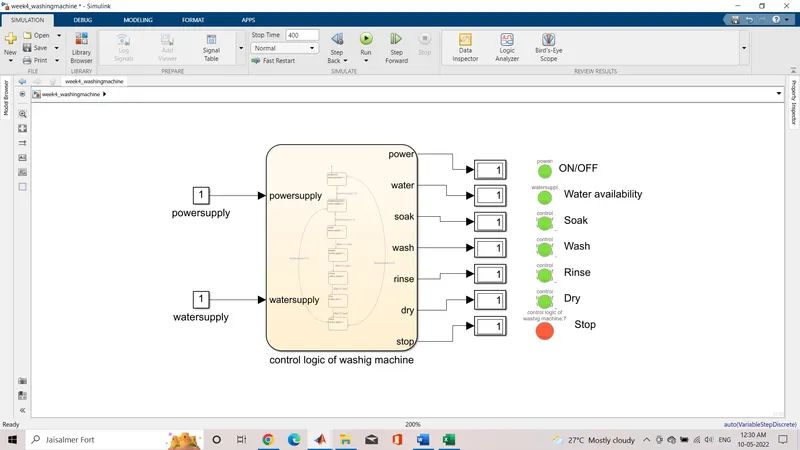
Conclusion:
hence washing machine control logic is carried out successefully. At respective time is implemented and LED is glowed green for state1 and red for state 0 and display block is used to show output. For this stateflow chart logic is applied which is mentioned above.
2. Aim: Make a Simulink chart for the “Gear shift” logic as per below conditions:
Speed Range(kmph) Gear
0 to 15 1
16 to 25 2
26 to 40 3
41 to 60 4
Above 61 5
Give speed input while the simulation is running & display the gear number.
Answer:
Blocks Used
- Chart: In an event-driven system, the system responds to an event by making a transition from one state (mode) to another. This transition occurs if the condition defining the change is true.
-
Display: The Display block shows the value of the input data. You can specify the frequency of the display. For numeric input data, you can also specify the format of the display.
-
Constant: The Constant block generates a real or complex constant value signal. Use this block to provide a constant signal input.
-
Lamp: The Lamp block displays a color indicating the value of the input signal. You can use the Lamp block with other Dashboard blocks to build an interactive dashboard of controls and indicators for your model. You can specify pairs of input values and colors to provide the information you want during the simulation.
-
Slider: The Slider block tunes the value of the connected block parameter during the simulation. We can modify the range of the Slider block's scale to fit our data. Used the Slider block with other Dashboard blocks to create an interactive dashboard to control model.
explanation:
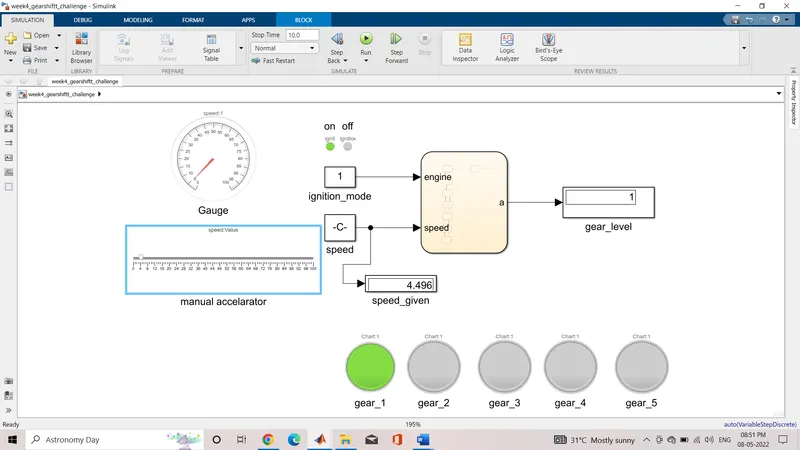
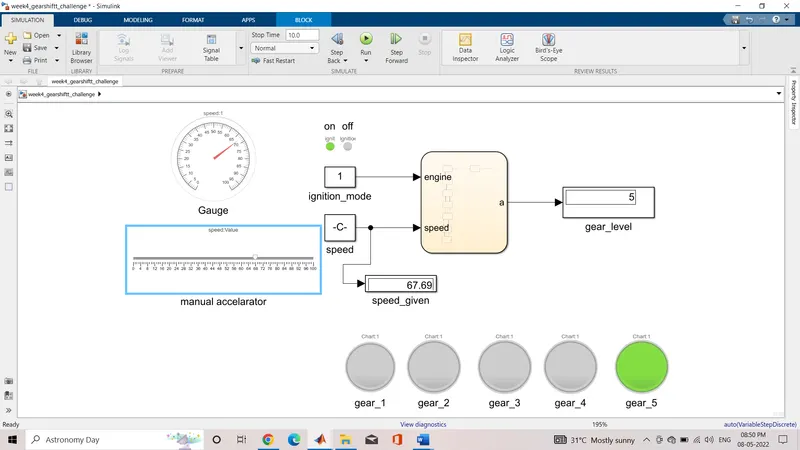
- The state flow chart is having two inputs which are speed and engine. The speed input is connected with a constant named speed and engine input is connected with the constant named “speed” the speed constant is connected to slider switch.
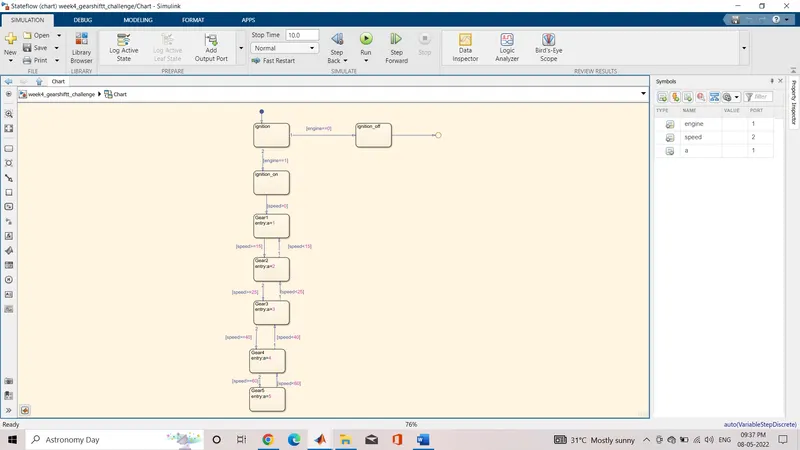
- In state flow chart by checking ignition condition, we take engine as input giving the condition as engine==0 this will execute when the constant value is zero that is when the vehicle is turned off and another condition as engine==1 this will execute when the constant value is 1 that is when the vehicle is turned on.
- After the ignition condition is turned on the state flows to the next process. Speed conditions are defined for each block. When it executes the speed condition the process flow to the next block. All the conditions have been assigned to each block.
- The state flow chart has one output named “a” these outputs are connected to the display blocks. The display block connected with output “a” is named as gear level.
- The gear level display block displays the exact gear at which the vehicle is running.
- Five lamps have been connected to the display block in order to turn on the lamp for each gear ratio that is done by assigning different state values for each lamp.
Speed ranges from 0 to 100 kmph and the slider block is used to send the input speed.
The first gear has speed values is in between 0 to 15 kmph this is the entry condition and the exit condition is above 15kmph similarly for second gear the entry condition is between 16 to 25kmph and the exit condition is above 25 kmph and for 3rd gear entry condition is between 26 to 40 kmph and exit condition is above 40 kmph and for 4th gear entry condition is between 41 to 60 kmph and exit condition is above 60 kmph and for 5th gear entry condition is above 60 kmph and exit condition is below 60kmph first in this way for each gear the entry and exit condition are specified and the output is mapped to the lamp and the display block where we can see the results as per the conditions.
stateflow of gear shift:
Simulink model when the ignition is off red light is blowed:
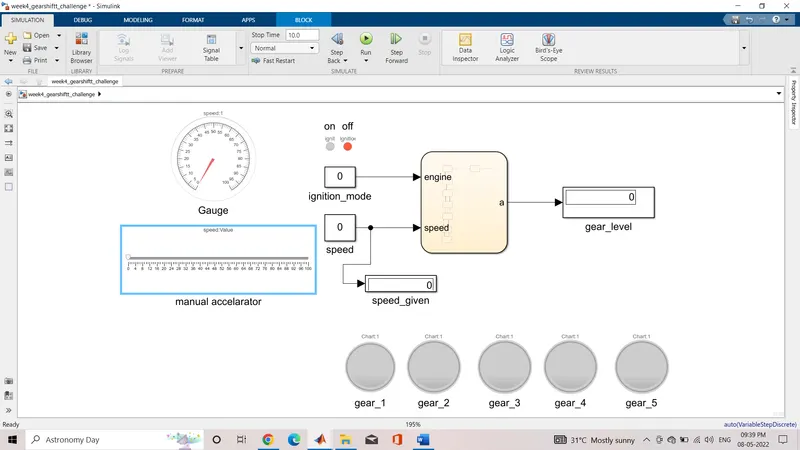
when the ignition is on green light is blowed:
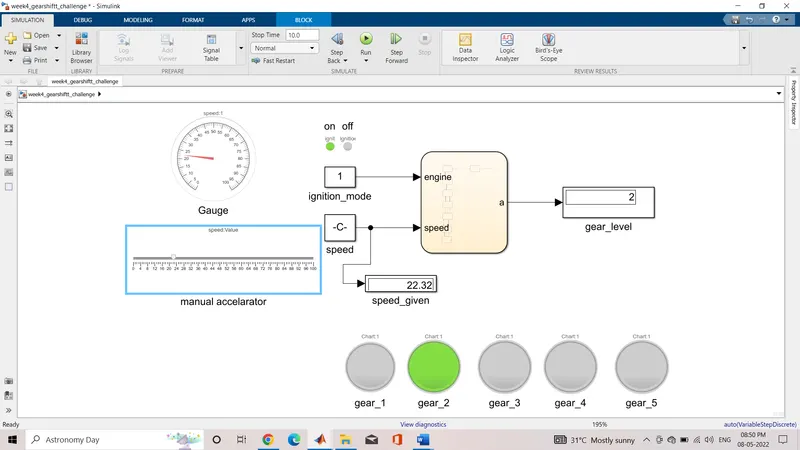
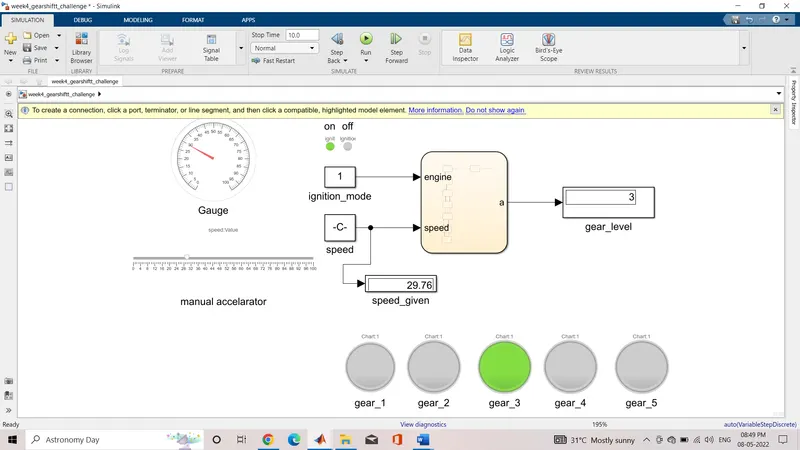
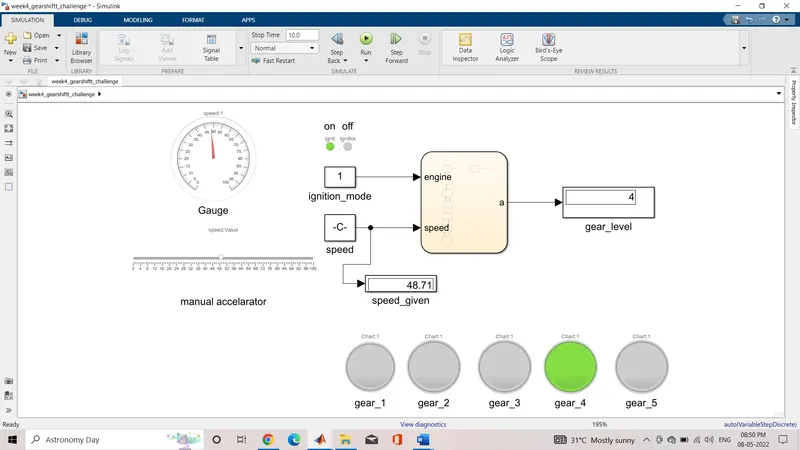
Simulink Model at different speeds
At 0<speed<15 kmph
example: speed= 4.496 kmph
At 15<speed<25 kmph
example: speed= 22.32 kmph
At 25<speed<40 kmph
example: speed= 29.76 kmph
At 40<speed<60 kmph
example: speed= 48.71 kmph
At speed>60 kmph
example: speed= 67.69 kmph
CONCLUSION:
Thus the control logic of gear shift using state flow is processed by using slider gain the values are obtain. At respective speed respective gear is implemented and LED is glowed green and display block (gear_level) is used to show output. For this stateflow chart logic is applied which is mentioned above.