Week-11 Challenge: Braking
Ans1
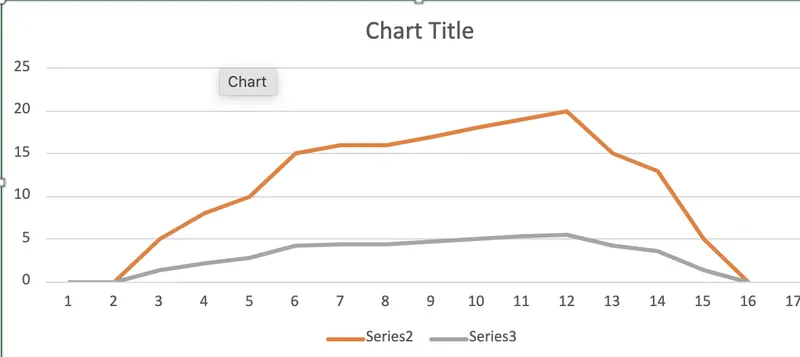
We have below drive cycle we are going to calculate braking energy for the given cycle
the vehicle started braking from 12 to 16 as shown in the graph
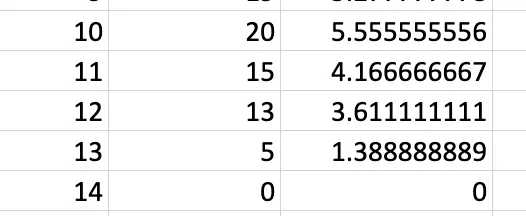
I have taken total weight of the vehicle as 5000kg
braking energy=1/2*M(V1-V2)^2 N-M
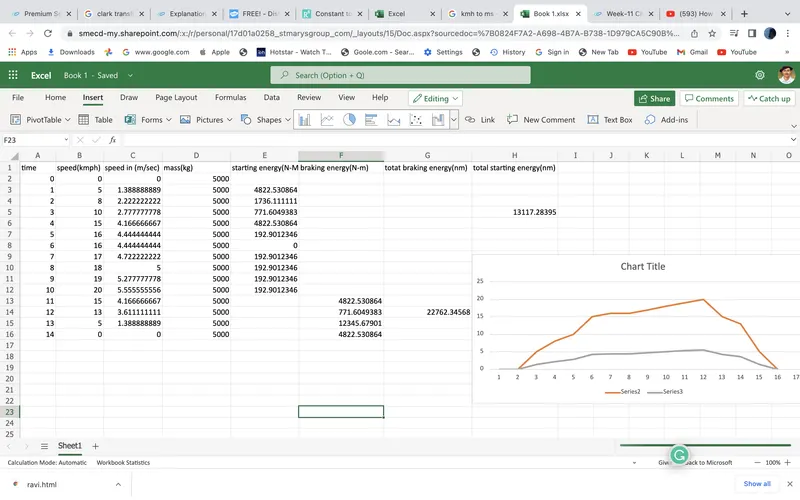
total braking energy=22762.34568 N-M
Ans 2
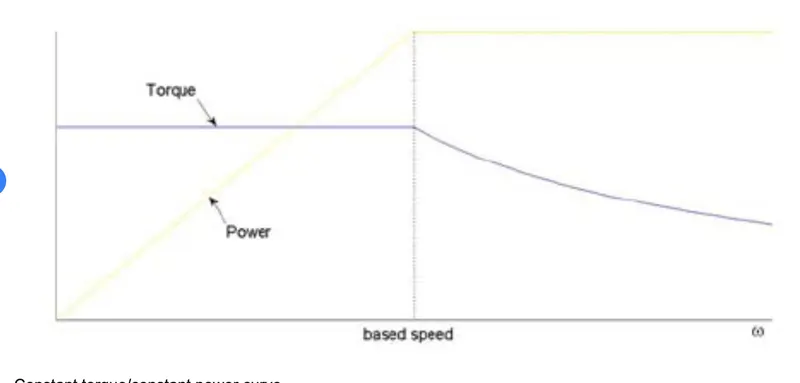
The reason why braking torque at the starting is not equal to the braking torque at high speed-
As we can see in the graph at low-speed braking torque is constant but after based speed, braking torque has been reduced gradually because while making the ratio of V/F constant till based speed torque was constant but after rating voltage, we cannot increase the voltage of the vehicle due to insulation failure so as we are unable to increase the voltage, torque is started getting reducing gradually
Due to this braking torque at the starting is not similar to braking torque at high speed
Electric and mechanical brakes coordination-
There are two types of electrical and mechanical braking
(i)-Series braking
(ii)-Parallel braking
Series coordination-
In this braking electrical and mechanical brakes or working one after another
both brakes are not applied at any time.
Parallel coordination-
In this braking electrical and mechanical brakes are working together to stop the vehicle.
Electric driven intelligent brake in Nissan leaf is shown below
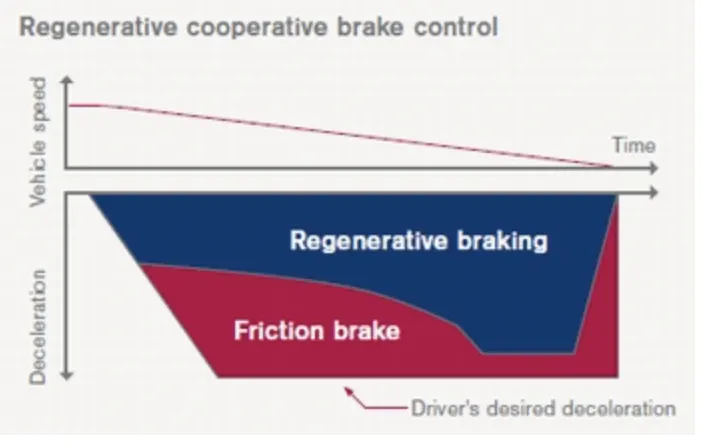
at the high speed only electrical brake applied after some time electrical and mechanical both the brake is applied in which mechanical brake has more percentage. after some time again electrical brake percentage is high so this is the sharing of brake in Nissan leaf vehicle.
Ans 3
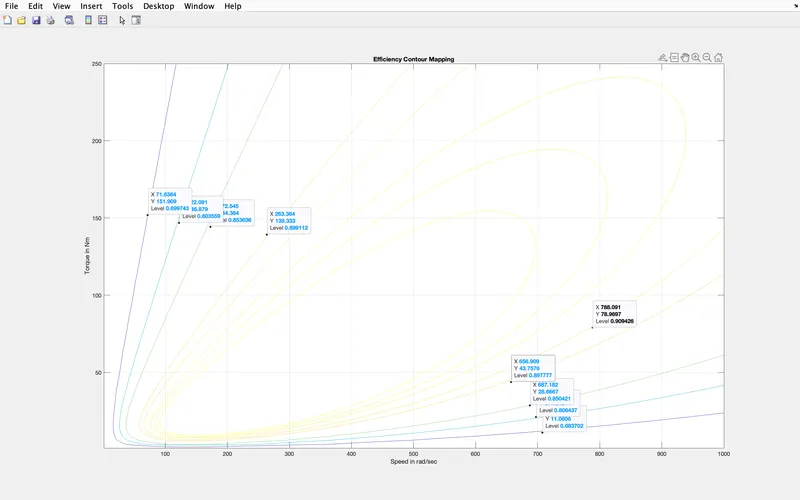
MATLAB program which plots contour of given motor speed, torque and efficiency values is given below-