Week-11 Challenge: Braking
1) Energy required for braking for a defined drive cycle:
Acceleration is similar to deceleration where acceleration is increase in speed and decerlation is decrease in speed. In the similar way the amount of power required for braking can be calculated. The amount of power required for acceleration is same for braking.
Energy = (1/2)Mv^2
M - mass of the vehicle in kg
v - Velocity in m/s
If vi - initial velocity and vo- final velocity
then Energy = (1/2)*M*(vo-vi)^2
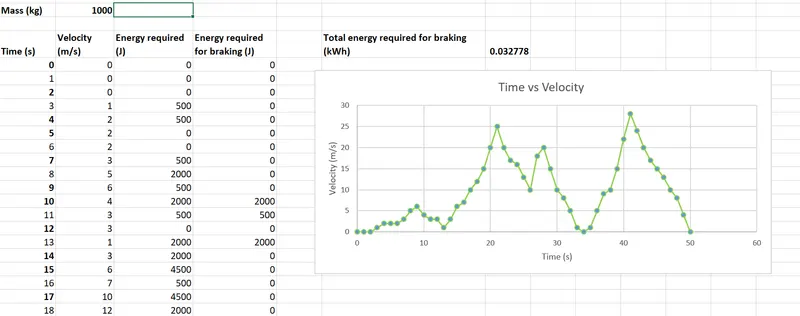
Implementing the formula in excel sheet for a defined driving cycle
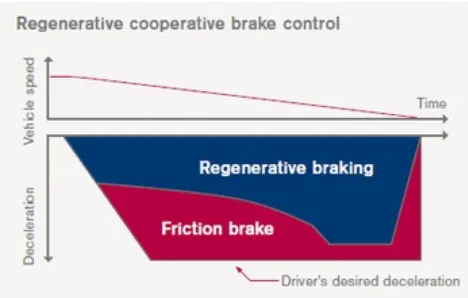
2) The total brake force distribution is bifurcated between Regenerative braking (electrical) force and Mechanical Braking Force. Usually the combination of mechanical and regenerative braking is applied.
This phenomema is called brake control strategy.
During low speed the torque generated by the motor is almost constant and it operates in the constant torque region. Therefore higher acceleration power is possible. As the vehicle speed increases the motor starts operating in the constant power region. So it is easier for the vehicle to achieve high speed with this method. But at the same high speed, during braking the torque produced by the motor will be lesser than the peak torque value. At acceleration the torque produced by the motor will be high but at deceleration the torque developed by the motor will be low above the base speed. Thus the peak acceleration torque and the peak deceleration torque are not equal for electric vehicle motor.
Hence Electric motor can't develop braking torque at high speed similar to starting.
This is the limitation for regenerative braking from motor side. Another limitation will be on charging the battery where the battery can accept a typical charging current. During acceleration the battery can discharge at double rate than the charging rate due to the chemical limitations and considering the life of the battery. Thus the battery charging rate is less than the battery discharge rate.
Another limitation is to get the power from motor to battery, a power converter is also required for reverse direction of power flow.
Another application of braking force is whether it is applied in the front axle or rear axle. The front axle require a higher amount of braking force than the rear axle. The percentage sharing between front and rear axle should be performed considering the safety factors and the driving direction should be maintained.
There are two brake control strategies:
1. Series brake control strategy: Mechanical and regenerative brakes are applied one after the other ie only one brake strategy is applied at a time
2. Parallel brake control strategy: Both mechanical and regenerative brakes are applied together. This strategy has been used by Nissan leaf as Electric Driven Intelligent Brake. At higher speed both regenerative and friction braking is applied. Whenever the speed of the vehicle reduces, the torque produced by the motor is high and the percentage sharing to the regenerative braking will be increased. Thus at low speed, the percentage of regenerative braking is higher and at high speed, both the friction (mechanical) and regenerative braking will be applied.
This control is detected from the pedal of the brakes and the control signals should be diverted to mechanical and regenerative brakes
3) Matlab Script for Speed Torque and Efficiency relationship:
clc
x=linspace(1,1000,250); %Speed in rad/sec
y=linspace(1,250,250); %Torque in Nm
%Motor loss constants
kc=0.2;  %Copper loss constant
ki=0.008;  %Iron loss constant
kw=0.00001;  %Windage loss constant
CL=20;  %Constant motor loss
[S,T]=meshgrid(x,y); %2D conversion
%Efficiency calculation
Output_power=(S.*T); %output Power = Torque x Speed
B=(T.^2)*kc; %Copper loss
C=S.*ki; %Iron loss
D=(S.^3)*kw; %Windage loss
Input_power = Output_power + B + C + D + CL;
Eff = Output_power./Input_power; %Efficiency calculation
V = [0.05,0.60, 0.70,0.80,0.90,0.91,0.92,0.925,0.93, 0.95]; %Efficiency points to be plotted
box off
grid off
contour(S,T,Eff,V);
xlabel('Speed (rad/sec)');
ylabel('Torque (Nm)');
Output plot:
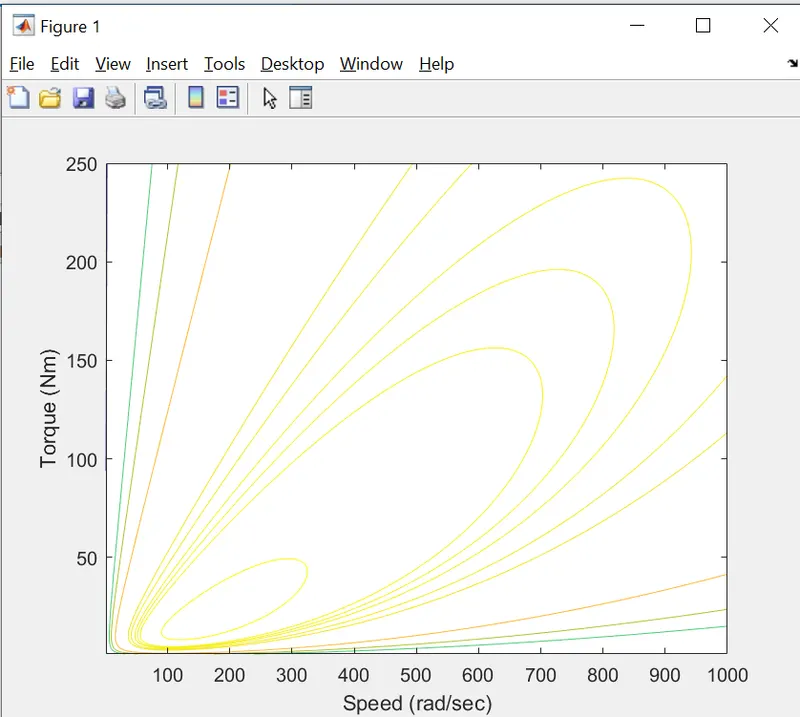
Conclusion: The higher efficiency is observed at the inner contours