Week-11 Challenge: Braking
1. For a defined driving cycle, calculate the energy required for braking.
Solution: A driving cycle is a series of data points representing the speed of vehicle versus time. Driving cycles are produced by different countries and organisations to assess the performance of vehicles in various ways, as for instance fuel consumption, electric vehicle autonomy and polluting emissions. The use of drive cycles is in vehicle simulations. More specifically, they are used in propulsion system simulations to predict performance of internal combustion engines, transmissions, electric drive systems, batteries, fuel cell systems and similar components.
Here i have given the value of velocity which is in kmph and calculated the energy required for braking through the following formula,
Energy required for braking = 1/2 ×mv²
Where m = mass of the body, which is taken as 1000g,
v = velocity in kmph.
Here we are considering the UDDS driving cycle, which is a typical urban driving cycle with average speed, frequent braking and acceleration.
The following figure shows the UDDS driving cycle which is plotted with the values i have given.
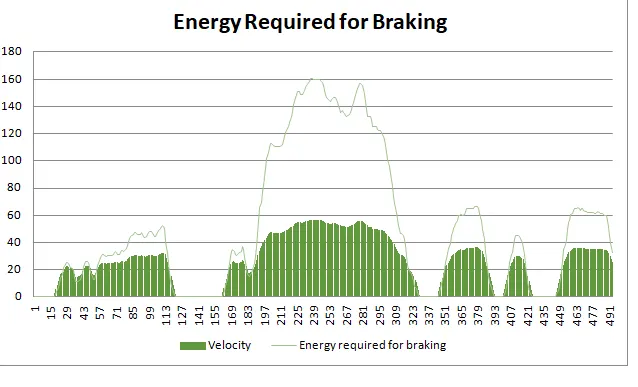
From the above diagram it can note that the peak energy required for braking is 160KJ and which represents at a velocity of 56.6kmph. This valuue can be observed in the excel sheet calculation. The following figure shows it.
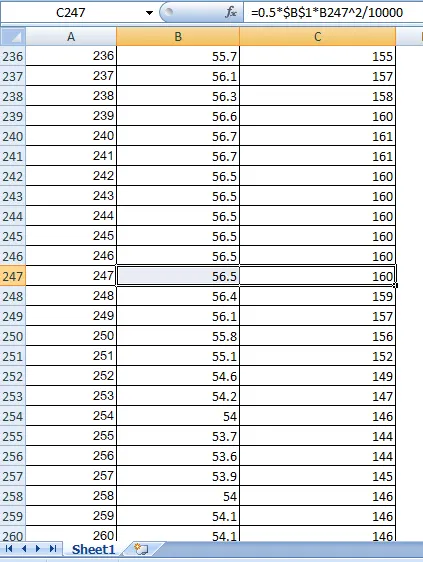
The energy required for braking is calculated at each point which is listed in the following excel sheet.
2. Why electric motor can’t develop braking torque at high speed similar to starting? How electric and mechanical brakes are coordinated?
Solution: First will see what is Starting torque and braking torque,
Starting torque: The starting torque is the required amount of energy that is used to overcome the inertia of standstill. That is also known as pull-up torque, its is the minimum torque generated by a motor to accelerate it from static position to the operating speed.
Braking torque: Braking torque is the force applied at the brake wheel to stop the motion of the moving equipment. Assuming the operating conditions for the equipment are constant, a brake having a retarding torque equal to the full load torque of the motor to which it is applied.
The followig figure shows the starting torque of an induction motor.
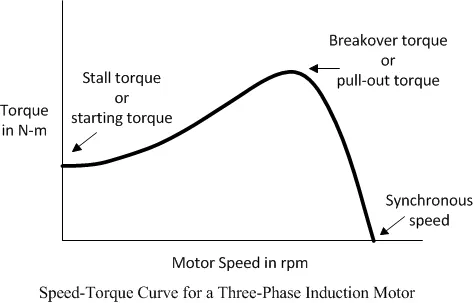
An Electric motor can't develop braking torque at high speed similar to starting torque because braking torque is applied in the opposite direction of the rotation. When the motor is at rest, it will operate from standstill position to the reach the moderate speed, the higher torque is required to bring the motor into this operating mode. Whereas, when the vehicle is already at high speed,the limit is reached by the motor operation and thus any further higher torque could not be obtained while braking. The braking operation happens in the motion which is been distributed as per proportion in the brake energy. By applying a braking torque at high speed RPM, there is a chances for motor failure or damage.So we cannot develop braking torque to an electrical motor when it is running with higher speed.
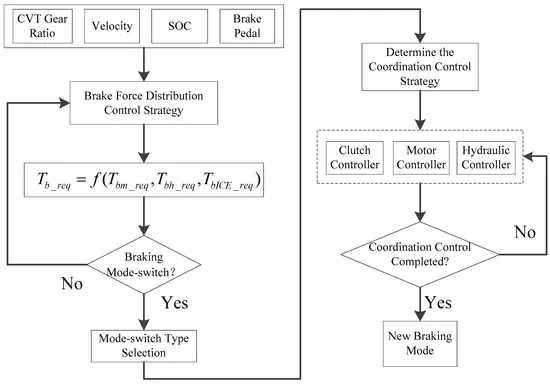
Electric and mechanical brakes are coordination: Braking mode switches are significant events during braking. It is difficult to coordinate torque fluctuations caused by mode switches because the dynamic characteristics of braking systems are different. By considering the Plug in hybrid vehicle and braking mode switches are divided into 2 types. The control strategy of type one is achieved by controlling the change rates of clutch hold down and motor braking forces. The control strategy of type two is achieved by simultaneously changing the target braking torque during different mode switch stages and controlling the motor to participate in active coordination control. The following figure shows the Braking mode switch classification.
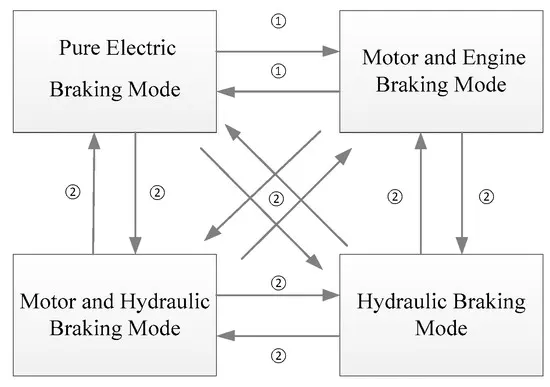
The braking mode switch type is divided into 2 categories as shown in the above figure. Braking mode switch coordination control strategies are developed for the different braking mode switch types.
- Type one: Braking mode switch without hydraulic braking system participation. In this type of mode switching it is necessary to control the engagement of the clutch and the change rate of motor torque. Thus, the fluctuation caused by mode switch can be reduced.
- Type two: Braking mode switch with hydraulic braking system participation. Due to the different dynamic response characteristics of the motor and the hydraulic braking systems, this switch mode is difficult to coordinate. The idea of coordinating control is to take full advantage of the characteristics of the braking system. The hydraulic system provides large and stable torque, and the motor braking systems torque response is quick and accurate, reducing the fluctuation of the vehicle.
The overall coordination control flow chart is shown in the following figure.
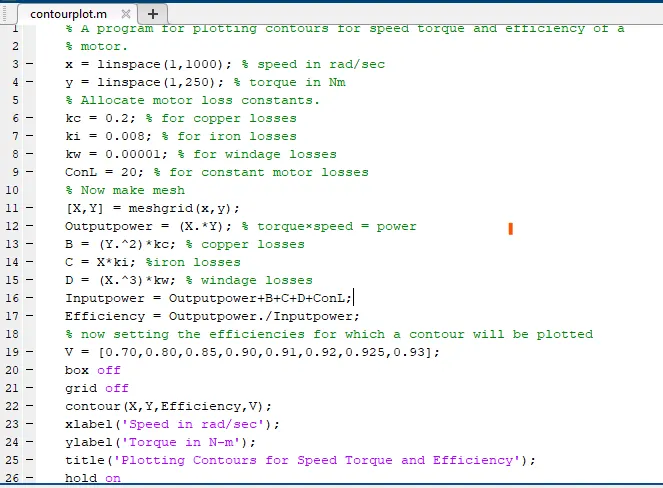
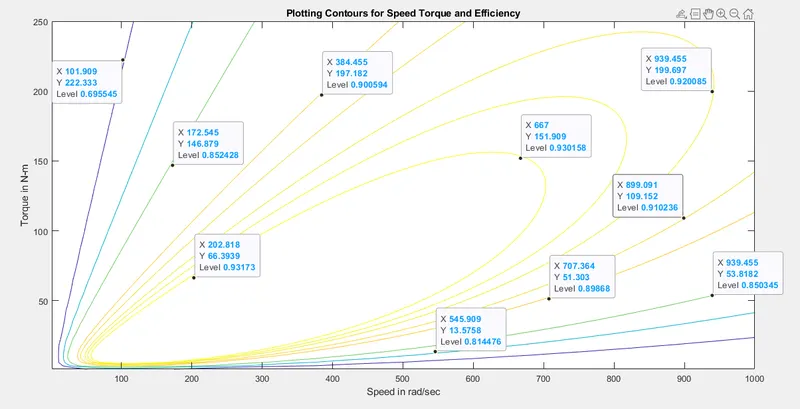
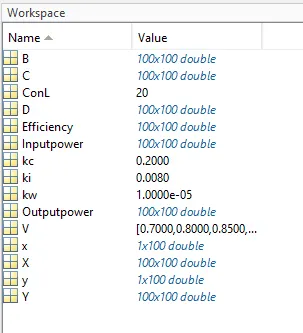
In the workspace window we can observe the data of our inputs. Which is shown in the following figure.
Hence Contour plots are been plotted for the speed, torque and efficiency of a motor.