Week-11 Challenge: Braking
Question 1
To calculate the braking energy required for a particular driving cycle.
The drive cycle is created as follows:
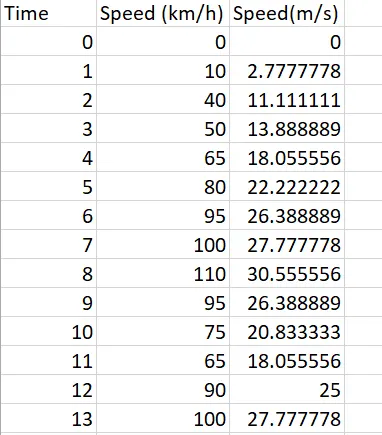
The following MATLAB code is written to obtain the braking energy. Every time there is a decrease in velocity the code calculated the kinetic energy required to reduce the velocity to its current value from the previous value.
The code written in MATLAB is as follows:
close all
clc

%%Vehicle parameters%%%
mass=1000;
A=xlsread('Week11.xlsx');
time=A(:,1);
velocity= A(:,3);
braking_energy=zeros(1,length(time));
deceleration=zeros(1,length(time));

for i=1:(length(A)-1)
    if velocity(i)>velocity(i+1)
         decreased_velocity(i)=velocity(i+1)-velocity(i);
         difference_in_time(i)=time(i+1)-time(i);
         deceleration(i)=decreased_velocity(i)/difference_in_time(i);
        braking_energy(i)=0.5*mass*((velocity(i))^2-(velocity(i+1))^2)/3600;
    end
end

fprintf ('Total braking energy for the driving cyle is %f W.h', sum(braking_energy));
%%Plots
figure
subplot(3,1,1)
plot(time,velocity,'linewidth',2,'color','k')
xlabel('Time period of the cycle (sec)');
ylabel('Velocity(metres per second)');
title('The Drive Cycle');

subplot(3,1,2)
plot(time,deceleration,'linewidth',2,'color', 'r')
xlabel('Time period of the cycle (sec)');
ylabel('Velocity(metres per second)');
title('Deceleration in the Drive Cycle');

subplot(3,1,3)
plot(time,braking_energy,'linewidth',2,'color','b')
xlabel('Time period of the cycle (sec)');
ylabel('Braking energy (W.h)');
title('Braking energy in the Drive Cycle');
The resulting graphs for the drive cycle, the deceleration observed and the braking energy are as follows:
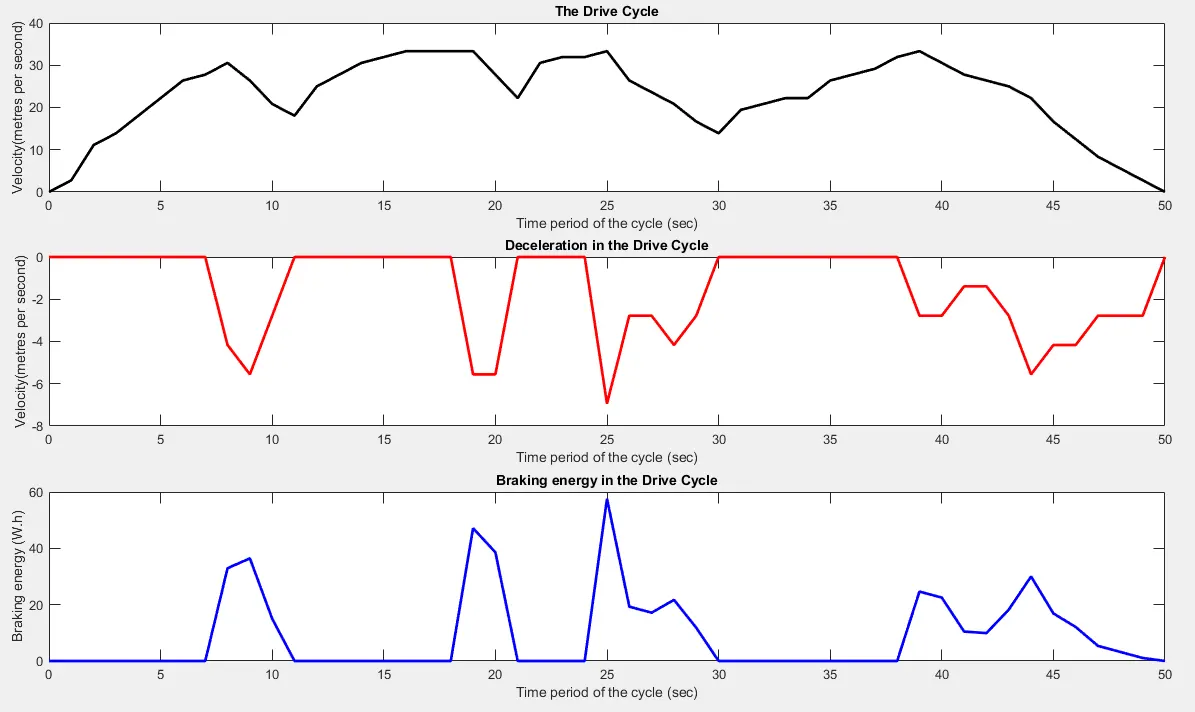
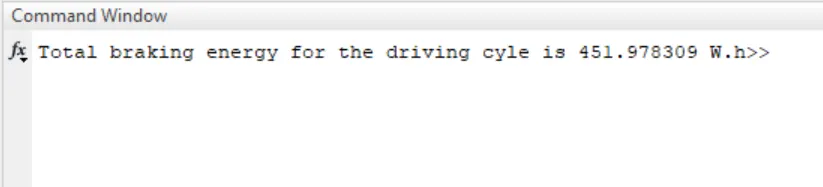
The braking energy obtained is as follows: 451.978 Wh.
The code files can be accessed at: https://drive.google.com/drive/folders/1W2D1bnWy5b8q6ZV8nIrLXtAoMPWM5B55?usp=sharing
Question 2
(i)Why electric motor can’t develop braking torque at high speed similar to starting?
The electric motor cannot develop braking torque at high speed similar to the starting operation because braking torque is applied in the opposite direction of rotation.
Regenerative braking takes place when the speed of the motor exceeds the synchronous speed. The main criteria for regenerative braking is that the rotor has to rotate at a speed higher than synchronous speed, only then does the motor act as a generator and the direction of current flow through the circuit and direction of the torque reverses and braking takes place.
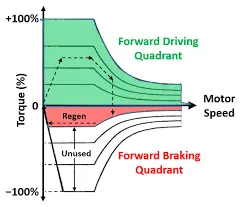
Peak acceleration torque and peak deceleration torque are not equal for electric vehicle motor.
During acceleration, at a low speed we get but at higher a high torque value which is the constant Torque region of operation and when the speed increased beyong a point the torque gradually decreases which is known as the constant power region.
So during high speed, the motor will be in the constant power region for both the accelerating and braking operations. But since the peak torque value for deceleration is lower to start with (at lower speeds) the torque value for higher speeds is also lower during the braking.
(ii) Coordination of electrical and mechanical braking
One of the most important features of HEV’s is their ability to recover significant amounts of braking energy. The electric motors can be controlled to operate as generators during braking to convert the kinetic energy of the vehicle into electrical energy that can be stored in the energy storage system and reused. However, the braking performance of a vehicle also greatly affects vehicle safety. In an emergency braking situation the vehicle must be stopped in the shortest possible distance and must be able to maintain control over the vehicle’s direction. The latter requires control of brake force distribution to the wheels .
Generally, the braking torque required is much larger than the torque that an electric motor can produce . Therefore, a mechanical friction braking system must coexist with the electrical regenerative braking. This coexistence demands proper design and control of both mechanical and electrical braking systems to ensure smooth, stable braking operations that will not adversely affect vehicle safety.
Methods of Regenerative Braking
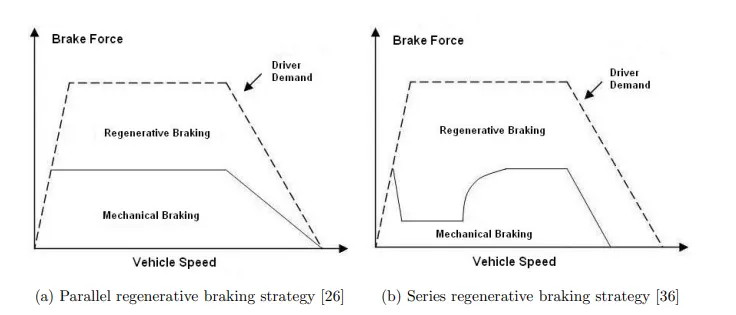
- There are two basic regenerative braking methods used today. These methods are often referred to as parallel regenerative braking and series regenerative braking. Each of these braking strategies have advantages and disadvantages that will be discussed in this section.
Parallel Regenerative Braking
- During parallel regenerative braking, both the electric motor and mechanical braking system always work in parallel (together) to slow the vehicle down.
- Since mechanical braking cannot be controlled independently of the brake pedal force it is converting some of the vehicle’s kinetic energy into heat instead of electrical energy. This is not the most efficient regenerative braking method. However, parallel regenerative braking does have the advantages of being simple and cost effective.
Series Regenerative Braking
- During series regenerative braking the electric motor is solely used for braking. It is only when the motor or energy storage system can no longer accept more energy that the
mechanical brakes are used. - This method requires that the mechanical braking torque be controlled independently of the brake pedal force and has the advantage of being the most efficient by converting as much of the vehicle’s kinetic energy into electrical energy (Figure 2.5b). The downfall of this method is that it brings many costs and complexities into the system.
Question 3
Various losses in the electric motor are considered such as (i) copper loss, (ii) iron loss, (iii) windage loss, (iv) constant motor loss
Copper loss
- Copper loss given by: `I^2*R` where R is the armature resistance and we say that Torque is proportional to current, this copper loss can be considered as `kc*T^2` where `kc` is to take care of resistance of brushes and lso take care of flux and its effect.
- Hence copper losses=`kc*T^2`
Iron losses
- Iron losses are magnetic losses denoted by `k_i*w` where `k_i` factor is based on the magnetic field effect.
- Hence iron losses=`k_i*w`
Windage losses
- This is a mechanical or friction of windage losses. This is based on size and shape of the motor and the windage losses that the motor is going to experience.
- Hence windage losses=`k_w*w^3`
Constant losses
- This is denoted by C.
Total losses
- The total losses are given by= `k_c*T^2+k_i*w+k_w*w^3+C`
clear all
close all
clc

%Torque and velocity values
Torque=linspace(0,250);
Speed=linspace(0,1000);

%losses
kc=0.2;
ki=0.008;
kw=0.00001;
C=20;

%Meshing
[S,T]=meshgrid(Speed,Torque)

%Calculating Power=speed*torque
Output_power=(S.*T);

%Calculate losses
Cu=(T.^2)*kc %copper losses
Fe=S*ki; %iron losses
W=(S.^3)*kw; %windage losses

Input_power=Output_power+Cu+Fe+W+C;
Efficiency= Output_power./Input_power;

%Plotting the efficiency contour
V=[0.7,0.8,0.85,0.90,0.91,0.92,0.925,0.93];
box off
grid off
contour(S,T,Efficiency,V)
xlabel('Speed(rad/s)')
ylabel('Torque(Nm)')
title('Motor Speed-Torque Efficiency Contour Plot')
hold on

%Now plot a contour of Power Output
V=[8000,10000];
contour(S,T,Output_power,V)
The code file can be accessed at:https://drive.google.com/drive/folders/1W2D1bnWy5b8q6ZV8nIrLXtAoMPWM5B55?usp=sharing
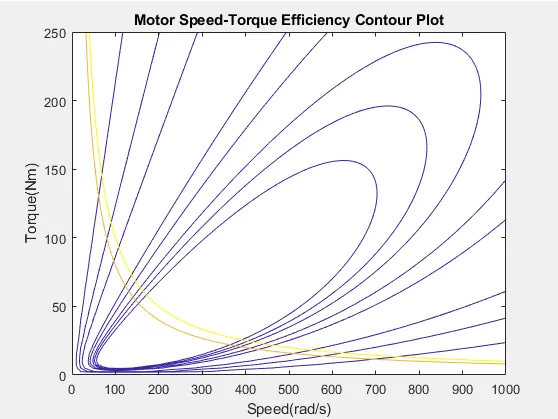
The above plot shows the motor speed-torque effieicency contour plot. The blue lines give the efficiency values. A point is denoted on the innermost contour line gives the highest efficiency value and a point on the outermost contour line gives the lowest efficiency values. The yellow lines give the 8kW and 10kW power.