Week-11 Challenge: Braking
- For a defined driving cycle, calculate the energy required for braking.
Ans.
Braking:-
- Brake is use to reduce the moving vehicle to rest position or bring to rest in shortest possible distance whenever required.
- Brake is mechanical devices for increasing friction resistance that retards turning motion of the vehicle wheels which can absorb kinetic energy or potential energy and to convert in heat energy.
- When our vehicle going to down direction or negative gradient hill at that time to control velocity of vehicle we use brake.
- In automobile is fitted with two types of brake, first is foot brake and second is hand brake. The foot brake is use to control the vehicle speed where we desire. For hand brake is applied by lever which is use when our vehicle is in parking, this brake is know as emergency brake also when foot brake is fail at that time we can use hand brake.
- Here kinetic energy is force to keep moving vehicle or we can say that accelerate vehicle standstill to desire speed.
- The kinetic energy of vehicle during braking is given by
Kinetic energy (KE) = ½ m(vi2 - vf2)
Where m = mass of vehicle,
Vi = initial velocity
Vf = final velocity
As per kinetic energy equation we can say that if double in energy the mass is also double but in case of velocity is four times change as energy is double.
Here for calculation of brake energy we take reference of UDDS cycle for braking calculation here below show the data chart in excel.
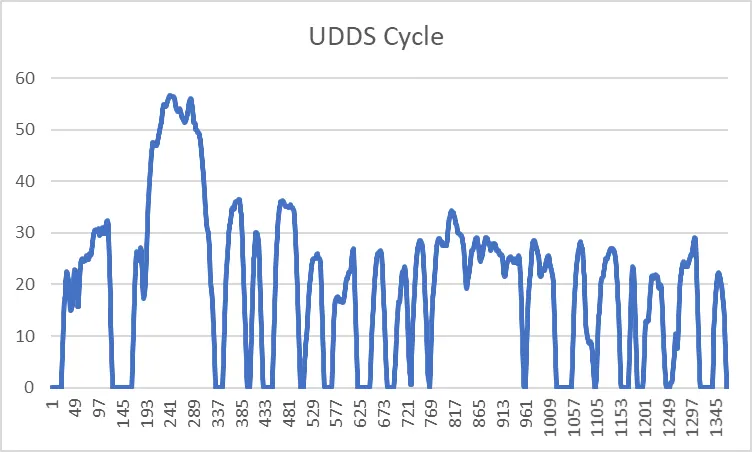
Now we use this data to calculation of braking energy for that this excel sheet is import in matlab after that we use sheet variable in scripting.
Here below the matlab code is provide for braking energy.
mass = 1000;

t = velocity1(:,1);

v = velocity1(:,2);

brake_energy = zeros(1,1370);

for i = 1:1369

    if(v(i+1)>v(i))

        brake_energy(i) = 1/2*mass*((v(i)-v(i+1))^2);

    end

end

fprintf('total braking energy is %d', sum(brake_energy))

fprintf("avarage of braking energy is %d", mean(brake_energy))

figure(1)

subplot(2,1,1)

plot(t,v);

ylabel('velocity(m/s)');

xlabel('time');

title('drivecycle');

subplot(2,1,2)

plot(brake_energy);

ylabel('braking energy');

xlabel('time(s)');

hold on;
for this scripting one excel file is required which graph is avobe shows and below file is attached.
Result:
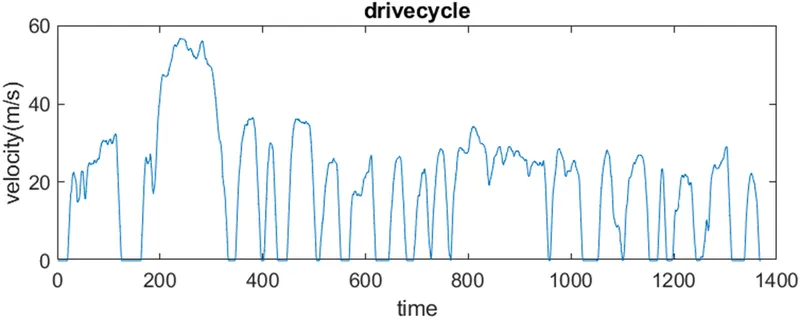
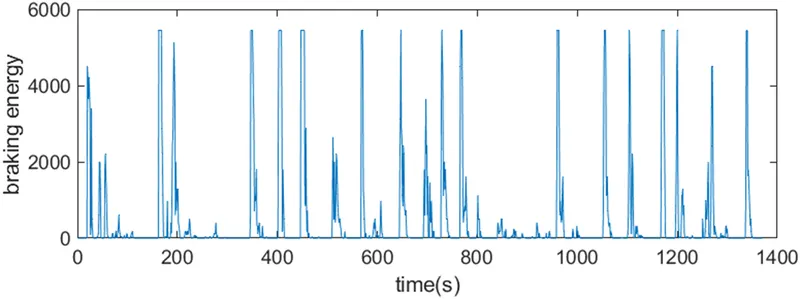

- Why electric motor can’t develop braking torque at high speed similar to starting? How electric and mechanical brakes are coordinated?
Ans.
Electric motor can’s develop braking torque at high speed as similar to starting torque because of electric supply is cut off or pull out from motor so it’s act as generator as motor act generator due to the flux weakening of generator and generator is produce low torque as we know about it.
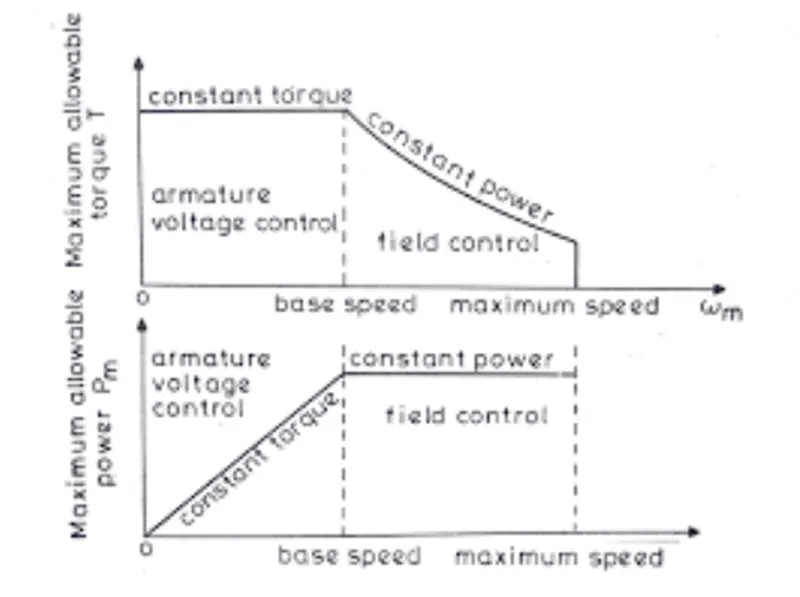
In above graph we can show that in acceleration condition torque is constant till rated speed after the above rated speed torque is decreasing with constant power.
In case of deceleration condition it’s totally mirror of acceleration and speed is positive and torque is negative so at deceleration torque is not equal to acceleration torque.
Electric and mechanical brakes:
In the electric vehicle brake distribution in two ways first is electric brake which is known as regenerative brake and mechanical brake as hydraulic brake.
In the two brake it works like if regenerative braking power requirement is more than charging limit than machine must applied mechanical brake or combine brake as per more power is comes in regenerative braking. In short it’s work based brake control strategies.
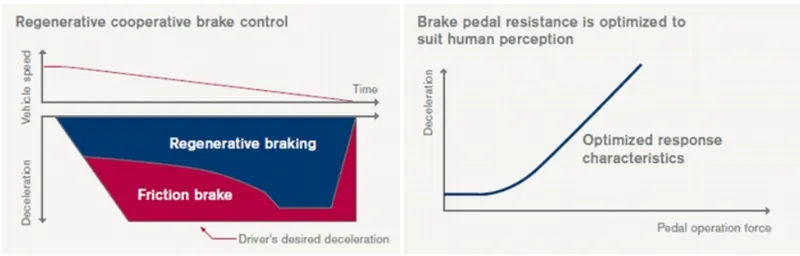
In above image we see that stepping on brake pedal the system produces natural and adequate braking force that corresponds to the operation.
We can see that as speed is decrease regenerative brake is more compare to mechanical brake.
Further in braking system two type:-
- Series brake
- Parallel brake
1)series brake:-
In this type only any of one brake is work at time.
2)parallel brake:-
In this type at time both brake is work for braking system.
- Make a MATLAB program which plots contour of given motor speed, torque and efficiency values. Attach the code as a .m file attach a screenshot of all the plots.
Ans.
To matlab program to plot contour for given motor speed , torque, efficiency.
For motor efficiency,
Total loss = kc*T2+ ki*W + kw*W3 + k;
Where Kc = copper loss;
Ki = iron loss;
Kw = windage loss;
K = constant loss;
Now we go for matlab scripting here below write.
clear all

close all

clc

w = linspace(0,17000);

t = linspace(0,25000);

kc = 0.18;

ki = 0.006;

kw = 0.000015;

[x,y] = meshgrid(w,t);

c_loss = (y.^2)*kc;

i_loss = x*ki;

w_loss = (x.^3)*kw;

k = 20;

o_power = x.*y;

i_power = (c_loss)+(i_loss)+(w_loss)+(o_power)+k;

efi = (o_power./i_power);

n = linspace(0.7,0.95,10);

contourf(x,y,efi,n);

title('speed torque characteristics')

xlabel('speed rad/s')

ylabel('torque n-m');

grid off;

contourf(x,y,efi,n);

xlabel('speed rad/s');

ylabel('torque n-m');
result:-
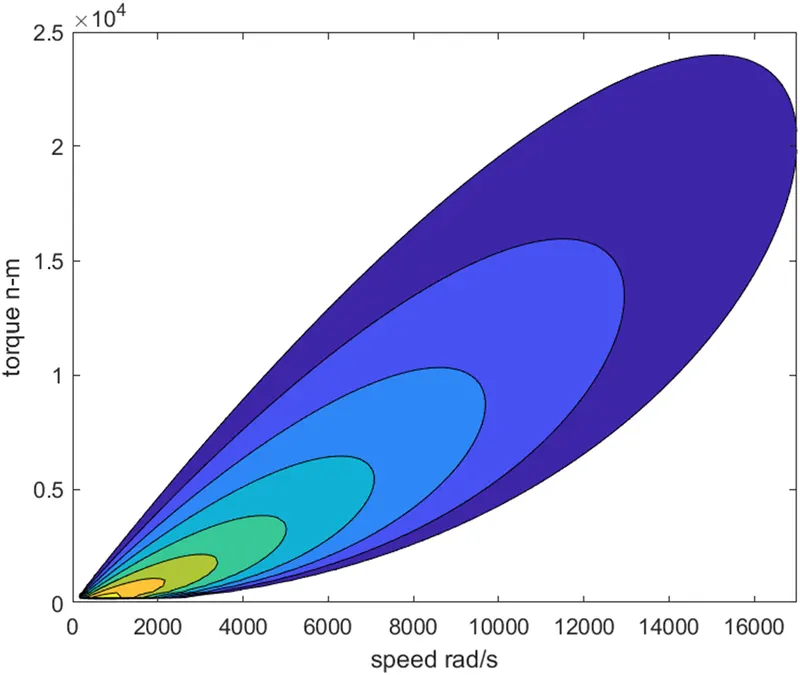
In above contour we can see that yellow color shows higher efficiency compare to outer.
For low torque and speed efficiency is high.
As a torque and speed value is increasing efficiency is decreasing from above counter.