Week-11 Challenge: Braking
Solution 1 : We are asked to calculate the energy required for braking, for a defined drive cycle .
Here we can calculate by taking 3 different drive cycle and calculate their braking energy seperately and finally calculate the braking power .
^2]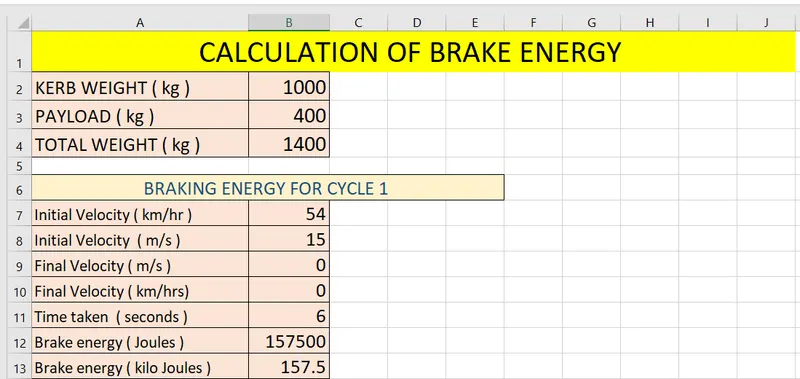
The drive cycle is represented with the help of an excel sheet specifications .
In our case, we have taken 3 seperate drive cycel testing .
1.Vehicle travelling with 54 km/hr and then brought to rest
2.Vehicle travelling with 90 km/hr and then brought to rest
3..Vehicle travelling with 144 km/hr and then brought to rest
Similarly for the other cases we get
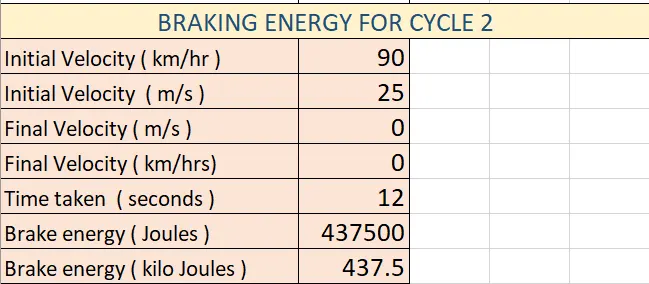
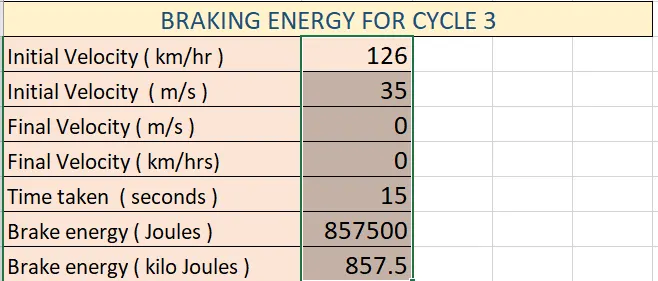
Braking energy can be calculated by the equation = 1/2 X (Mass of the Vehicle) X [(Final Velocity - Initial Velocity)^2] = 1/2 X m X [ ( V2 - V1 )
Braking power can be calculated by dividing this total energy by the total taken .
Calculating the sum of all these braking energies we get :
Total energy in kilojoules = 157.5 + 437.5 + 857.5 = 1452.5 kJ.
The excel file of the same calculation is attached with this .
SOLUTION 2 : Electric Motors cannot develop braking torque at high speed similar to starting.
Whe nthe motor is running at high speeds then it will be running in the region of constant power. In the constant power region , torque will be inversely proprtional to the speed. So electric motors cant develop braking torque at high speeds.
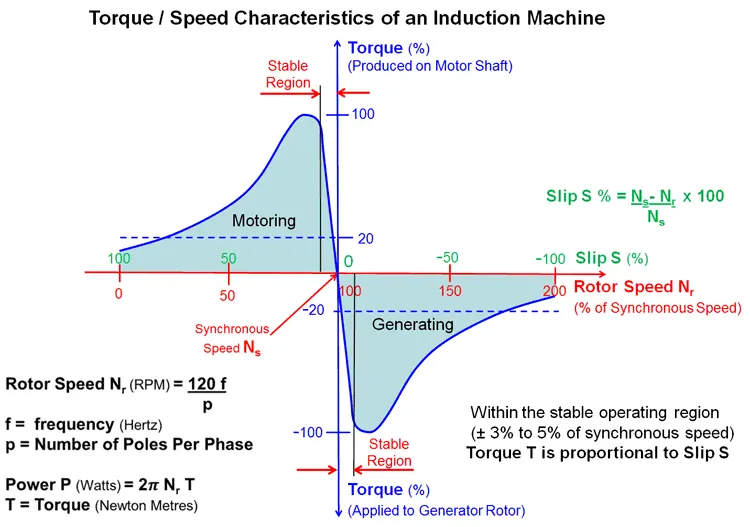
. The image shown below is the Torque speed plot of an induction motor
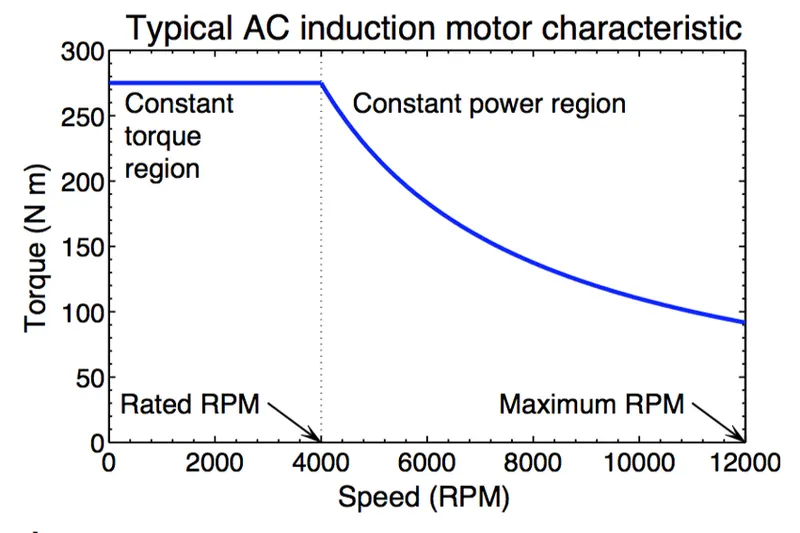
When we accelerate a vehicle , Vehicle starts from a velocity 0 , the torque is slowly increased upto a peak point, beyond which torque of the vehicle cannot be increased. So it is seen that when speed again increases in constant power region torque will decrease. So there is no braking torque developed .
Coordination of electrical and Mechanical braking in EV :
Electric braking can be done by various methods such as :
1.Plugging
2. Dynamic Braking
3. Regenerative braking
Mechanical Braking is done mostly by using friction between two plates, so that the kinetic energy of the moving part of the vehicle is converted into heat energy by various means . There are various types of braking here which are namely : air braking , hydraulic braking etc . The friction between two surfaces is produced by pressurized air or liquid .
Nowadays both these types of braking are combined and we also vehicles with seperate brakings too .
Two main brake control strategies are used for the cordination of electrical and mechanical braking in the EV :
1. Series Control Strategy
2. Parallel Control Strategy
In the figure shown below the the control strategies are compared .
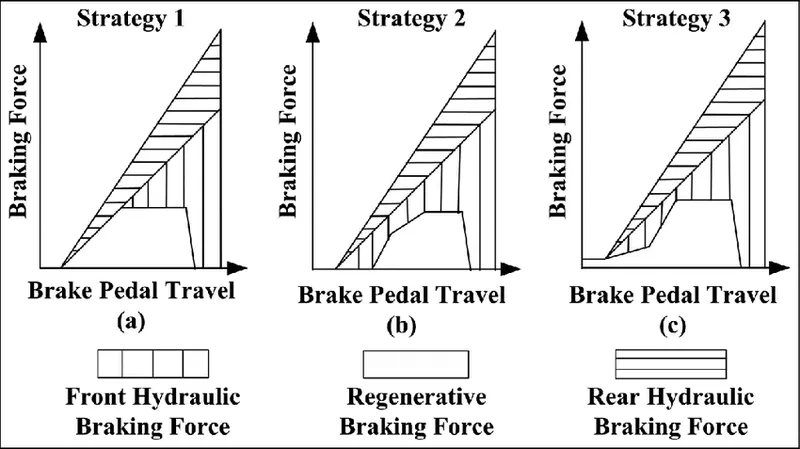
In series control strategy , all the three components : front wheel friction brake, rear wheel friction brake nad regenrative braking are applied simultaneously , when brake pads are applied .While in the case of parallel braking , all three are applied one after another when the brakes are applied .
ELECTRICAL DRIVEN INTELLIGENT BRAKING :
This is a type of parallel braking .During low speeds of the vehicle when brakes are applied, then Regenerative braking happens. While in high speeds of the vehicle both regenrative braking and other hydraulic braking is also combined . 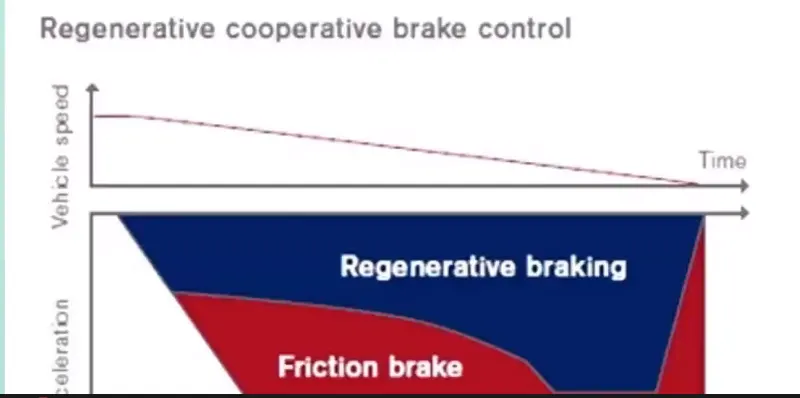
So this is the braking cordination done in the Electrical Vehicles .In the Electric Driven Intelligent Braking System, the braking is provided with the help of a ECU controlled motor.
SOLUTION 3 : A MATLAB program which plots contour of given motor speed, torque and efficiency values .
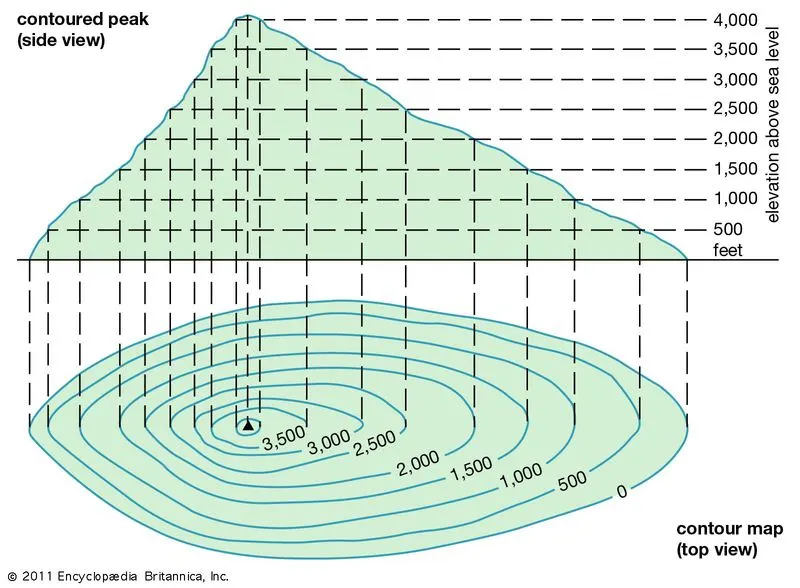
A contour line is a curve that joins points of equal value.
Power IN = Power Out + Copper Loss + Iron Loss + Windage Losses + Constant Losses
The code for the plotting the contour
clear all
close all
clc

speed= linspace(0,1000);
torque= linspace(0,500);

kc= 0.2;
ki=0.006;
kw=0.000010;
k=20;

[x,y] = meshgrid(speed,torque);
copper_loss= (y.^2)*kc;
iron_loss= x*ki;
windage_loss= (x.^3)*kw;

output_power= x.*y;
input_power= (copper_loss+iron_loss+windage_loss+output_power+k);
efficiency=(output_power./input_power);

n=linspace(0.7,0.95,10);
contourf(x,y,efficiency,n);
title('speed-torque efficiency')
xlabel('speed (rad/s)');
ylabel('torque (Nm)');
colorbar
Initially in the program , the speed and torque array is created. Then all the coefficients or the constants required for calculating the losses like, copper losses , windage losses, iron losses are assigned values. Using meshgridboth the Speed and Torque arrays are merged to calculate the Power .All the losses are calculated with the given details. Then Adding the losses and the output power obtained from meshgrid , we get the Input Power . Calculation of motor efficiency is done after finding the input power. Then from a range of values the rated efficiency is checked . The Grid and Box is removed . Finally the contour is plotted . Also the title , labels and the colourbar for the contour is also given .
RESULT OF THE CODE :
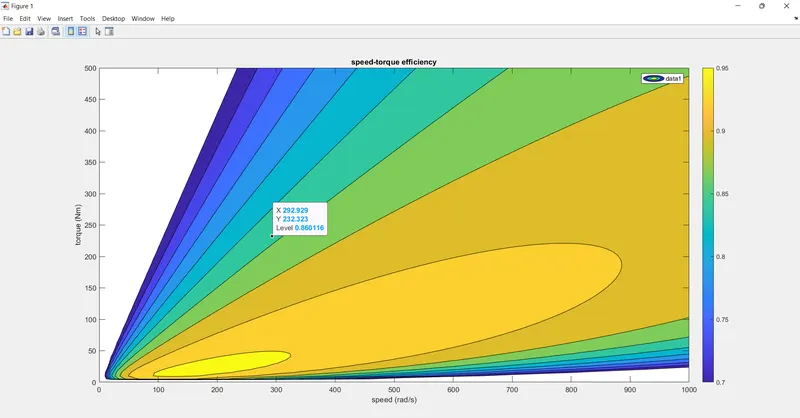
It is evident the contour is plotted successfully also it can be observed from the contour plot that the efficiency is decreased from the inner eclipse .