Week-11 Challenge: Braking
(1) AIM- Calculate The Energy Required For Braking.
OBJECTIVE- For A Defined Driving Cycle.
SOLUTION- Driving cycle is a set of data points representing the speed of the vehicle w.r.t time. So we calculate the breaking energy required for the braking.
We know that the braking energy is calculated by:-
`E_(br) = 1/2*m*v^2`
`therefore E_(br) = 1/2*m*(v_(j+1))^2 - (v_(j))^2`
`i.e` final velocity minus initial velocity``
Here we use the UDDS drive cycle. Its data is stored in the device in excel format. Now we use MATLAB code to find the braking energy. The code for it is as under:-
close all
clc
d = readmatrix('udds_drive_cycle.xls');             % for read indian urban driving cycle
t = d(1:time_period,1);                             % Time(s)
v = d(1:time_period,2);                             % Velocity(mph)
v = v*1.6*5/18;                                     % Velocity(mph to kmph)
for j = 1:(length(v)-1)
    if v(j)>v(j+1)
        k(j)=0.5*50*(v(j)^2-v(j+1)^2)/(3.6*10^6);
    end
end
fprintf('total_breaking_poweer is %f KWh',sum(k));
subplot(2,1,1)
plot(t,v,'linewidth',2)
xlabel('Time(s)')
ylabel('Velocity(mph)')
title('Duty Cycle')
subplot(2,1,2)
plot(t(1:1367),k,'linewidth',2)
xlabel('Times(s)')
ylabel('Energy(kWh)')
title('Breaking Energy')
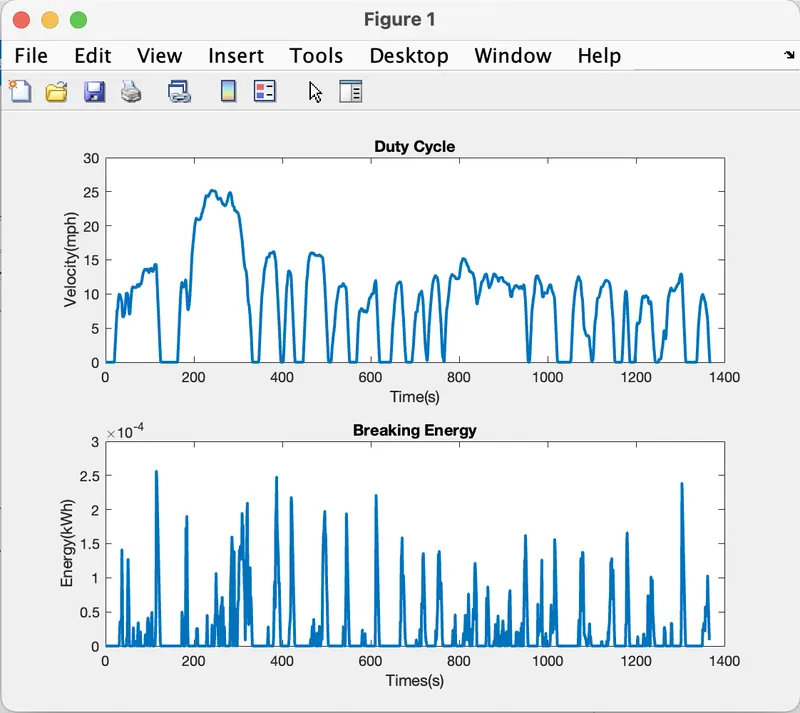
After running this code we get the results as shown below:-

So here the braking energy used is 0.028807 KWh.
And the plot of duty cycle and braking energy used is as shown below:-
(2) AIM- Why Electric Motor Can’t Develop Braking Torque At High Speed Similar To Starting. And How Electric And Mechanical Brakes Are Coordinated.
ANSWER- Regenerative braking is an important consideration in the vehicle nowadays.
It is all about how much electrical energy can be recovered from the battery and how quickly the battery can accept a charge. Well, there is a limitation of charging energy, after that battery temperature and voltage throw up their own limitation so it is unlikely to get the same energy is consumed.
At high speed, the motor is in a constant power region which causes less value of torque to be produced and occurs with less braking torque as compared to less speed.
Electrical and Mechanical brakes Co-ordination:-
As the regenerative brake may not be enough to stop the vehicle at a higher speed or regenerative brake is not feasible to use at the high temperature of the battery. In these cases, the mechanical braking system helps to fulfill the required braking torque.
Both brakes are combined in two different ways, which are as follows:-
- Series
- Parallel
Series Brake:-
- .
- Here first the regenerative brake will be applied, if the required torque is more than that then the remaining torque will be provided by the mechanical brake.
- Fuel efficiency will increase by 15-30%.
Parallel Brake:-
- Both brakes will work simultaneously.
- The regenerative torque is determined by considering the motor capacity, battery SOC, and velocity. Force is calculated from the brake control unit by comparing demanded brake torque and the motor torque available.
(3) AIM- MATLAB Program Which Plots Contour Of Given Motor Speed, Torque And Efficiency Values.
SOLUTION- The MATLAB code for the Contour of speed, velocity, and efficiency values is as under:-
close all
clc
v = linspace(0,1000);                %defining speed values
t = linspace(0,250);                 %defining torque values
k_i = 0.008;                         %iron losses constant
k_c = 0.2;                           %copper losses constant
k_w = 0.00001;                       %windage losses constant
c_l = 20;                            %constant losses
[V,T] = meshgrid(v,t);               %make mashgrid
l_i = k_i*v;                         %iron losses
l_c = k_c*(T.^2);                    %copper losses
l_w = k_w*(V.^3);                    %windage losses
t_l = l_i + l_c + l_w + c_l;         %total losses
p_out = T.*V;                        %ouput power
p_in = p_out + t_l;                  %input power
n_c = p_out./p_in;                   %efficiency calculation
n = linspace(0.70,0.95,10);          %efficiency values
contour(V,T,n_c,n);
xlabel('Torque(N/m)')
ylabel('Speed(rad/s)')
p = [8000,10000,15000];              %power
hold on
contour(V,T,p_out,p);- Here the value of velocity and torque is defined first, along with different losses constant.
- Different losses were calculated and then total losses is also calculated by adding all losses.
- We know the output power formula, so it is also calculated and from output power and total losses, we get the efficiency of the machine.
- After that efficiency values were defined for plotting the graph of it.
- The contour of velocity, torque, and efficiency is plotted.
- At last power values are defined and used for plotting it on the same contour.
The contour we get after running this code is shown as below:-
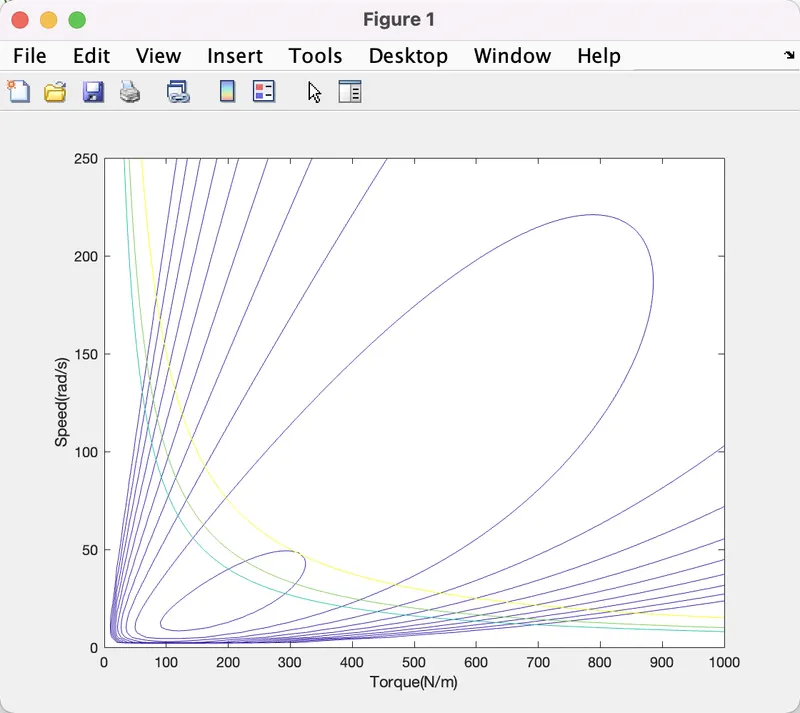
Conclusion- From the plot, we conclude that speed and torque vary as the efficiency increases. This is due to motor losses. Inner or smaller blue color loop has the highest efficiency.
"The greater the motor efficiency, the lower the speed-torque combination is required to overcome the motor losses."