Week-11 Challenge: Braking
1. For a defined driving cycle, calculate the energy required for braking.
To calculate the braking energy of a vehicle decelerating from v2 to v1 (km/h). Given are the Wheel inertia mass moment"I"
and the wheel diameter "d" as well as the vehicle mass "M".
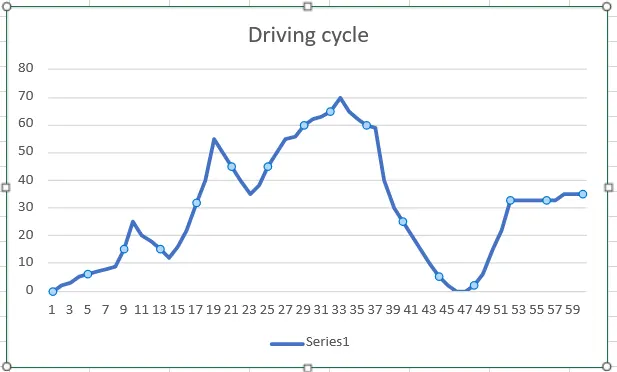
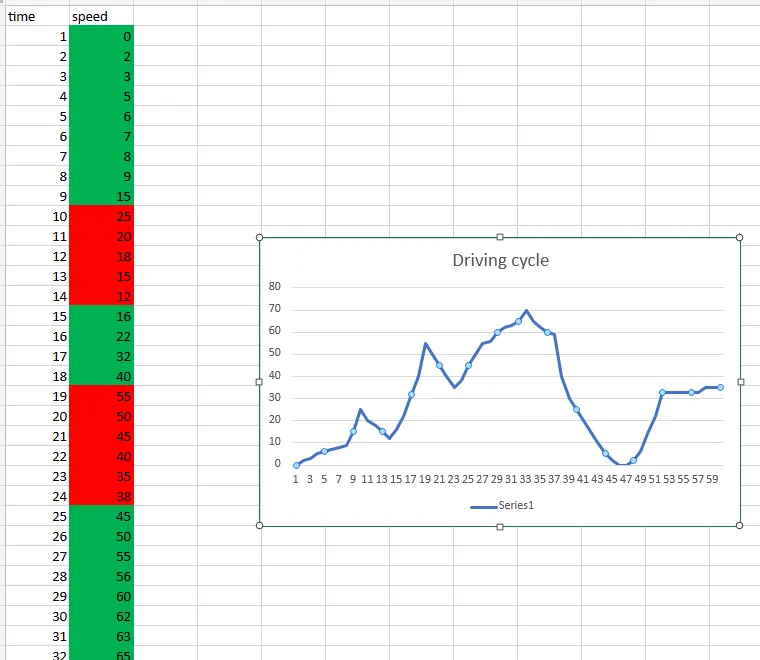
A driving cycle is a series of data points representing the speed of a vehicle versus time. Driving cycles are produced by
different countries and organizations to assess the performance of vehicles in various ways, as for instance fuel consumption,
electric vehicle autonomy and polluting emissions.
There are two kinetic types of energy that are involved in a moving car:
Linear and rotational kinetic energy,

The deceleration from V1 to V2 will reduce the energy. This energy is being saved in hybrid and electrical cars as regenerative energy.
The linear energy change is equal to:
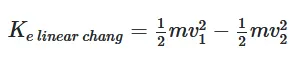
And rotational energy change is equal to:

Wheel inertia mass moment "I"
and

with r being the radius of the wheel, r = d/2.
However, because of small "I" of the wheels compared to the mass of the car, the contribution of the wheel's change of energy is not significant.
Drive Cycle:

Key points:
- kinetic energy (KE) is equal to half of an object's mass (1/2*m) multiplied by the velocity squared.
For example, if a an object with a mass of 10 kg (m = 10 kg) is moving at a velocity of 5 meters per second (v = 5 m/s), the kinetic energy is equal to 125 Joules.
- Power in general is defined as energy over time. Watts are defined as 1 Watt = 1 Joule per second (1W = 1 J/s) which means that 1 kW = 1000 J/s.
Energy(J) = Power(kW)*time(sec)
In practical case we take KWHr as one unit of energy.
Energy = J = Power(KW)*time(sec/3600)Hr
Energy = J = KWHr/3600
- Let us consider the mass of the vehicle (M) = 1000 Kg
Breaking energy = 0.5*M*(V)^2 (J)
Case 1:
From the above driving cylce the first brake is applied at 33rd second and velocity is changed from 25kmph to 12kmph.
The difference between speeds = 13Kmph.
Speed = 13 * (5/18) = 3.6 m/s
Break energy = 0.5*1000*3.6*3.6 = 6480 J
This is the break energy applied for 1sec. From the drive cycle we notice that break is applied from 10 to 14 seconds i.e 5 seconds.
Now Break energy for 5seconds is equal to 6480*5 = 34200 J
Converting J to KWHr (J = KWHr/3600)
34200 J = 34200/3600 = 9.5 KWHr
Case 2:
From the above driving cylce the first brake is applied at 19th second and velocity is changed from 25kmph to 12kmph.
The difference between speeds = 17Kmph.
Speed = 17 * (5/18) = 4.7 m/s
Break energy = 0.5*1000*4.7*4.7 = 11045 J
This is the break energy applied for 1sec. From the drive cycle we notice that break is applied from 19 to 24 seconds i.e 6 seconds.
Now Break energy for 5seconds is equal to 11045*6 = 66270 J
Converting J to KWHr (J = KWHr/3600)
66270 J = 66270/3600 = 18.40 KWHr
Case 3:
From the above driving cylce the first brake is applied at 10th second and velocity is changed from 70kmph to 0 kmph.
The difference between speeds = 70Kmph.
Speed = 70 * (5/18) = 19.44 m/s
Break energy = 0.5*1000*19.44*19.44 = 188956.8 J
This is the break energy applied for 1sec. From the drive cycle we notice that break is applied from 33 to 46 seconds i.e 12 seconds.
Now Break energy for 5seconds is equal to 188956.8*12 = 2267481.6 J
Converting J to KWHr (J = KWHr/3600)
2267481.6 J = 2267481/3600 = 629.8 KWHr
-------------------------------------------------------------------------------------------------------------------------------------------------------------------------------------------------------------------------
2.Why electric motor can’t develop braking torque at high speed similar to starting? How electric and mechanical brakes are coordinated?
Brake torque is essentially the power of the braking system. The brake caliper acts on the disc at a certain
distance from the hub center, known as the effective radius. The force exerted by the caliper, multiplied by
the effective radius of the system equals the brake torque.
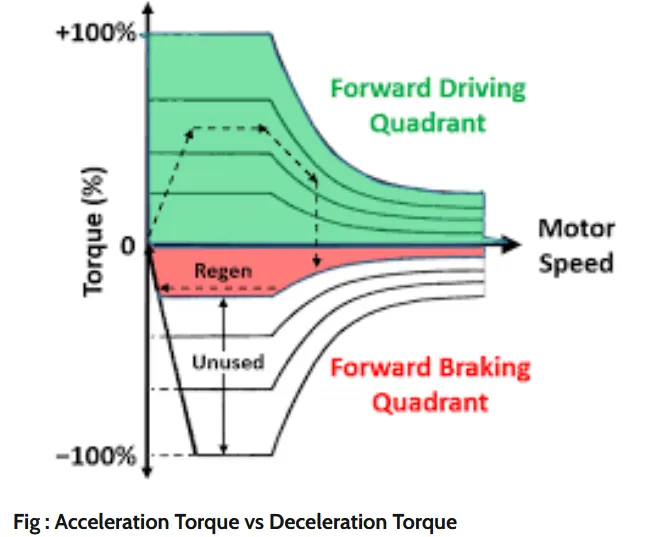
Below we have the graph of Speed Vs Torque
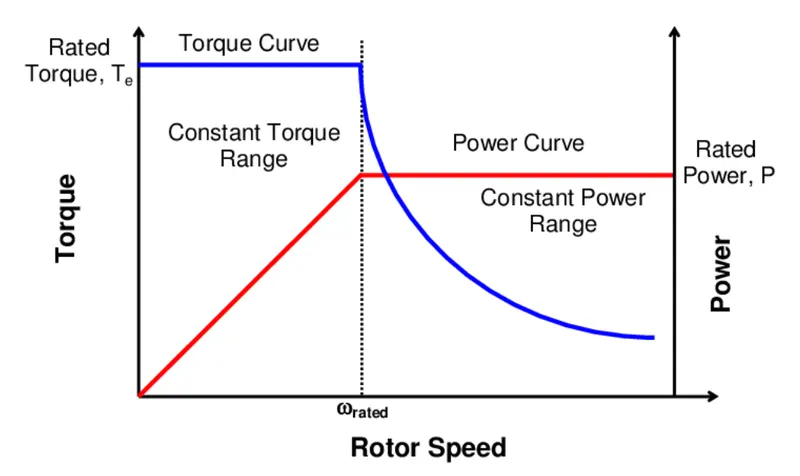
The graph shows that starting torque of the motor is high and it is a constant torque region upto rated speed.
After motor crosses rated speed the motor enters into constant power region here the torque of the motor decreases.
So when we apply brakes in the high speed region the motor is not able to generate high torque.
And the motor operates in field weakening region i.e 4th quadrant opearation. So the motor can’t develop braking torque at high speed similar to starting
electric and mechanical brakes coordination:
We have two types of braking
1. Electrical braking
2. Mechanical braking
Brake control strategies are of two types:
1. Series braking
2. Parallel braking
1.Series Braking:
Here we apply regenerative and mechanical brakes one after another.
2.Parallel Braking:
Here we apply regenerative and mechanical brakes simultaneously at same time.
Electric Driven Intelligent Brake(EDIB):
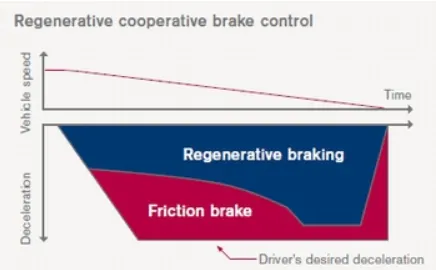
In the above Figure we observe
Regenerative braking and friction braking are applied combinely during high speed region
and in low speed region regenerative braking is applied. This is done because Battery may over charge during high speed regenerative braking.
Safe braking:
EVs and hybrid vehicles use regenerative braking, which utilizes the motor to convert the kinetic energy during
deceleration into electrical energy. With energy regeneration, an EV is able to run on less electricity and a hybrid vehicle on less fuel.
Technology Functionality
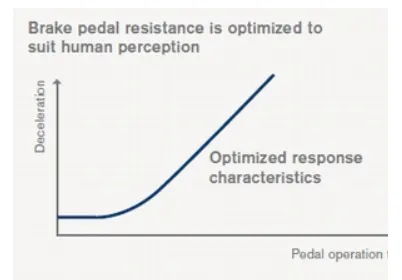
After stepping on the brake pedal, the system produces natural and adequate braking force that corresponds to the operation.
The amount of energy regeneration also needs to be increased as much as possible.
EDIB (Electric Driven Intelligent Brake) controls the regenerative brake and friction brake to support both of these requirements.
Further, it also controls the reactive force from the pedal in order to unify the feeling when stepping down on the pedal and the sense of deceleration.
Technology Configuration
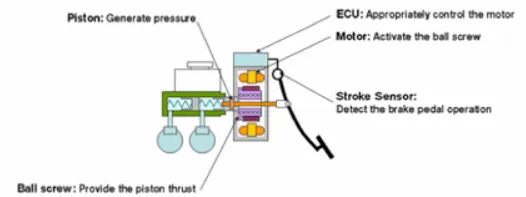
When the driver steps on the brake pedal, the stroke sensor detects operation of the brake. That information is communicated
to the ECU and controls the motor. The motor engages the piston and amplifies the friction brake's pressure (hydraulic pressure).
Through optimum control of the friction brake's hydraulic pressure, the energy regeneration outcome is maximized.
-----------------------------------------------------------------------------------------------------------------------------------------------------------------------------------------------------------------------
3. Make a MATLAB program which plots contour of given motor speed, torque and efficiency values. Attach the code as a .m file attach a screenshot of all the plots.
Program:
clear all
 clc
 velocity = linspace(1,1500); %speed of vehicle
 torque = linspace(1,300); %toque of motor
 %Motor constants
 kc = 0.1;
 ki = 0.001;
 kw = 0.0001;
 cm = 20;
 [X,Y] = meshgrid(velocity,torque); %obtaining 2-D grid for Speed and Torque
 poweroutput = X.*Y;
 total_loss = (ki.*X)+(kc.*(Y.^2))+((X.^3).*kw)+cm;
 inputpower = poweroutput + total_loss;
 Z = poweroutput./inputpower; %efficiency
 %defining efficiency levels for contouring
 EL = [0.70,0.72,0.76,0.79,0.8,0.82,0.83,0.85,0.87,0.89,0.90,0.92,0.93,0.95];
 %plotting the efiiciency curve
 contourf(X,Y,Z,EL)
 colourbar
 xlabel('speed(rpm)');
 ylabel('Torque(N.m)');
 title('efficiency curve');
Code explanation:
- Velocity and torque values are specified
- Motor constant values are specified
- Using 'meshgrid' command velocity and torque values obtained in 2-D dimention.
- Efficiency is calculated by using efficiency formula and given a variable name as 'Z'.
- Efficiency levels are defined in "EL" variable.
- Finally contour diagram of speed, torque and efficiency are plotted using 'contourf' command
- colour is applied to contour diagram using 'colourbar' command.
- X-axis and Y-axis are labelled as speed and torque respectively.
Result:
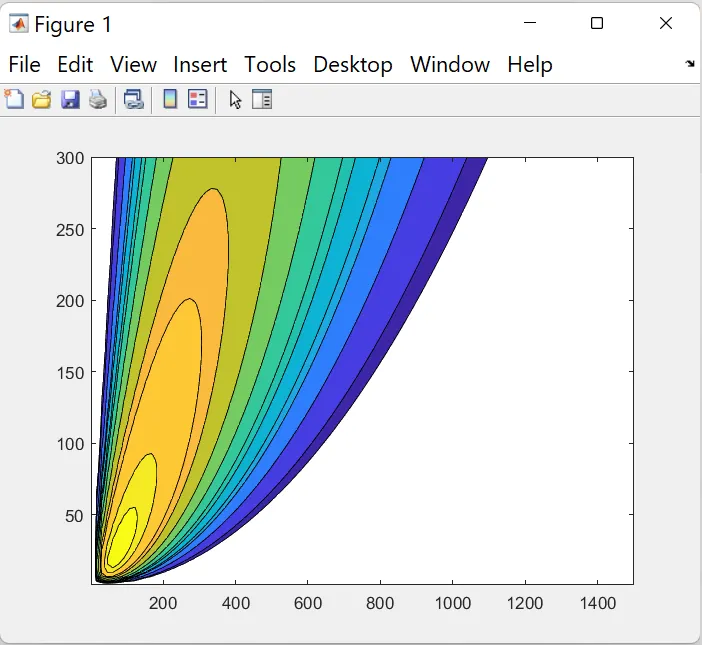
Observation
- On x-axis speed values in RPM and on y-axis Torque values are given mentioned.
- Above graph is the contour diagram of speed, torque and efficiency.
- We see different colours on the graph they are representing the same efficiency region.
Hence contour of given motor speed, torque and efficiency values is plotted.