Week-11 Challenge: Braking
1) Aim: To calculate the energy output of breaking for a defined drive cycle.
Drive Cycle:
- A driving cycle is a series of data points representing the speed of a vehcile versus time.
- Driving cycles are produced by different countries and organizations to assess the performance of vehicles in various ways, as for instance fuel consumption, electric vehicle autonomy and polluting emissions.
- Fuel consumption and emission tests are performed on chasis dynamometers. Tailpipe emissions are collected and measured to indicate the performance of the vehicle.
- Another use for driving cycles is in vehicle simulations. More specifically, they are used in propulsion system simulations to predict performance of internal combustion engines, transmissions, electric drive systems, batteries, fuel cell systems, and similar components.
- Some driving cycles are derived theoritically, as it is preferred in the European Union, whereas others are direct measurements of a driving pattern deemed representative.
There are two types of driving cycles:
- Transient driving cycles involve many changes, representing the constant speed changes typical of on-road driving.
- Modal driving cycles involve protracted periods at constant speeds.
Breaking:
- A brake is a mechanical device designed to restrain motion by absorbing energy from a moving system usually by the means of friction. It is used to slow or stop a moving vehicle, wheels, axle, etc.
- The braking system is a complication device with a lot of parts, but its working seems very easy. After all, pressing a single pedal will activate all brakes on the four wheels.
- The slowing down is achieved by hydraulic fluid, which is often bleed to get the best performance of the breaking. Air is not allowed in the system else the component won’t work well.
- Most brakes are designed to use friction between two surfaces, they’re pressed to convert the kinetic energy of the moving object into heat.
- Though several methods of energy conversion are now employed. In an automobile, friction brakes store braking heat in the drum brake or disc brake which then gradually converts into the air.
- A brake system helps to stop vehicles within the smallest possible distance. This is achieved by converting the kinetic energy of the vehicle into heat energy.
- It also functions on a mechanical device where motion occurs, the brake is applied to stop it within a short period of time.
Types of brakes:
- Hydraulic brake
- Power-Assisted brake
- Disc brake
- Drum brake
- Hand brake
- Most modern cars have brakes on all four wheels, operated by a hydraulic system . The brakes may be disc type or drum type.
- The front brakes play a greater part in stopping the car than the rear ones, because braking throws the car weight forward on to the front wheels.
- Many cars therefore have disc brake , which are generally more efficient, at the front and drum brakes at the rear.
- All-disc braking systems are used on some expensive or high-performance cars, and all-drum systems on some older or smaller cars.
Calculation of Energy required for breaking:
- First we need create the drive cycel and then according to the drive cycle calculate the breaking energy.
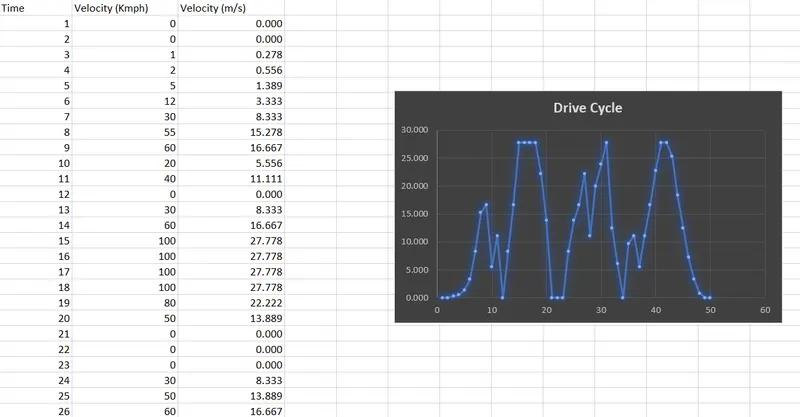
- After creating the drive cycle we need to upload this to the MATLAB workspace and write the code for the Breaking Energy calculations.
- The output is viewwd in the command window as total breaking energy and also the graph is plotted for total drive cycle.
m = 1000;
t = table2array(velocitytime(:,1));
v = table2array(velocitytime(:,3));

for i=1:(length(v)-1)
    if v(i)>v(i+1)
       E(i)=0.5*m*((v(i)-v(i+1))^2)/(3.6*10^6);
    end
end
fprintf('Total Brake Energy is %d (kWh)',sum(E))

%ploting the results
subplot(2,1,1)
plot(t,v,'color','b')
xlabel('time(sec)')
ylabel('velocity(m/s)')
title('Drive cycle')

subplot(2,1,2)
plot(E,'color','r')
xlabel('time(sec)')
ylabel('Breaking Energy(kWh)')
grid on 
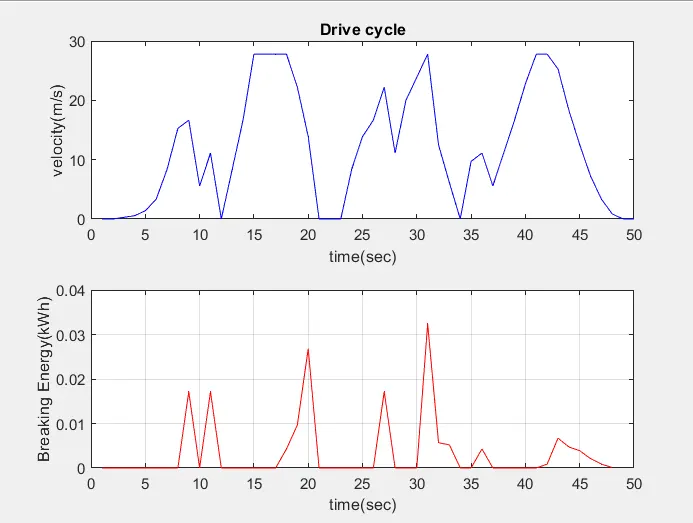
- Hence the total braking energy is 0.1589kWh
- From the graph we can see that during the velocity is decreasing their is a rise in the Braking energy.
Conclusion: Hence calculated the energy required for breaking during a paticular drive cycle.
2) Aim: To understand why motor can't develop breaking torque at high speeds similar to starting and also about the electric and mechanical brakes coordination.
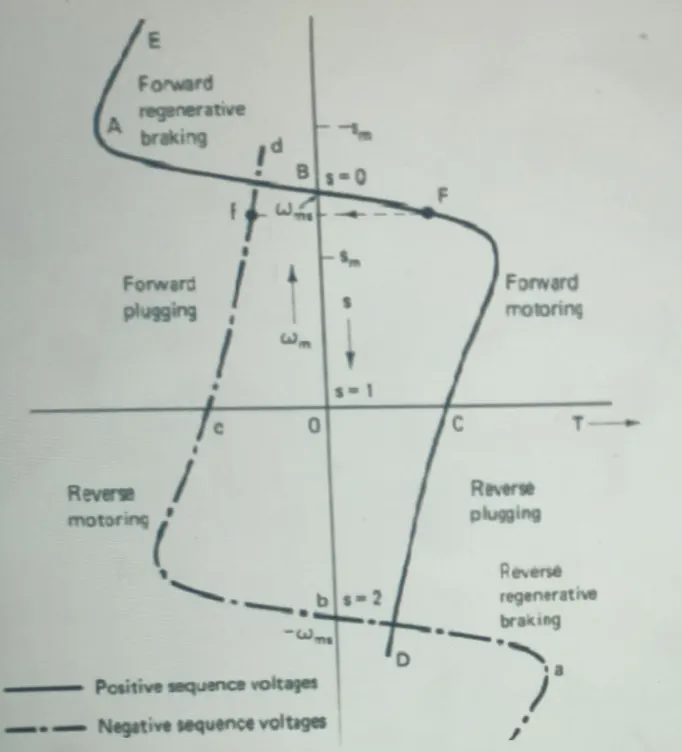
- The torque speed characteristics obtained by reversal of phase sequence of motor terminal voltages.
- Positive voltage across the terminals , the operation of regenerative braking happens at speed above synchronous speed(BAE in figure).
- Negative sequence voltage across terminals, the operation of regenerative braking at speed above synchronous but in reverse direction.
- In regenerative braking the motor works as a induction generator, converting mechanical energy to electrical energy to the source, which canbe reused.
- When we apply brake pedal, the supply will get cut off from the motor, but motor will be in rotation due to inertia.
- The inertia will happen in the presence of magnetic field which will generate a back emf thus resulting in the negative Torque which will be used for braking to reduce the speed of the vehicle.
- Since current flow in reverse direction, we need a bi-directional inverter so that we can store the energy back into battery.
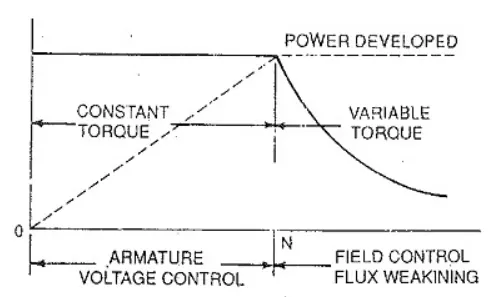
- At starting of the motor, the speed is less and the motor initial torque is High which is constant Torque region.
- As speed reaches beyond critical speed the torque will gradually gets decreased which is known as constant Power region.
- During high speeds the motor cannot generate required braking torque developed will be less.
- There are other reasons like battery limitations, rate of discharge is greater than rate of charge which also effect the braking torque to reduce at high speeds.
Electrcial and mechanical brakes coordination:
- Regenerative braking in EVs and HEVs adds some complexity to the braking system design. Two basic questions arise: one is how to distribute the total braking forces required between the regenerative brake and the mechanical friction brake so as to recover the kinetic energy of the vehicle as much as possible.
- The other is how to distribute the total braking forces on the front and rear axles so as to achieve a steady-state braking.
- Usually, regenerative braking is effective only for the driven axle. The traction motor must be controlled to produce the proper amount of braking force for recovering the kinetic energy as much as possible.
- At the same time, the mechanical brake must be controlled to meet the braking force command from the driver.
- Basically, there are three different brake control strategies: series braking with optimal braking
feel; series braking with optimal energy recovery; and parallel braking.
Series braking with optimal braking feel:
- The series braking system with optimal feel consists of a braking controller that controls the braking forces on the front and rear wheels. The control objective is to minimize the stopping distance and optimize the driver’s feel.
- The shortest braking distance and good braking feel require the braking forces on the front and rear wheels to follow the ideal braking force distribution curve.
- The braking force on the front wheels (driven axle) is divided into two parts: regenerative braking force and mechanically frictional braking force.
- When the braking force demanded is less than the maximum braking force that the electric motor can produce, only electrically regenerative braking will apply.
- When the commanded braking force is greater than the available regenerative braking force, the electric motor will operate to produce its maximum braking torque, and the remaining braking force is met by the mechanical brake system.
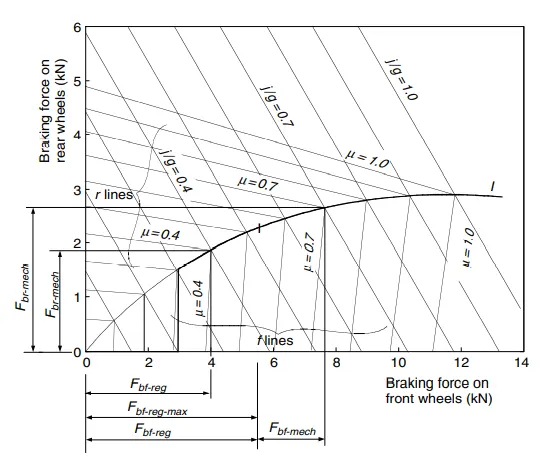
- The maximum regenerative braking force produced by an electric motor is closely related to the electric motor’s speed. At low speed (lower than its base speed), the maximum torque is constant.
- However, at high speed, the maximum torquedecreases hyperbolically with its speed. Therefore, the mechanical brake torque at a given vehicle deceleration varies with vehicle speed.
Series braking with optimal energy recovery:
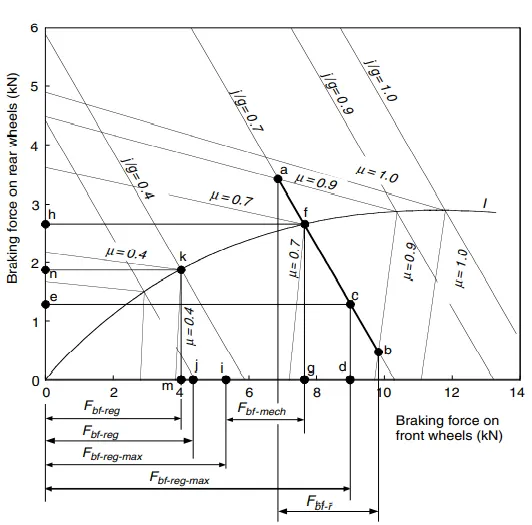
- The principle of the series braking system with optimal energy recovery is to recover the braking energy as much as possible in the condition of meeting the total braking force demanded for the given deceleration.
- In this case, regenerative braking should be used in priority. If the available regenerative braking force (maximum braking force produced by the electric motor) is in this range, the braking force on the front wheels should be developed only by regenerative braking without mechanical braking.
- The braking force on the rear wheels, represented by point e, should be developed in order to meet the
total braking force requirement. - If on the same road, the available regenerative braking force is less than the value the electric motor should be controlled to produce its maximum regenerative braking force.
- The front and rear braking forces should be controlled at point f so as to optimize the driver feel and reduce braking distance. In this case, additional braking force on the front wheels must be developed by mechanical braking by the amount represented by Fbf-mech, and the braking force on the rear axle.
- The series brake with both optimal feel and energy recovery needed active control of both electric regenerative braking and mechanical braking forces on the front and rear wheels. At present, such a
braking system is under research and development.
Parallel Braking:
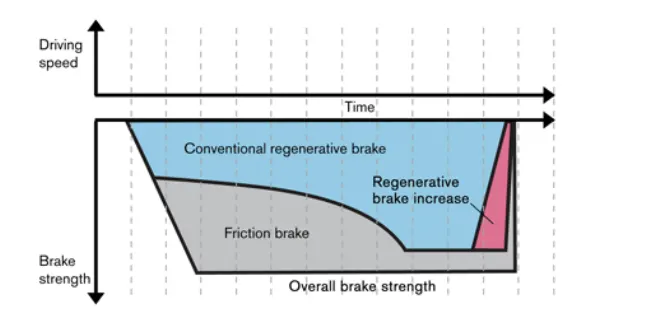
- The parallel brake system includes both an electrical (regenerative) brake and a mechanical brake, which produce braking forces is parallel and simultaneously.
- The parallel brake system has a conventional mechanical brake which has a fixed ratio of braking force distribution on the front and rear wheels.
- Regenerative braking adds additional braking force to the front wheels, resulting in the total braking force distribution curve.
- The mechanical braking forces on the front and rear axles are proportional to the hydraulic pressure in the master cylinder.
- The regenerative braking force developed by the electric motor is a function of the hydraulic pressure of the master cylinder, and therefore a function of vehicle deceleration.
- Because the regenerative braking force available is a function of motor speed and because almost no kinetic energy can be recovered at low motor speed, the regenerative braking force at high vehicle deceleration designed to be zero so as to maintain braking balance.
- When the demanded deceleration is less than this deceleration, regenerative braking is effective.
- The parallel braking system does not need an electronically controlled mechanical brake system. A pressure sensor senses the hydraulic pressure in the master cylinder, which represents the deceleration demand.
- The pressure signal is regulated and sent to the electric motor controller to control the electric motor to produce the demanded braking torque.
- Compared with the series braking of both optimal feel and energy recovery, the parallel braking system has a much simpler construction and control system. However, the driver’s feeling, and amount of energy recovered are compromised.
Conclusion: Hence understood the Torque of the motor at higher speed will be low and also the electrical-mechanical brakes co-ordination.
3) Aim: To make a MATLAB program which plots contour of given speed, torque and efficiency values.
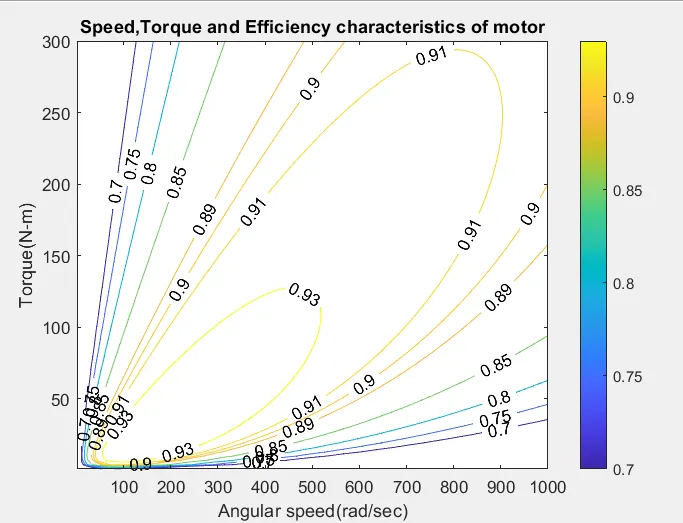
- A contour plot is a graphical technique for representing a 3-dimensional surface by plotting constant z slices, called contours, on a 2-dimensional format. That is, given a value for z, lines are drawn for connecting the (x,y) coordinates where that z value occurs.
- In this model we make MATLAB program to plot contour of speed, torque and efficiency of motor where efficiency will on the z-axis.
- The speed and Torque are defined by linspace command to generate the linearly spaced vectors.
- Meshgrid is used to create a 2D grid co-ordinates by using the linearly spaced vectors.
- For motor efficiency we need consider various losses in the motor.
- TRhe major losses are of four types:
1) Copper losses: Copper loss is the term often given to heat produced by electrical currents in the conductors of transformer windings, or other electrical devices. Copper losses are an undesirable transfer of energy, as are core losses, which result from induced currents in adjacent components.
Copper loss = kc*T^2 , T = Torque , kc = copper loss constant
2) Iron losses: The losses in the stator and rotor iron cores are due to the space fundamental and harmonic fluxes. These losses consist of hysteresis loss, eddy current loss, and excess loss. Hysteresis and eddy current losses are proportional to frequency and square of frequency, respectively.
Iron loss = ki*w , w = speed of motor, ki = iron loss constant
3) Windage losses: Windage loss in rotatory machines occur due to air resistance to the armature. Therefore, in order to even start a motor, the machine needs to overcome friction and windage torque and inertia due to its weight to start rotating. Windage is the churning effect of the rotating armature in the confined space inside the field coils. Even a smooth airflow would take some power to achieve, the very turbulent conditions inside the motor take much more power.
Windage loss = kw*w^3, kw = windage loss constant
4) Consant loss = C
Total losses = Copper loss + Iron loss + Windage loss + Constant loss
Tl = Cul + Irl + Wil + C
Output of motor = w*T
Input of motor = Output of motor + Tl
Efficiency = Output/Input.
MATLAB model:
clear all
close all
clc

%Torque and Speed values
speed = linspace(1,1000);
torque = linspace(1,300);

%loss coefficients
kc = 0.18; %copper loss coefficient
ki = 0.007; %iron loss coeeficient
kw = 0.000015; % windage loss coefficient

%2-D array for speed and torque
[w,T] = meshgrid(speed,torque);

%calculating losses
Cu_loss = kc*(T.^2);
Ir_loss = ki*(w);
Wi_loss = kw*(w.^3);
Constant_loss = 20;

%Power calculations
Output_power = (w.*T);
Input_power = Output_power + Cu_loss + Ir_loss + Wi_loss + Constant_loss;

%Efficiency
n = ((Output_power)./(Input_power));

V = [0.70,0.75,0.80,0.85,0.89,0.90,0.91,0.93,0.98,];

%plot of contour for speed, torque and efficiency
contour(w,T,n,V);
colorbar
xlabel('Angular speed(rad/sec)')
ylabel('Torque(N-m)')
zlabel('Efficiency')
title('Speed,Torque and Efficiency characteristics of motor')
Output plot:
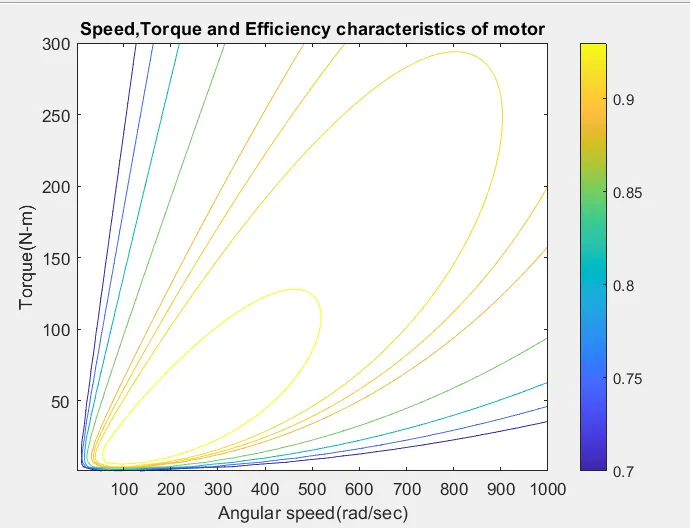
- The value of the efficiency on the curve can be displyed by the adding below part in the MATLAB model.

Conclusion: Hence a MATLAB program to plot the contour of given speed, torque and efficiency values.