Week-4 Challenge WOT Condition Part-2
1) Aim: To Differentiate between mapped and dyanmic model of engine, motor and generator and also mention the stpes to change the model type.
PowerTrain Block sets: To model and Simulate Automotive Powertrain systems.
- Powertrain Blockset™ provides fully assembled reference application models of automotive powertrains, including gasoline, diesel, hybrid, and electric systems.
- It includes a component library for simulating engine subsystems, transmission assemblies, traction motors, battery packs, and controller models. Powertrain Blockset also includes a dynamometer model for virtual testing.
- Powertrain Blockset provides a standard model architecture that can be reused throughout the development process. You can use it for design tradeoff analysis and component sizing, control parameter optimization, and hardware-in-the-loop testing.
- You can customize models by parameterizing components in a reference application with your own data or by replacing a subsystem with your own model.
- Fully assembled models of gasoline,diesel, hybrid and electric powertrains.
- Basic controllers for powertrain subsystems.
- Standard drive cycle data (FTP75, WOT).
- Engine dynamometer model for virtual calibration and testing.
- MDF file support provides a standards-based interface to calibration tools for data import.
- The blocks in Powertrain Blockset provide the detail necessary to capture important physical effects (turbocharger windup, manifold filling and empty dynamics, driveline dynamics, etc.), while achieving high simulation performance and fast real-time execution.
- Powertrain Blockset provides blocks for various automotive subsystems. However, you may want to customize one of the subsystems to capture specific dynamics of interest.
Powertrain block uses MATLAB and SIMULINK for Simulation.
Powertrain Blockset - MATLAB & Simulink (mathworks.com)
Mapped and Dynamic Model of Engine, Motor & Generator:
Powertrain block provides two types of combustion engine models.
- Mapped model
- Dynamic model
| Mapped Model | Dynamic Model |
|
|
|
|
|
|
|
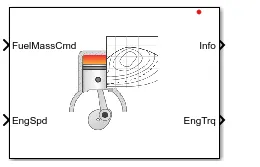
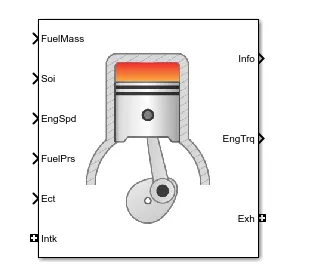
This principle remains same for motor/generartor also.
Motor/Generator models:
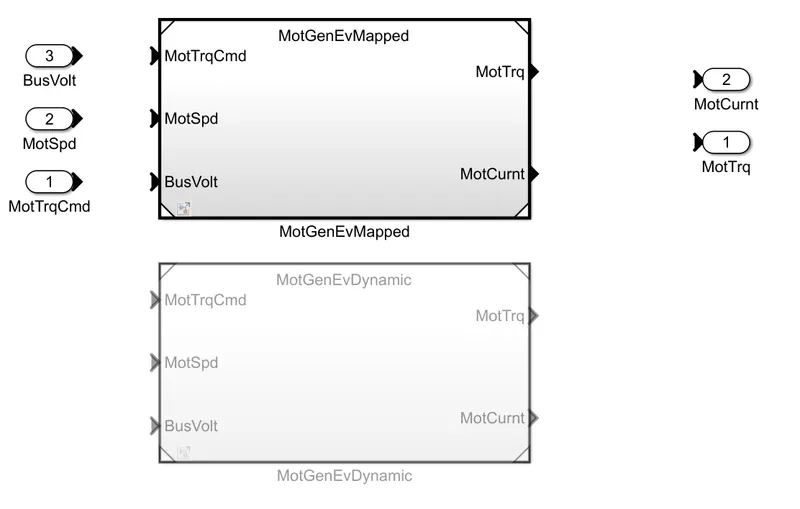
Mapped Model:
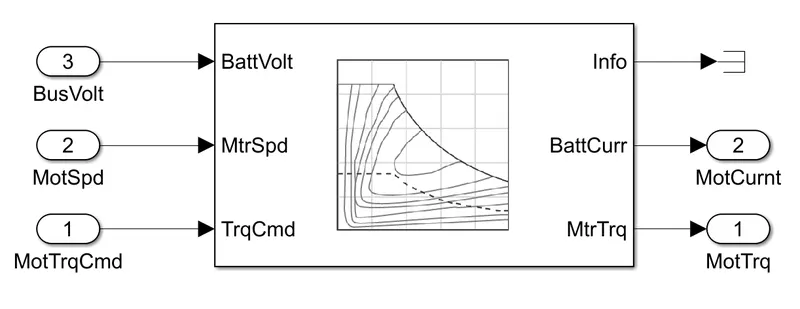
- This block is used for fast system-level simulations when you do not know detailed motor parameters.
- The block assumes that the speed fluctuations due to mechanical load do not affect the motor torque tracking.So it is considered as Macro Level Solver and evaluated for real time scenarios.
Dyanmic model:
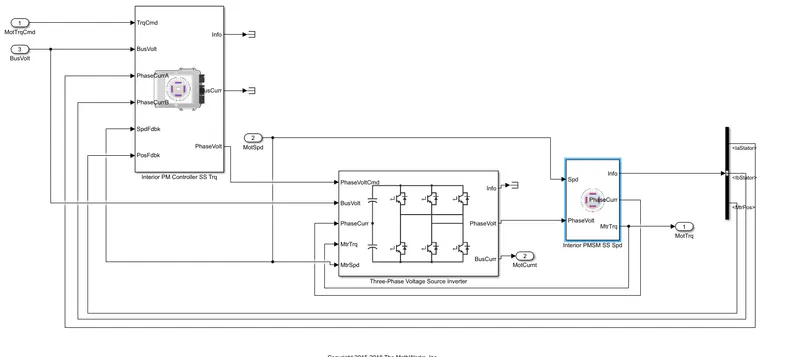
- Dynamic model is a Macro Level Solver which evaluates the outputs from various Subsystem making its a combiantion of various components.
- It considers real time scenarios.
- In dynamic model the Outputs are Fed back to the so that Inputs and outputs are checked during simulation to balance the Demand and supply of Power/Torque.
Steps to Change Mapped to Dynamic and Dynamic to Mapped Models:
- Open the Powertrain block set of the desired vehicle.
- Now Open the Passenger Car/ Vehicle model model.
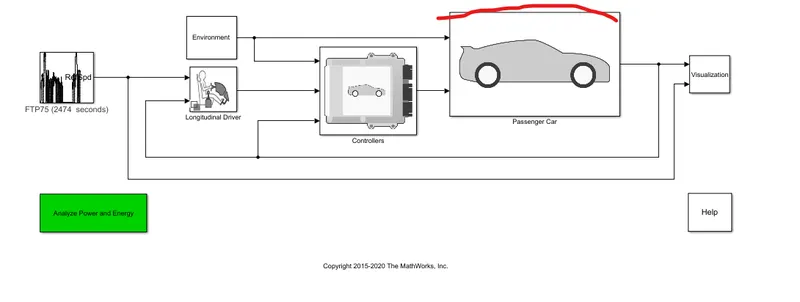
- Now select the Electric plant/engine block.
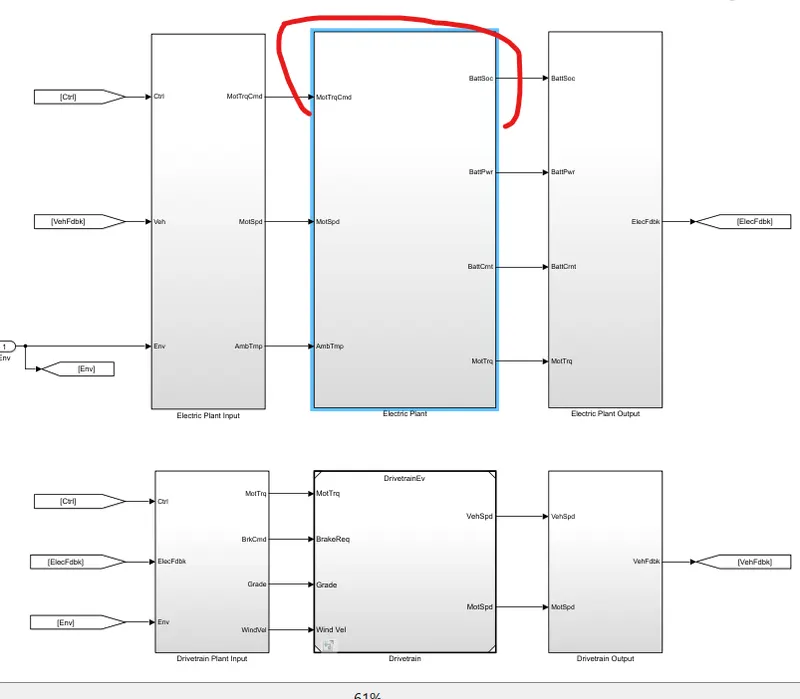
- Next select Motor/Engine/Generator based on vehicle model selected.
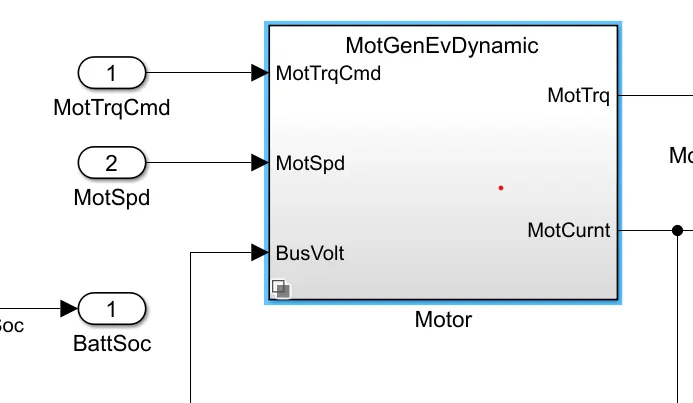
- Now Right click on the window other than the blocks then select variant ,then select label mode active choice and choice the desired model.
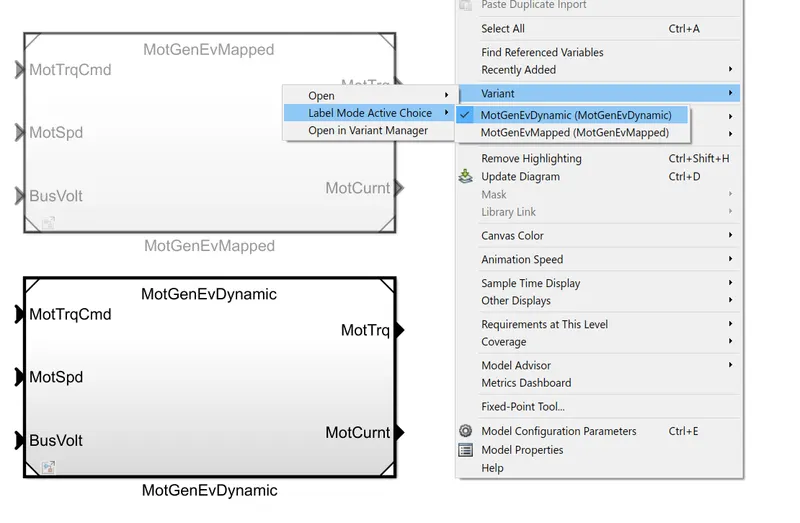
Conclusion: Hence we have major differences between Mapped and Dyanmic model of Engine/Motor/Generator and also stated how to change from one model configuration to other.
2) Aim: To describe how the model calculate miles per galon and also factors considered to model the fuel flow.
- Meaning of Gallon per mile: Mpg stands for miles per gallon, and is used to show how far your car is able to travel for every gallon (or 4.55 litres) of fuel it uses.
- MPG is also the primary measurement of a car's fuel efficiency: The higher a car's MPG, the more fuel efficient it is.
- Miles per gallon for electric vehicles (MPGe, or “miles per gallon equivalent”) places a value on your car’s energy efficiency. A higher MPGe indicates a higher energy efficiency rating; a lower MPGe indicates a lower rating. MPGe is independent of factors such as range and battery life, so it remains important to examine your vehicle’s fuel efficiency.
- Here are some of typical [mpge] ratings of the electric vehicles.
| Electric car model (base level) | Efficiency (miles per gallon equivalent) |
|---|---|
| Nissan Leaf | 111 MPGe |
| Chevrolet Bolt | 118 MPGe |
| Tesla Model S | 109 MPGe |
| Tesla Model X | 101 MPGe |
| Tesla Model 3 | 134 MPGe |
| Tesla Model Y | 121 MPGe |
| Audi e-tron | 78 MPGe |
| Porsche Taycan | 79 MPGe |
Miles per gallon for hybrid vehicles:
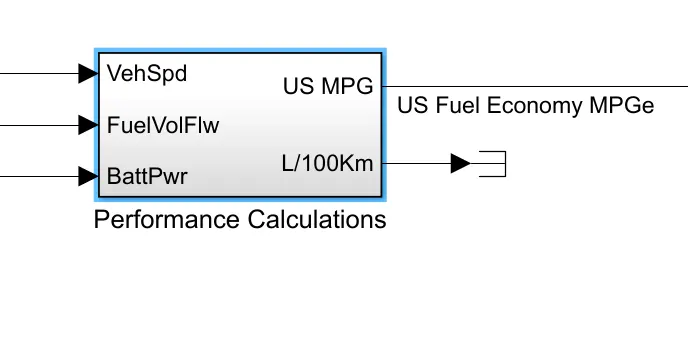
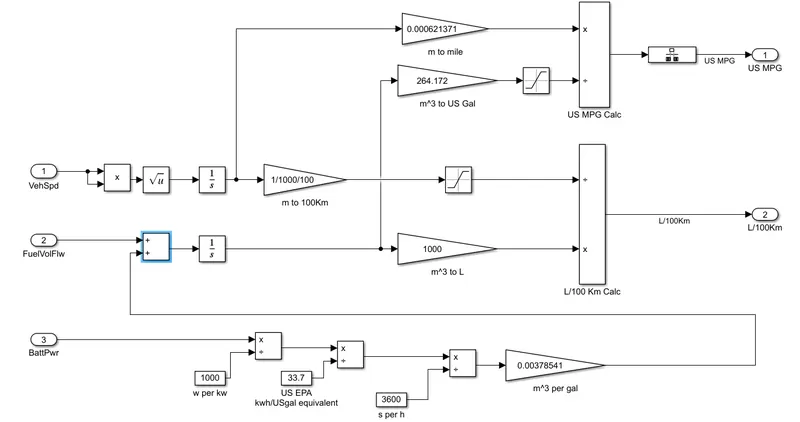
In the above considered vehicle set the factors considered are
- Vehicle block set: Vehicle speed block set is Integrated over the time to get the total distance travelled in meters now divide ot by 1000 to convert into kilometers. Now convert the (Km) to miles by multiplying by 0.621371.
- Battery block set: The battery power is divided by 1000 to convert Watts to KiloWatts, then divided by 33.7 to convert into kWs/USgal equivalent, next divided by 3600 seconds to hours , then fed with the constant multiplier of 0.00378541 to get the mass floe]w rate(kg/m^3).
- Fuel Flow rate: The above is fed as input in Fuel flow block and now integrated with time to get m^3/gal. If we multiply it with 1000 we get fule rate in Litres and the divided by vehilce in Km with saturation limits gives Liters/100Km
- Now the m^3 is multiflied by constant 264.172 to concert into US gal and sature the limits.
- Saturating limits means bounding the upper and lower limits of the the obtaining values.
- Finally The total distance in miles is divided by the US Gal so hence we get the final result in miles per gallon.
Miles per gallon equivalent for electric vehicles:
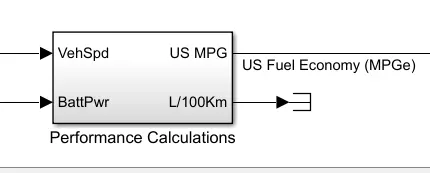
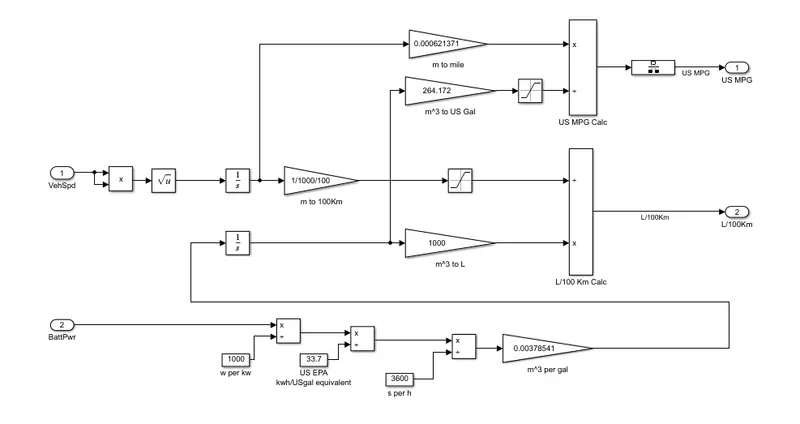
The factors considered here are
- Vehicle speed: The vehicle speed is integrated over the time to calculate the distance in meters. If we divide the value by 1000 it gives the result in Km and if we multiply by 0.000621371 we get the value in Miles.
- Battery power: The battery power is divide by 1000 to convert into kW. Then divide by 33.7 to convert into US Gallon equivalent (kWs) ,then divided by 3600 to convert into kWh , now multiplied by 0.00378541 which gives outout in m^3/gallon. This is intergated over time mulltiplied by 1000 to get converted into liters or after integration is multiplied by264.172 to convert into US gallon.
- The battery power componnet in liters is divide by the saturated value of Vehicle speed component in Km gives the output as L/100km.
- Similarly if the vehivle speed component in miles is divided by saturated value of Battery poer component in US Galllon gives the output as MPGe.
Conclusion: Hence we understand the meaning of miles per gallon, umderstood how the model calculates MPG for different vehicles and also stated the factors considered for the calculations of MPG.
3) Aim: To the HEV ReferenceApplicaltion with WOT drive cycle and by changing the values of grade and wind velocity in the environment block and compare the results.
Powertrain Model:
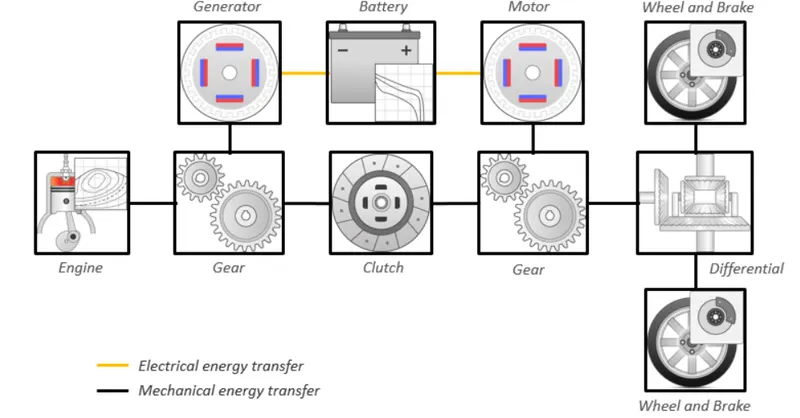
- This model contains Differnt Powertrain block such as engine, Generator, motor, engine, clutch, gear,Wheel and axle etc.,
Model: Overall model of the HEV Refernce.
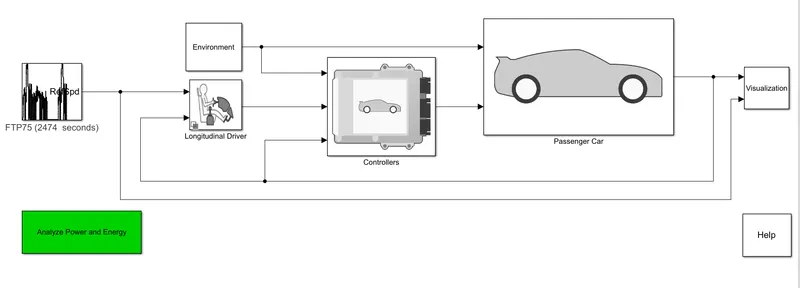
- Its contains a block such as Drive Cycle from where we can define our drive cycle.(FTP75,WOT, and files from excel,.m).
- Longitudinal driver is like a Speed control sysytem which controls the acelleration, breaking of the vehicle Based upon on the input and feedback comparision.
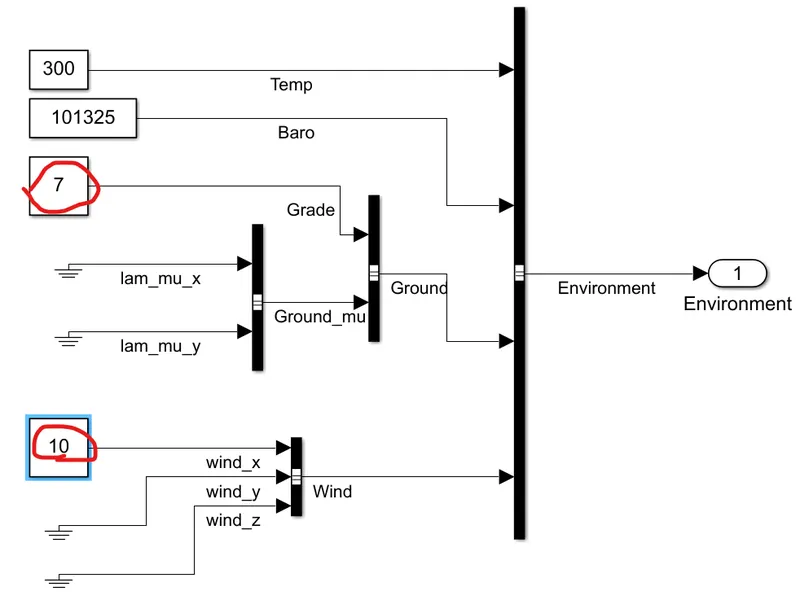
- Environment block as all the environmental conditions acting on the vehcile like Gradeability, pressure, temperature, wind velocity in all the directions.
- Controllers which has all the control operation logics, PCM input ,PCM (powertrain control module), PCM ouput. THe PCM controller has engine control module and hybrid control module. Based upon the inputs and feedbacks these logic are decided. The engine control module has two diffrent variation of engines SI and CI engines. The Hybrid control module as superior control block which controls the motor , brake and generator controls.
- Passenger Car block has three blocks Engine which has different variations SI engine Si mapped engine SIDLE engine CI engine and CI mapped engine, Electric plant has Battery motor and genrator controls and condidtions, and Drivetrain which has the Transmisison, gears, Wheel and axle blocks and outputs of the motion.
- Visualisation is to view the variation of different parmeters during the drive.
By keeping all the default conditions lets run a model see the ouputs. Default conditions: FTP75 drive cycle, SI Mapped engine, zero gradeability ,zero wind velocity, Si Engine controller etc Run the model.
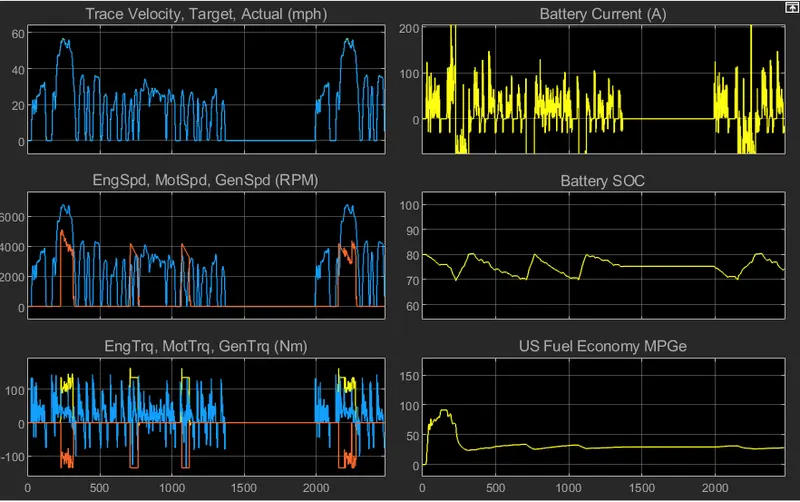
WOT model:
- Now lets make a WOT drive cycle and view the output response.
- To change the drive cycle open drive cycle block and enter the parameters of the WOT as per required drive cycle.
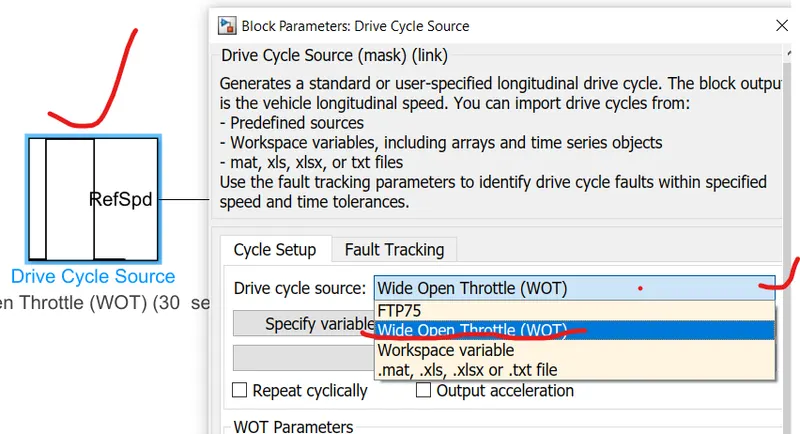
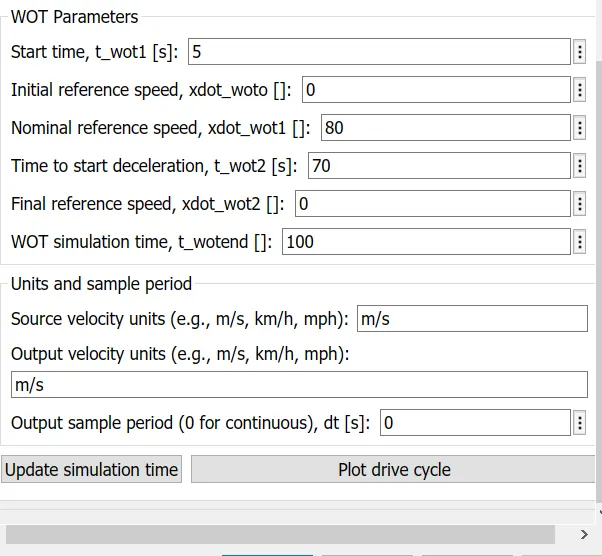
- Now we have applied the WOT drive cycle with nominal speed of 80m/s, time at which deceleration starts is 70 sec, and total simulation time is 100 seconds. Grade as zero and wind velocity also zero, Run the model and view the results.
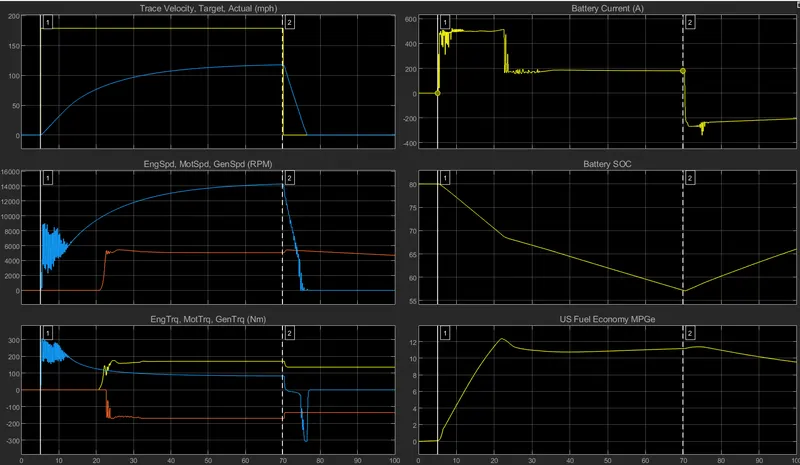
- From the graph we can see that the total acceleration time is 65seconds reaching the top speed 118mph(189.903kmph & 52.707m/s) though our top speed criteria was 80m/s but it is limited to 52.707m/s due to the battery current (discharging current) variable it can give only peak value of 526.2 A if this value is increased then the criteria of reaching top speed can be achieved. The battery SOC is reduced from 80% to 57.21%. The varations in Engine, motor and generator speed & Torque are shown.
- During the delecration condition the time taken is 6.76seconds, the maximum charging current during the decelaration is aprox 241.6 A. The battery is charged from 57.21% to 59.26%.
- The maximum MPG during the drive cycle is 12.35.
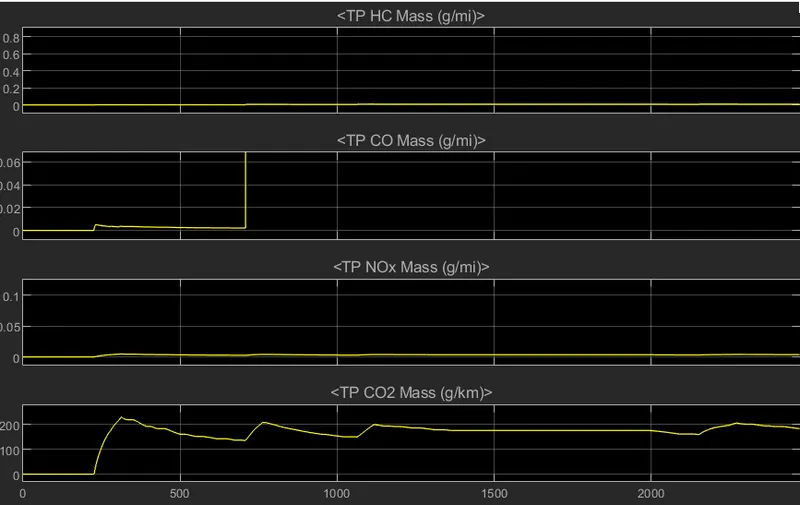
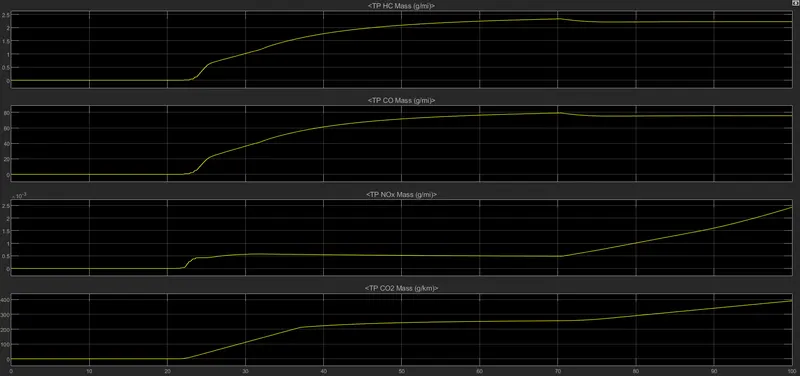
- The emission of diffenrent Gases are also plotted.
WOT model with gradeability and wind velocity:
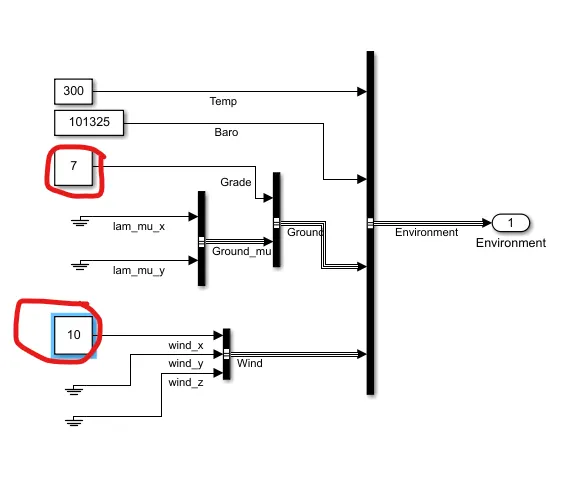
Considering all the same conditions as above nomial speed of 80m/s, time for deceleration is 70sec, total simulation time is 100sec , gradeability of 7% , Windvelocity of 10m/s. and run the model.
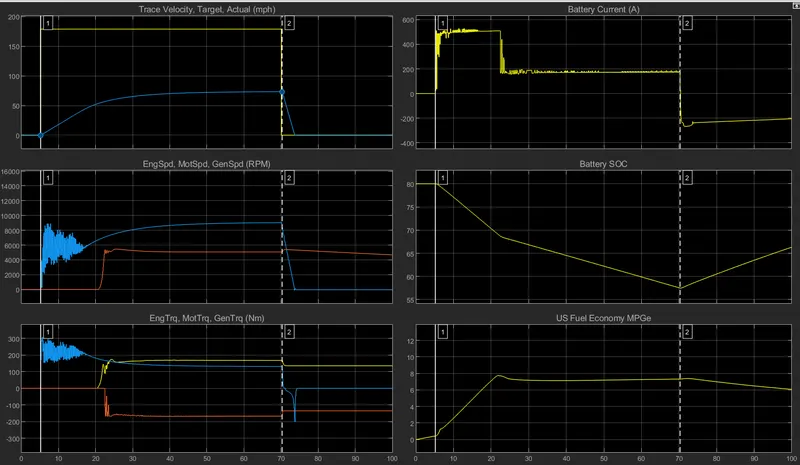
- From the graph we can see that the total acceleration time is 65seconds reaching the top speed 73mph(117.482kmph & 32.64m/s) though our top speed criteria was 80m/s but it is limited to 32.64m/s due to the battery current (discharging current) variable it can give only peak value of 507.4A.The battery SOC is reduced from 80% to 57.49%. The varations in Engine, motor and generator speed & Torque are shown.
- During the delecration condition the time taken is 4.138seconds, the maximum charging current during the decelaration is aprox 266.8A. The battery is charged from 57.49% to 58.67%.
- The maximum MPG during the drive cycle is 7.72.
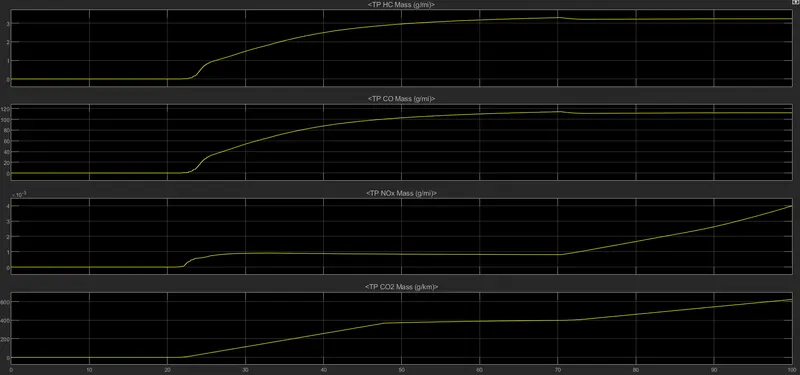
- The emission of diffenrent Gases are also plotted.
Comparision: Refernce speed = 80m/s, time after which decleration happens = 70sec, Total simulation time = 100sec.
| WOT without grading and windspeed | WOT with grading and windspeed |
| Gradability = 0 | Gradeability = 7 |
| Wind velocity = 0 | Wind velocity = 10 |
| Speed obtained = 118mph/(189.903kmph)/(52.707m/s) | Speed obtained = 73mph/(117.482kmph)/(32.64m/s) |
| Max motor speed = 14285 rpm | Max motor speed = 9030 rpm |
| Max engine speed = 5420 rpm | Max engine speed = 5400 rpm |
| Peak motor torque = 3100 Nm | Peak motor torque = 303.6 Nm |
| Max engine torque = 170 Nm | Max engine torque = 167.8Nm |
| Max discharging current = 526.2 A | Max discharging current = 507.4A |
| Max charging current = 301.6A | Max charging current = 266.8A |
| SOC while discharging = 80% to 57.21% | SOC while discharging = 80% to 57.49% |
| SOC whicle charging = 57.21% to 59.26% | SOC whicle charging = 57.49% to 58.67% |
| Max MPG = 12.35 mpg | Max MPG = 7.72 mpg |
| HC emisison = 2.5 g/mile | HC emisison = 3.3 g/mile |
| CO emisison = 80 g/mile | CO emisison = 114 g/mile |
| NO emission = 0.0023 g/mile | NO emission = 0.004 g/mile |
| CO2 emisison = 400 g/km | CO2 emisison = 6200 g/km |
Conclusion: Hence the HEV ReferenceApplicaltion with WOT drive cycle is obtained with and without considering the gradeability and wind velocity , also their their differnces are also discussed on the outputs.
- There is difference between the actual and input velocity curve due to limitation in maximum power from energy sources. The limitation involves current or battery energy,
- The max speed achieved in simulation2 is lesser compared to the simulation1 because there is extra power consumption for grading and wind Force.
- Battery SOC also decreases with increase in total tractivr power increase.
- Fuel economy aslo falls to great to great extent.
4) Aim: By keeping all the parameters same as in case of HEV Reference , Simulate the EV Reference and also copmpare the outputs of the two different models.
HEV model:
- Nomial speed of 80m/s, time for deceleration is 70sec, total simulation time is 100sec , gradeability of 7% , Windvelocity of 10m/s. and run the model.
- From the graph we can see that the total acceleration time is 65seconds reaching the top speed 73mph(117.482kmph & 32.64m/s) though our top speed criteria was 80m/s but it is limited to 32.64m/s due to the battery current (discharging current) variable it can give only peak value of 507.4A.The battery SOC is reduced from 80% to 57.49%. The varations in Engine, motor and generator speed & Torque are shown.
- During the delecration condition the time taken is 4.138seconds, the maximum charging current during the decelaration is aprox 267.2A. The battery is charged from 57.49% to 58.67%.
- The maximum MPG during the drive cycle is 7.72.
- The emission of diffenrent Gases are also plotted.
EV Model:
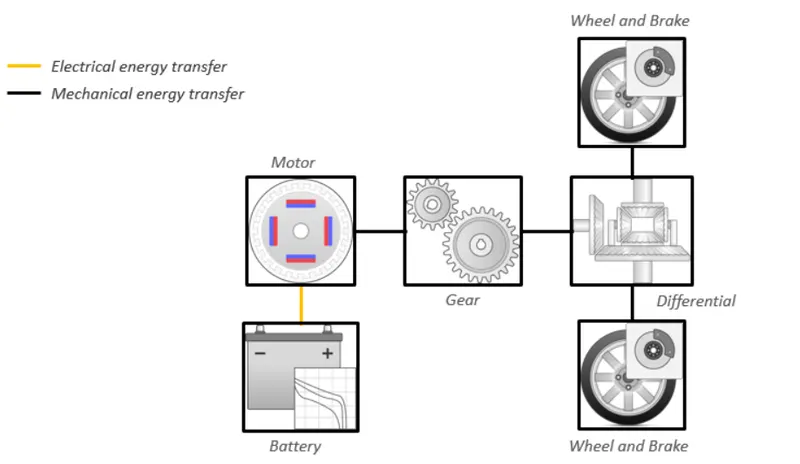
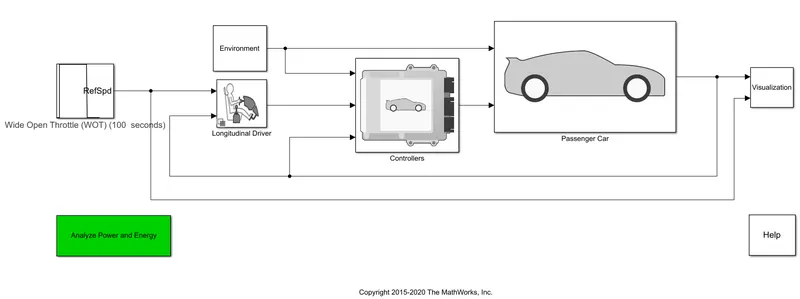
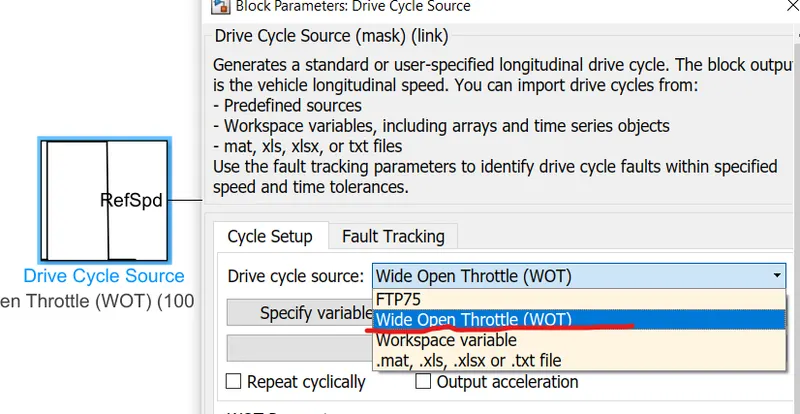
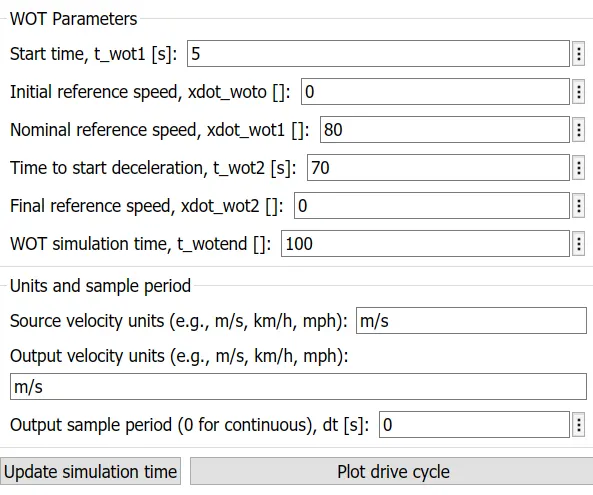
- Nomial speed of 80m/s, time for deceleration is 70sec, total simulation time is 100sec , gradeability of 7% , Windvelocity of 10m/s. and run the model.
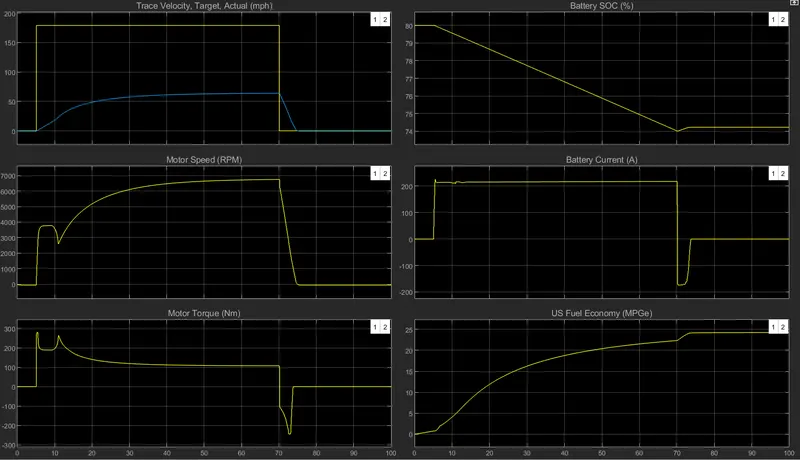
- From the graph we can see that the total acceleration time is 65seconds reaching the top speed 63.73mph(102.56kmph & 28.48m/s) though our top speed criteria was 80m/s but it is limited to 28.48m/s due to the battery current (discharging current) variable it can give only peak value of 217.735A.The battery SOC is reduced from 80% to 74.01%. The varations in motor speed & Torque are shown.
- During the delecration condition the time taken is 4.911seconds, the maximum charging current during the decelaration is aprox 174A. The battery is charged from 74.01% to 74.23%.
- The maximum MPG during the drive cycle is 24.21.
Comparisions:
| HEV model | EV model |
| Grade = 7 | Grade = 7 |
| Wind velocity = 10 | Wind velocity = 10 |
| Speed obtained = 73mph/(117.482kmph)/(32.64m/s) | Speed obtained = 63.73mph/(102.56kmph)/(28.48m/s) |
| Max discharging current = 507.4A | Max discharging current = 217.735A |
| Max charging curent = 266.8A | Max Charging current = 174A |
| Max Motor speed = 9030rpm | Max motor speed = 6745rpm |
| Max motor torque = 303.6Nm | Max motor torque = 280Nm |
| SOC during discharging = 80% to 57.4% | SOC during discharging = 80% to 74.01% |
| SOC during charging = 57.49% to 58.67% | SOC during charging = 74.01% to 74.23% |
| Fuel economy = 7.72 mpg | Fuel economy = 24.21mpg |
Conclusions: Hence the two different models HEV and EV models are comapared with same conditions and their results are also compared.
- The pure EV drive train achieves less speed compared to the HEV.
- The conventional HEV uses lead acid battries whereas EV uses Lithium ion Batteries.