Week-11 Challenge: Braking
1. For a defined driving cycle, calculate the energy required for braking.
Solution:
A driving cycle is a series of data points representing the speed of a vehicle versus time.
There are two types of driving cycles:
- Transient driving cycles involve many changes, representing the constant speed changes typical of on-road driving.
- Modal driving cycles involve protracted periods at constant speeds.
The American FTP-75 and the unofficial European Hyzem driving cycles are transient, whereas the Japanese 10-15 Mode and JC08 cycles are modal cycles.
Driving cycles are produced by different countries and organizations to assess the performance of vehicles in various ways, for instance, fuel consumption, electric vehicle autonomy, and polluting emissions.
Another use for driving cycles is in vehicle simulations. More specifically, they are used in propulsion system simulations to predict the performance of internal combustion engines, transmissions, electric drive systems, batteries, fuel cell systems, and similar components.
The below-driving cycle is designed as per the imaginary driving conditions using an excel sheet.
The speed vs time drive cycle is as shown below.
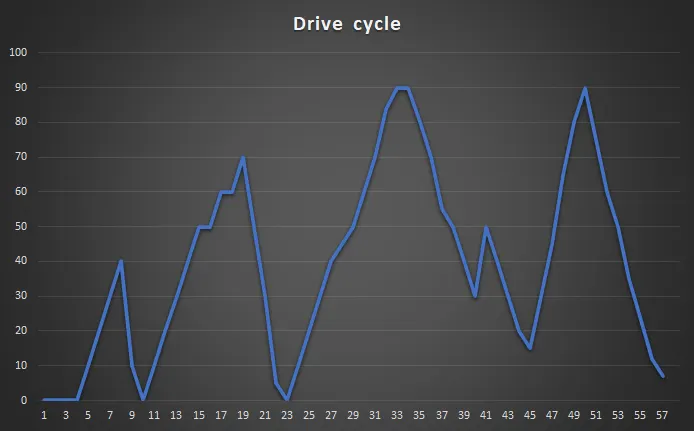
We need to calculate the energy required for breaking.
The energy required for breaking is given by
F = 0.5*m*v^2
Where
m = mass of the vehicle
V = velocity of the vehicle
We have assumed the total mass of vehicles is 600kg.
| Drive cycle | Breaking | Breaking in KJ |
| 0 | 0 | 0 |
| 0 | 0 | 0 |
| 0 | 0 | 0 |
| 0 | 0 | 0 |
| 10 | 30000 | 30 |
| 20 | 120000 | 120 |
| 30 | 270000 | 270 |
| 40 | 480000 | 480 |
| 10 | 30000 | 30 |
| 0 | 0 | 0 |
| 10 | 30000 | 30 |
| 20 | 120000 | 120 |
| 30 | 270000 | 270 |
| 40 | 480000 | 480 |
| 50 | 750000 | 750 |
| 50 | 750000 | 750 |
| 60 | 1080000 | 1080 |
| 60 | 1080000 | 1080 |
| 70 | 1470000 | 1470 |
| 50 | 750000 | 750 |
| 30 | 270000 | 270 |
| 5 | 7500 | 7.5 |
| 0 | 0 | 0 |
| 10 | 30000 | 30 |
| 20 | 120000 | 120 |
| 30 | 270000 | 270 |
| 40 | 480000 | 480 |
| 45 | 607500 | 607.5 |
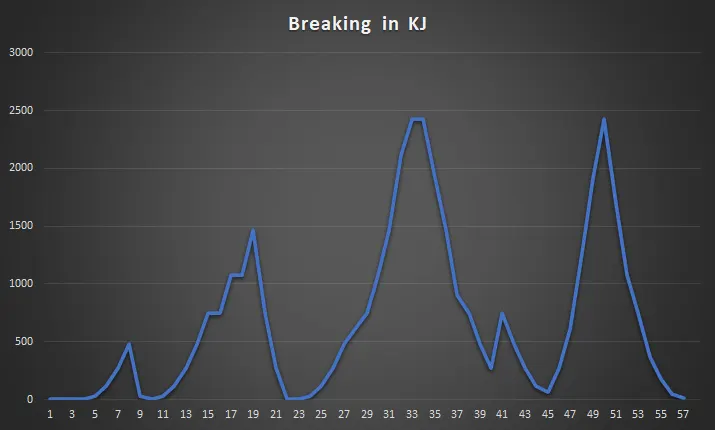
We have done these calculations in the same excel sheet using formula and the results are in the formate of jouls, we have divided the result by 1000 to express the results in terms of kilojoules(KJ).
The Force required for breaking is as shown in the below graph.
Attached Excel file for reference.
///////////////////////////////////////////////////////////////////////////////////////////////////////////////////////////////////////////
2. Why electric motor can’t develop braking torque at a high speed similar to starting? How electric and mechanical brakes are coordinated?
Solution:
The Torque-speed characteristic of the motor is not the same in the breaking and monitoring regions.
The Amount of charge consumed by the motor during motoring/accelerating is not the same as the amount of charge produced by the motor while deaccelerating.
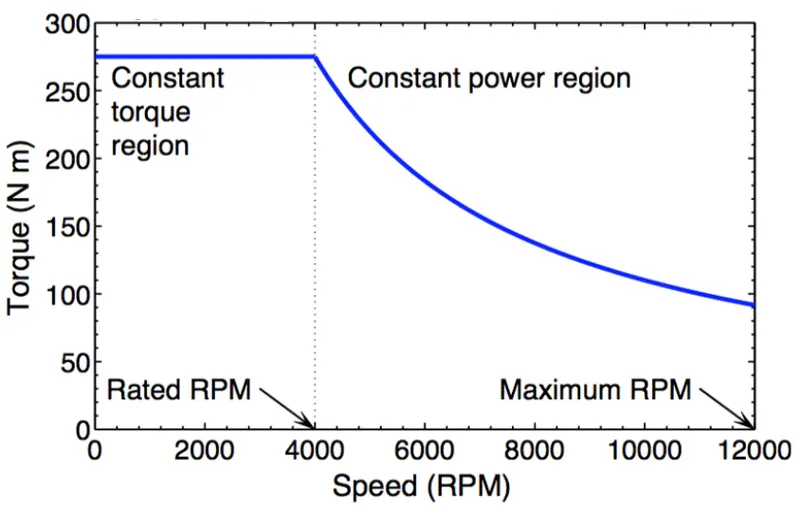
Here it is clearly shown in the figure that, till the motor reached the maximum speed it has constant torque and once it reached its maximum speed, the torque reduces having a downslope which can be considered as a constant power region.
When the motor starts deaccelerating, motor characteristics are shifted towards the braking region, in these regions the torque is negative with positive speed and the motor will not have any torque available for breaking as the motor is already running at its high speed.
Due to this operation, the electric motor can develop braking torque at a high speed similar to starting.
Electrical and mechanical braking is controlled using Break control strategies:
There are two types of control strategies namely
- Serial break control strategies
- Parallel break control strategies
Serial break control strategies:
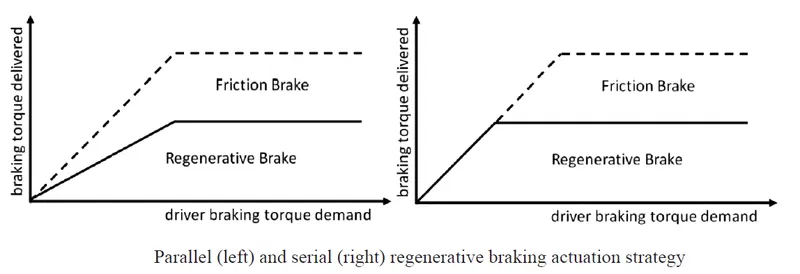
In this type of brake control strategy, when breaks are applied the system tends to apply breaks one after the other(regenerative and mechanical break) depending on the breaking condition.
Only one brake is applied at a time.
If breaks are partially pressed to slow down the vehicle, the regenerative breaks are applied first, then mechanical breaks are applied.
If breaks are fully pressed, the mechanical breaks are applied immediately to stop the vehicle in an emergency.
This breaks total depends on the pressure applied on the breaks, battery percentage, speed, and other parameters of the vehicle.
Parallel break control strategies:
In this type of brake control strategy, when breaks are applied the system tends to apply both the breaks(regenerative and mechanical break) at the same time.
Both breaks are applied at the same time
This brake control strategy does not depend on the pressure applied on the brake peddle, it will apply both regenerative and mechanical break and mechanical break at the same time.
The regenerated power depends on the velocity of the vehicle and stopping power of breaks.
///////////////////////////////////////////////////////////////////////////////////////////////////////////////////////////////////////////
3. Make a MATLAB program that plots the contour of given motor speed, torque, and efficiency values. Attach the code as a .m file attach a screenshot of all the plots.
Solution:
In order to plot the contour of given motor speed, torque, and efficiency values.
We have the below motor losses coefficient
Copper losses coefficient (kc)= 0.2
iron losses coefficient (ki)= 0.008
windage losses coefficient (kw)= 0.00001
constant losses (C)= 20
The losses are given by
Copper loss = kc*T^2
Iron loss = ki*w
windage loss = kw*w^3
Where
T = Torque
w = Speed
The total power loss is given by
Total loss = Copper loss+Iron loss+windage loss+constant losses
hence
Input power = output power+total losses
Efficiency is given by
Effeciency= output power/input power
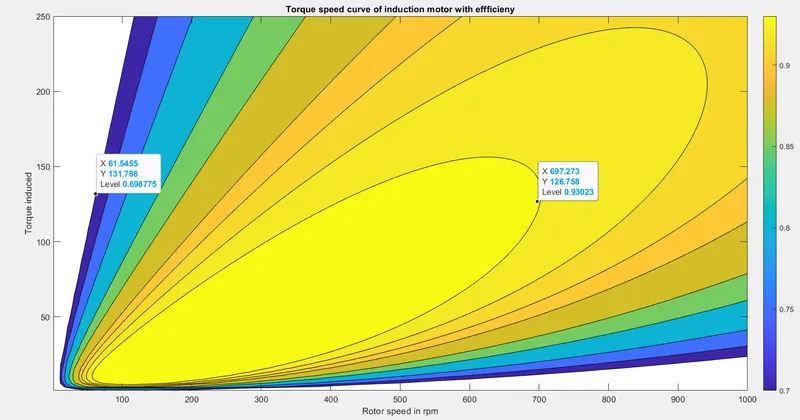
we have used all the above equations to plot the contour of the given motor.
The Matlab code is given below
clc
clear all
close all

velocity = linspace(1,1000);    %Speed
Torque = linspace(1,250);       %Torque Nm

kc = 0.2;                  %Copper losses coefficient
ki = 0.008;                %iron losses coefficient
kw = 0.00001;              %windage losses coefficient
con = 20;                  %constant losses

[x,y] = meshgrid(velocity,Torque);
output_power = (x.*y);

cl = (y.^2)*kc;            %Total copper losses
il= x.*ki;                 %Total iron losses
wl = (x.^3)*kw ;           %Total windage losses

input_power = output_power + cl + il + wl + con;
efficiency = output_power./input_power;

v = [0.7, 0.75, 0.8, 0.85, 0.875, 0.9,0.91, 0.92, 0.93];

box off
grid off

contourf(x,y,efficiency,v);

colorbar

xlabel('Rotor speed in rpm');
ylabel('Torque induced');
zlabel('Efficiency');
title('Torque speed curve of induction motor with effficieny');
The Output Contour plot is as shown below
From the plot, it is clear that the max efficiency of 93% is achieved at Speed 691.2 rad/sec and Torque 126 nm.
The lowest efficiency of 69% is achieved at Speed 61.54 rad/sec and torque 131.768nm.
Attached Matlab file for reference.
///////////////////////////////////////////////////////////////////////////////////////////////////////////////////////////////////////////