Week-11 Challenge: Braking
1) Calculation of Braking energy
Objective:
To calculate the braking energy required for braking for the defined driving cycle.
Procedure:
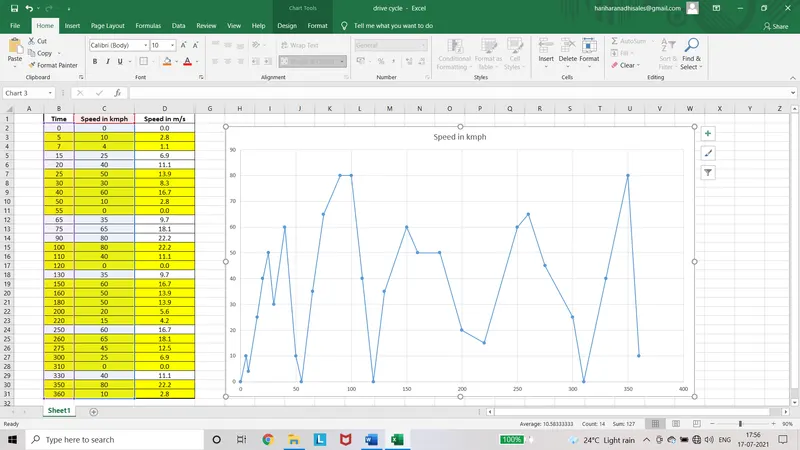
- Create the new Xcel spreadsheet.
- Enter the values of time in sec and speed in Kmph.
- Convert the speed to m/s by multiplying (1000/3600).
- Plot the graph for time and speed.
- The above is the driving cycle for which the braking energy has to be calculated.
- The graph represents the user defined driving cycle.
Matlab Code:
clear
n=xlsread('drive cycle');
v=n(:,3);
t=n(:,1);
m= 1000;
vi=[];
vf=[];
for i=1:(length(v)-1)
if v(i)>v(i+1)
vi=[vi,v(i)];
vf=[vf,v(i+1)];
else
end
BrakingEnergy= (0.5*m*(vi-vf).^2);
end
x=sum(BrakingEnergy);
y=sprintf('Total braking energy = %f Watts (or)%f kW',x,x/1000);
disp(y);
Explanation:
- The drive cycle data from the Xcel spreadsheet is accessed by matlab file by using the command xlsread(‘file name’).
- The values of speed and time are get from the spreadsheet of by giving the corresponding column number.
- The mass of the vehicle is considered as 1000kg.
- When the braking happens the value of speed decreases.
- By that condition, if the value of speed at the time is less than the previous time instant the braking happens. And the braking energy is calculated.
- The loop is made to calculate where the braking happens.
- Braking energy = ½*mass*(initial velocity during braking - final velocity during braking)^2.
- Or else the value of speed at the time instant is grater than the previous time instant, the acceleration happens and the braking does not happen.
- So that the braking energy required during this time is zero.
- Total braking energy is calculated by using the command sum(BrakingEnergy).
- And the values are displayed in the command window.
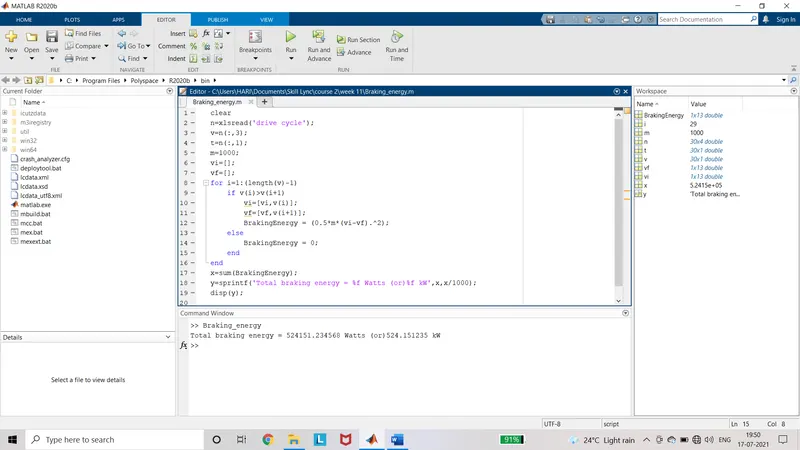
Result:
The total braking energy required for the user defined driving cycle is 524151.234568 Watts (or) 524.151235 kW.
2) Braking torque of electric motor:
Objective:
To analyse why electric motor cannot develop braking torque at high speed similar to starting and how mechanical and electric brakes are co-ordinated.
Torque Speed Characteristics of Induction motor:
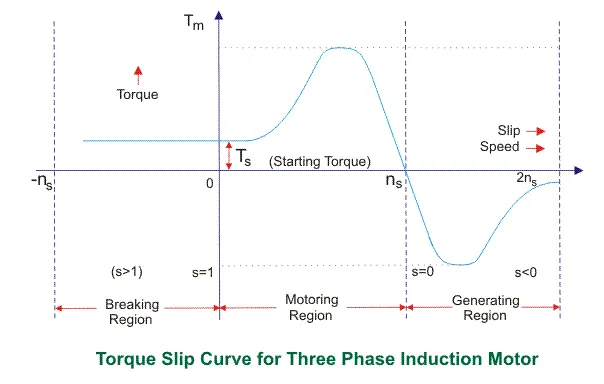
- During the operation of the motor, the initial torque is less at zero speed.
- When the supply is given to the field, the high torque is generated and it is maintained constant.
- This region is called the constant torque region and the speed increases.
- After certain value of speed, the torque suddenly decreases as the speed gains.
- This region of operation is called the constant power region.
- Both the constant torque region and constant power region cumulatively called as the motoring region.
- The slip value decreases from 1 to 0 as the speed gains.
- The torque at the slip 0 that is at synchronous speed of rotor is zero. Hence the motor does not run at this speed.
- At higher speed, When the brake is applied the speed reduces but the torque is very less.
- If the motor is operated at speed more than the synchronous speed, the machine get to the generating mode, here the torque is negative.
- The machine is operating in the field weakening mode as the motor is supplying the current back to the field winding.
- Hence the field current is reduced which is directly proportional to the torque.
- If the field current is decreases, the corresponding torque also decreases.
- Therefore when the brake is applied the torque is not as high as accelerating torque.
- The main difference is field awakening and field weakening mode.
- If the sudden brake is applied the regenerative brake does not work, because there is not enough torque to give supply to the battery.
- And also the charging rate of battery is limited by the chemical composition.
- Regenerative brakes are mostly efficient at the lower speeds.
Combination of mechanical and regenerative brake:
Mechanical Braking:
- In this type of braking the vehicle uses the friction type and hydraulic type to stop the vehicle or reduce the speed.
- Due to friction, there will be the more amount of heat is produced.
- This results in the wear and tear of the disc and mechanical parts.
- The amount of traction energy is emitted as unwanted waste.
- By this braking, suddenly the vehicle speed can be reduced.
- For the smoother operation ABS is used.
Regenerative Braking:
- Regenerative braking is the energy recovery mechanism that reduces the speed of the vehicle or object by converting the kinetic energy into the electrical energy and is stored in the battery.
- Instead of using mechanical brakes where these kinetic energies are dissipated in the form of heat in the disc as waste.
- This can be used efficiently by converting the kinetic energies to storable form of energy in the battery by operating motor as the generator.
- Therefor the traction power is used efficiently instead of waste so the efficiency is increased.
- Due to mechanical brakes where the direct involvement of mechanical parts leads to heat and wear and tear.
- As it is absent in regenerative braking because it uses power controllers instead of mechanical parts.
Types:
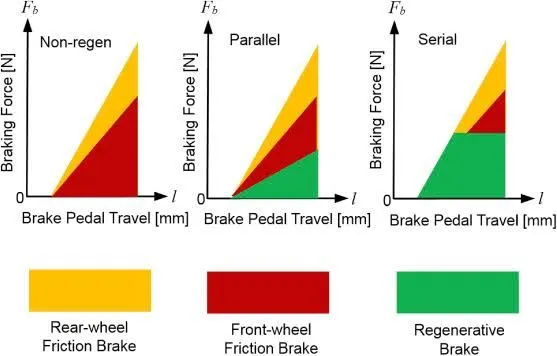
- Series combination
- Parallel combination
Series Combination:
- In this type first the regenerative braking is applied and after some extent the mechanical brakes to rear and front axle are applied.
- But it is more efficient only at the lower speeds.
Parallel Braking:
- In this mode the Initially both the brakes are applied after that regenerative braking is used predominantly to reduce the wastage of power.
- Initially the speed is reduced to great extent and after that regenerative braking is effective.
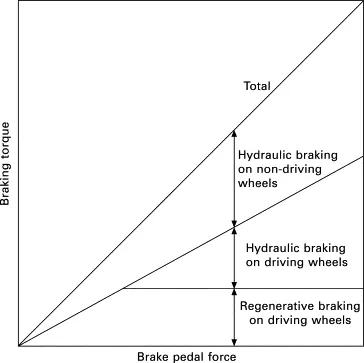
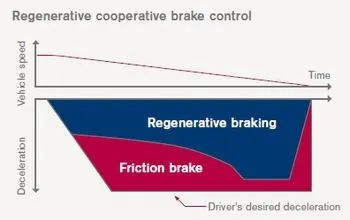
The below image shows the Electric drive Intelligent braking.
Here both the brakes are applied at some proportion for the efficient and safe operation.
3) Matlab program for contour plot of given motor speed, torque and efficiency values:
Objective:
To develop a matlab program for contour plot of given speed, torque and efficiency values.
Contour plot:
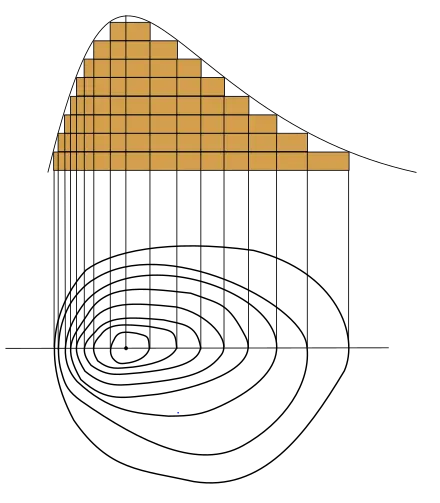
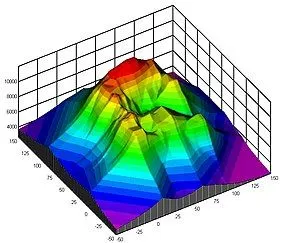
- Contour plot is a two dimensional representation of the three dimensional surface.
- It is a function of two variable among which the one variable has the same value.
- And the curve is used to join the variables of same values.
- When the lines are close to each other the gradient is large and the magnitude is high. It is sleep or peak.
- It is used to represent the topographic map, steep, slope and peak of the hills and valley.
- The x and y coordinates are specified as matrix values X and Y which is as same size as Z.
- Here this plot is used to obtain what is most efficient value for driving the vehicle.
- The value of torque and speed at where the efficiency of the vehicle is high is obtained.
Assumption:
Copper loss constant Kc = 0.2
Iron loss constant Ki = 0.004
Windage loss constant Kw= 0.00002
Motor loss constant C = 25
Formula:
Copper loss = Kc*T^2
Iron loss = Ki*W
Windage loss = Kw*W^3
Total Loss = Copper loss + Iron loss + Windage loss + Motor loss constant
Output power = Torque * Speed
Input Power = Output power + Total loss
Efficiency = Output power/Input power
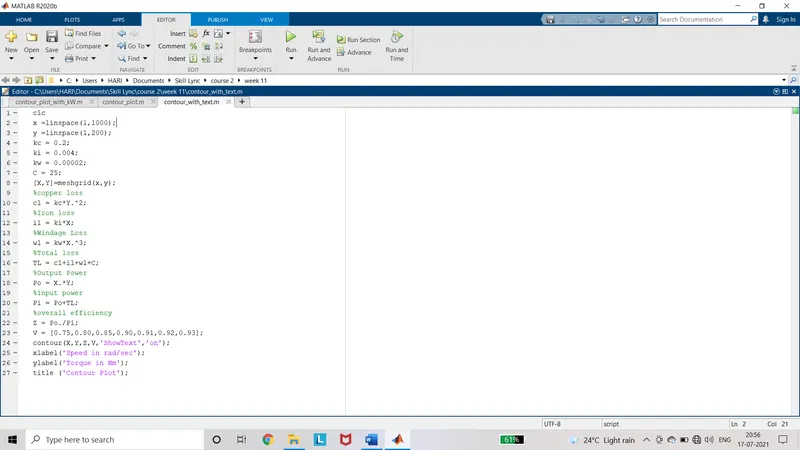
Matlab Code:
clc
x =linspace(1,1000);
y =linspace(1,200);
kc = 0.2;
ki = 0.004;
kw = 0.00002;
C = 25;
[X,Y]=meshgrid(x,y);
%copper loss
cl = kc*Y.^2;
%Iron loss
il = ki*X;
%Windage Loss
wl = kw*X.^3;
%Total loss
TL = cl+il+wl+C;
%Output Power
Po = X.*Y;
%Input power
Pi = Po+TL;
%overall efficiency
Z = Po./Pi;
V = [0.75,0.80,0.85,0.90,0.91,0.92,0.93];
contour(X,Y,Z,V,’ShowText’,’on’);
xlabel('Speed in rad/sec');
ylabel('Torque in Nm');
title ('Contour Plot');
Explanation:
- The length of the axis and the assumed values are entered.
- The meshgrid(x,y) command is used to store the values of x and y coordinates as matrix values of X and Y.
- Then the loss component calculations are entered as per the formulas mentioned above.
- The output power, total loss and power input calculations are made.
- The efficiency is calculated and is stored in the Z matrix of z axis.
- The V axis values are stored with the efficiencies of 0.75, 0.8, 0.85, 0.9, 0.91, 0.92 and 0.93.
- The counter(X,Y,Z,V) is used to plot the Contour.
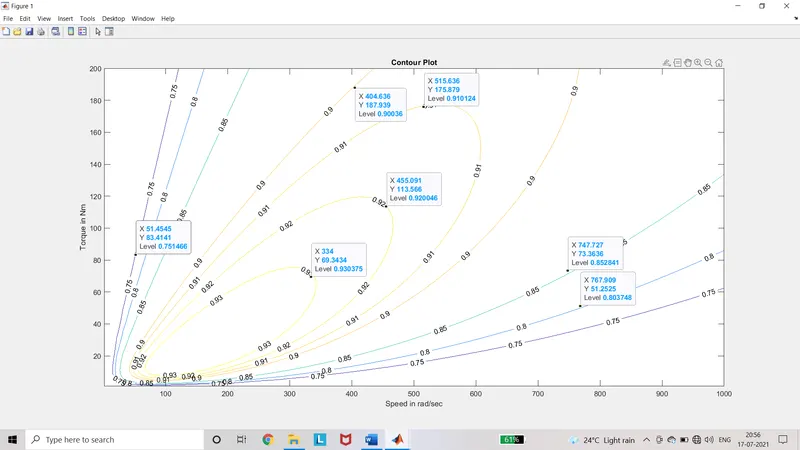
- Additionally contour(X,Y,Z,V,’ShowText’,’on’) is used to show the values of V on the plot.
- The label for x and y axis is entered.
- The title is given for the plot.
Output:
With Text:
Without Text:
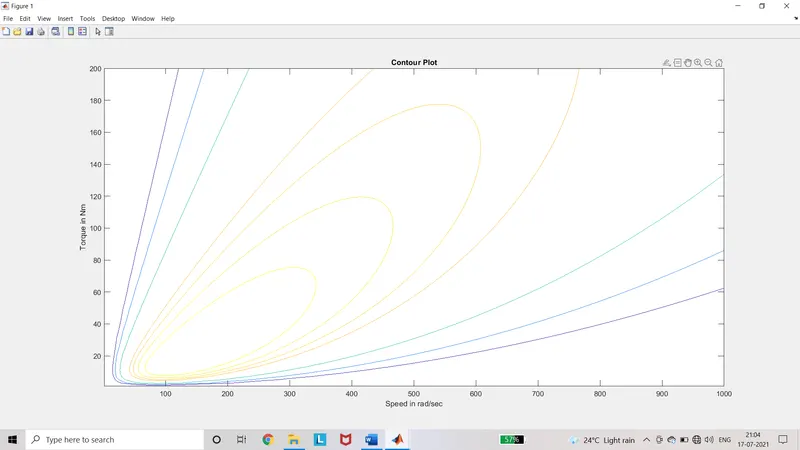
Result:
Maximum efficiency was obtained at Torque of 69.34Nm and at speed 334 rad/sec.
Drive Link:
https://drive.google.com/drive/folders/1RD1-SAZMgFr7_jUwRCVABhz2QQSVP0Td?usp=sharing