Week-11 Challenge: Braking( Braking energy calculation for a drive cycle, Braking torque not produced at high speed,Matlab program for plotting contour for motor torque,speed,efficiency values)
CHALLENGE 11 (BRAKING)
1) Braking energy calculation for a drive cycle.
Objective:
To calculate the amount of energy used up for braking during a period of drive cycle.
Drive cycle:
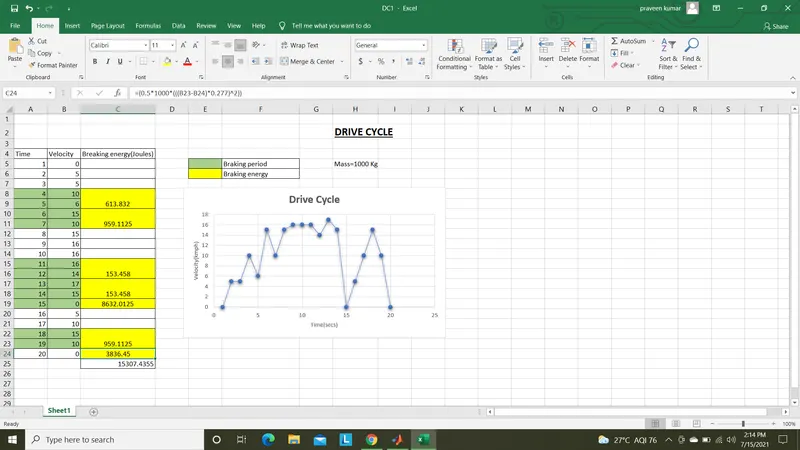
Here i had created a drive cycle data using excel.
Formula:
braking energy: (1/2) *m*((Vi-Vf)^2)
Where,
m=Mass of the vehicle(kg)
Vi=Initial velocity(m/s)
Vf=Final velocity(m/s)
Matlab script:
clear;
num=xlsread('DC1'); %initiating the excel file%
speed=num(:,2);     %stretching speed values from excel%
time=num(:,1);      %stretching time values from excel%
m=1000;             %Mass of vehicle%
vf=[];              %Assign final velocity array%
vi=[];              %Assign initial velocity array%
for j=1:(length(speed)-1) %for loop starts for every speed values%
    if speed(j)>speed(j+1) %if condition for assigning values to vi&vf%
        vi=[vi,speed(j)];
        vf=[vf,speed(j+1)];
    else             %if accceleration happen end the if else%
    end
    BE=(0.5*m*(((vi-vf)*0.277).^2));%calculate Braking energy%
end                   %end of for loop
x=sprintf('Total breaking energy=%f',sum(BE)); %sum of all BE values%
disp(x);            %Display Total breaking energy x value%
Explanation:
- The drive cycle created in excel sheet is imported in matlab script by xlsread command and assigned to a variable num.
- Then speed and time values are stretched by line 3 and line 4 commands.
- Mass of the vehicle is given as 1000Kg.
- Initial and final values of velocities are assigned by array vf=[ ] , vi=[ ].
- Then for loop is executed for every velocity range values.
- But inside for loop we had taken only braking range values for finding its energy reqiurement of braking.
- If there is acceleration occurs in drive cycle,else condition fallow ups and it ends the if else conditions.
- braking energy is calculate by the formulas created and stores it values. For loop again start next set of velocities.
- All the braking energies are summed up finally to get the value of total braking energy.
- The total energy displayed by disp(x) command.
- From this script we can feed any drive cycles and find out the total braking energy happen in that cycle.
Result:
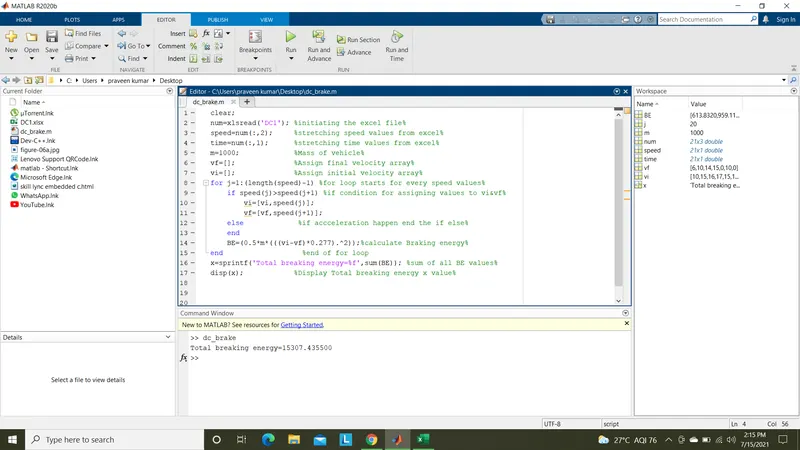
Below shows the result of total braking energy.
The script result and excel calculations are matched.
Total braking energy=15307.435 Joules =15.307 KJ=0.00425KWhr.
We get some less amout of energy as we took only 20 sec of drive with less speeds.
Note: .m file and excel files are attached outside for your referance.
2) braking torque not produced at high speed.
On designing a electrical vehicle there is more importance on configuring the braking parameters with equal importance of accelerating the vehicle.
While accelerating the vehile from 0 speed the torque gradually increases and reach a maximum torque point after that no torque can be increased.
We can say that after that maximum torque acheived constant torque is maintained and after that speed increase at higher speed with reduce in torque, namely constant power region.
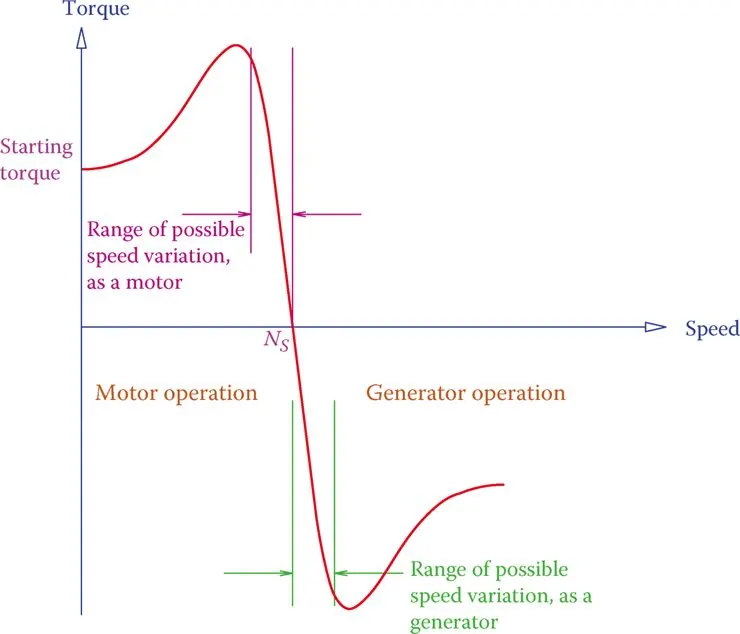
The above graph shows the torque speed characteristics of an induction motor.The motor speed when crossing the synchronous speed Ns,act as a generator to feed current back to the battery source.
The main aspect a motor act as a generator is the rotor rotate at a speed greater than the synchronous speed.
While during accelerating the speed increases from low to high rated speed, the load requires.Since this action is happening high torque(or high current) is generated to increase the motor torque for matching the required load torque.
But once the rated speed attained the torque get reduced to zero at synchronous speed where torque is not necessary.
Here generator action starts. while applying brake there is no necessary of high torque for the generator again to move to motor condition.As motor rotating in above base speed and field weakening region,huge
torque is not necessary to match the load torque.
Thus Electrical vehicles can't able to produce huge torque during braking condition.We can get higher regenerative current in low speed than at high speed brake.
Parallely as torque is less during braking we can't get high amout of current during regenerative braking condition.
Coordination of electric and mechanical braking:
Regenerative braking mechanism are very useful for improving the efficieny of the overall traction power. It improves overall energy by 20 -40 %.In high traffic urban areas breaks are frequently used by the
drivers makes the battery to charge frequently.
In regenerative braking modes the braking forces are given to driven wheels rather than non-driven wheels.However both front wheels and rear wheels are equally balanced on force distribution for safe brake
withod jerks.
In case of high SOC conditions of batteries regenerative braking are not used.In that time mechanial breaks are also come to the effect.
At high emergency breaks mechanical breaks are only way to safe guard us.
So both the regenerative braking and mechanical brakes are used while designing electric vehicles.
In Electric vehicles brakes are classified as three types,
- Friction brake mode.(Pure mechanical)
- Regenerative brake mode.(Pure electrical)
- Combination of both modes.(Both mechanical and electrical)
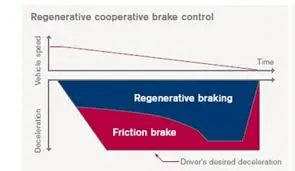
There are two control stategies on designing the breaks.
- Series control stategy
- Parallel control stategies
Series control stategy:
In this mode of control the electrical and mechanical brakes are applied one after another.In this braking method regenerative braking is applied first before mechanical braking.
The regenerative braking and friction braking are controlled by vehicle controller,motor controller and friction brake controller.
Parallel control stategy:
In this mode of control the electrical and mechanical breaks are applied in same time.This control is quite simple as on controlling.
The regenerrative braking is controlled by vehicle controller seperately and friction controller control the mechanical braking directly by brake pedel.
This type of braking is used in EV's and HEV's which have mechanically controlled brakes.
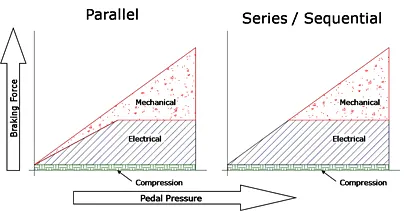
Combined brakeing:
However series brakeing are more costlier than the conventional parallel braking, a combined braking are introduced.
In this mode the energy is regenerated in maximum by mechanically controlled friction brake system.
The breake force is shared with reenerative brakeing,front axle friction brake and rear axle friction brake.
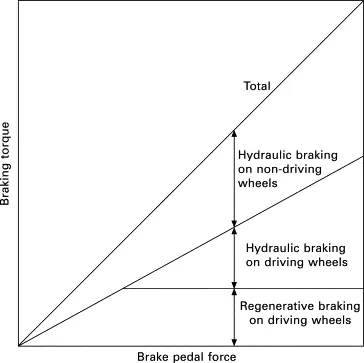
The above plot shows the mechanism of Combined braking share of mechanical and electrical using same pedal action.
3)Matlab program for plotting contour for motor torque,speed,efficiency values.
Objective:
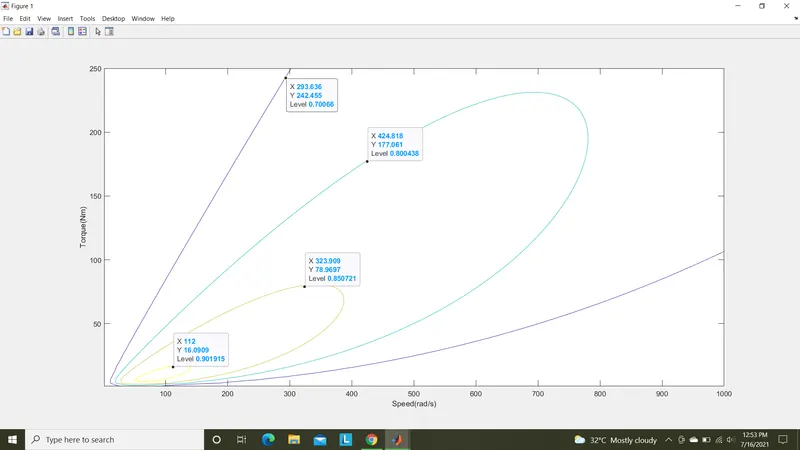
To get a countour graph for motor torque,speed and efficiency values.
Contour graph:
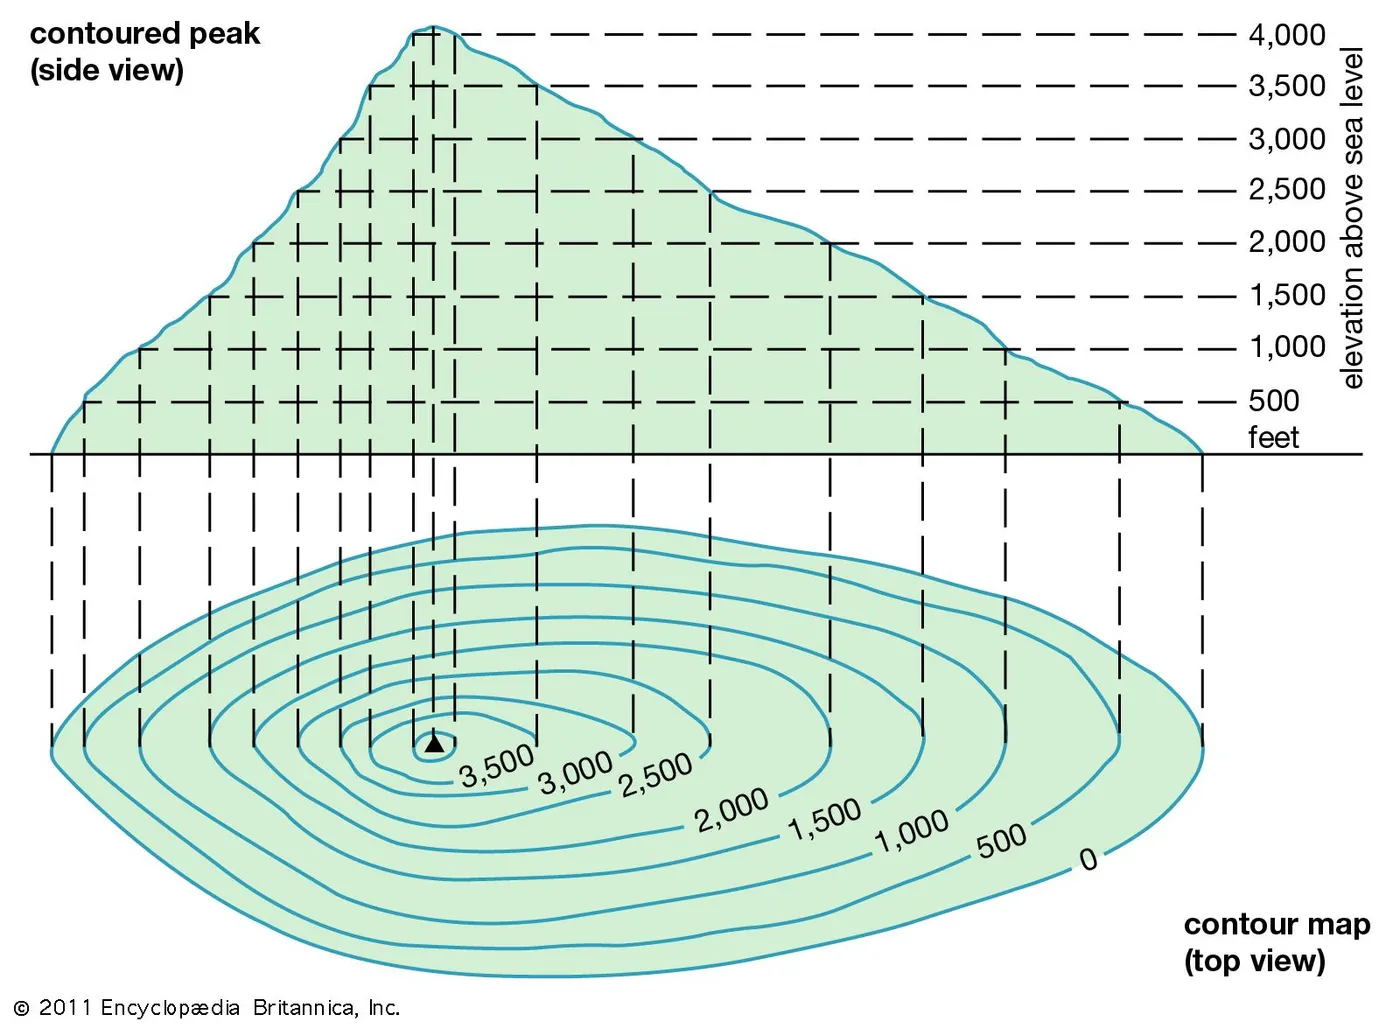
A contour line is a function of two variables in a curve along with the function having constant values,so that the curve join points of equal values.
It is the plane section of 3 dimensional graph of a function f parallel to the plane.
Here in our case two variables are motor speed and torque.Function f is efficiency plane section.
Formula:
Power(In)=Power(Out) + Copper loss +Iron loss +Windage loss + Constant loss.
= Power(Out) + Cu*w2 + Ir*T2 +Wn*w3 + Cn
Efficiency=Power(In) / Power(out)
Here let,
Cu=0.5 Copper loss.
Ir=0.003 Iron loss.
Wn=0.0004 Windange loss.
Cn=10 Constant loss.
Matlab script:
x=linspace(1,1000);  %Assigning speed values rad/sec%
y=linspace(1,250);   %Assigning Torque values Nm %
cu=0.5;              %Copper loss constant%
Ir=0.003;            % Iron loss constant %
Wn=0.00004;          %Windage loss constant %
Cn=10;               %Constant loss%
[X,Y]=meshgrid(x,y); %Loop formation of torque&speed %
Powerout=(X.*Y);     %output power calculation %
B=(Y.^2)*cu;         %copper loss calculation %
C=(X*Ir);            %Iron loss calculation %
D=(X.^3)*Wn;         %Windage loss calculation%
Powerin=Powerout+B+C+D+Cn; %Input power calculation%
Z=Powerout./Powerin;      %Efficiency calculation%
V=[0.70,0.80,0.85,0.90,0.92,0.93]; %Value of effieiency at 70%,80%,85%,90%,92%,93%%
box off
grid off
contour(X,Y,Z,V);  %Contour formation of combination torque,speed,efficiency at assigned percentage% %
xlabel('Speed(rad/s)')
ylabel('Torque(Nm)')
Result:
Here below shown the result efficiency contour plot having high efficiency of 90% at torque and speed, 16.09Nm & 112 rad/sec.
Note: .m file and result images are attached outside.
Thank you
Submitted by,
Praveen Kumar L V
Date:16/07/2021.