Week-11 Challenge: Braking
Week-11 Challenge: Braking
question (a): For a defined driving cycle, calculate the energy required for braking.
Solution: A driving cycle is a series of data points representing the speed of a vehicle versus time. Driving cycles are produced by different countries and organizations to assess the performance of vehicles in various ways, as for instance fuel consumption, electric vehicle autonomy, and polluting emissions.
Drive cycle can be classified into:
- Model Drive Cycle
- Transient Drive Cycle
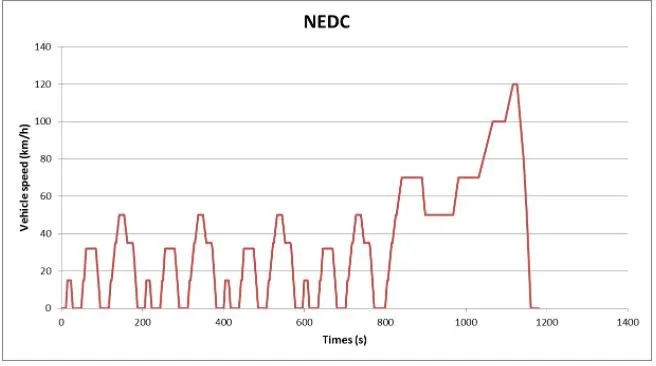
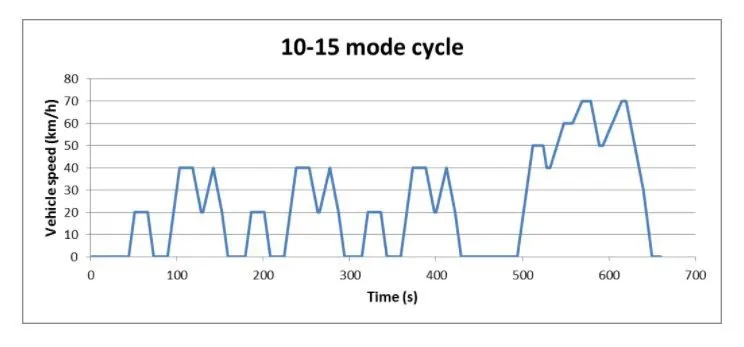
MODEL DRIVING CYCLE: The model driving cycle comprises constant speed and does not represent a real driving pattern of a vehicle. These driving cycles will be used for specific applications such as an emission test.
Eg: European standard NEDC, or Japanese 10-15 Mode
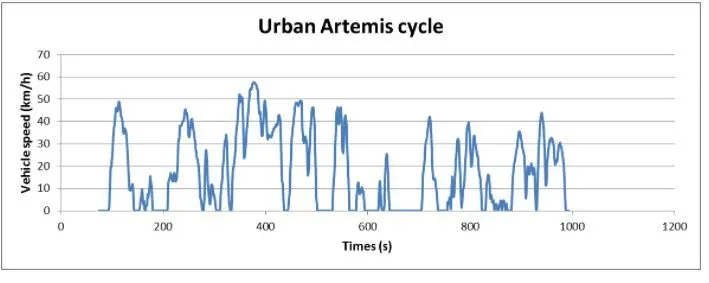
TRANSIENT DRIVING CYCLE: This is the on-road driving cycle with variations in speed and acceleration.
Eg: Artemis Drive Cycle
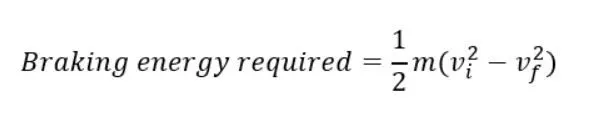
TO CALCULATE BRAKE ENERGY REQUIRED FOR A DRIVE CYCLE :
The kinetic energy of the vehicle is given by
E= 1/2*m*v^2
m: mass of the vehicle
v: velocity of the vehicle
now if
the velocity of the vehicle decreases from Vf to Vi, then the formula is given as:
A MATLAB CODE IS GIVEN BELOW TO CALCULATE THE TOTAL BRAKE ENERGY:
In the below program, a UDDS cycle is considered.UDDS stands for Urban Dynamometer Driving Schedule, and refers to a United States Environmental Protection Agency mandated dynamometer test on fuel economy that represents city driving conditions which is used for light duty vehicle testing.
clear all
close all
clc
mass=input("enter the mass of the vehicle");      %user enters the mass of the vehicle
drive_cycle=xlsread('UDDS')                       %drive cycle data is assigned drive_cycle
time=drive_cycle(:,1);                            %time value is extracted
speed=drive_cycle(:,2);                           %speed value is extracted


for i=1:length(speed)-1
    if speed(i)>speed(i+1)
        br(i)=0.5*mass*(speed(i)-speed(i-1))^2 ;
    end
end

fprintf("total brake energy is %d  KJ", sum(br))       %total brake energy is obtained

figure(1)
hold on
subplot(2,1,1)
plot(time,speed,'linewidth',1,'color','g')
xlabel("time")
ylabel("velocity m/s ")
title("UDDS drive cycle")

subplot(2,1,2)
plot(br,'linewidth',1,'color','r')
ylabel("brake energy")
title("BRAKE ENERGY")
OUTPUT
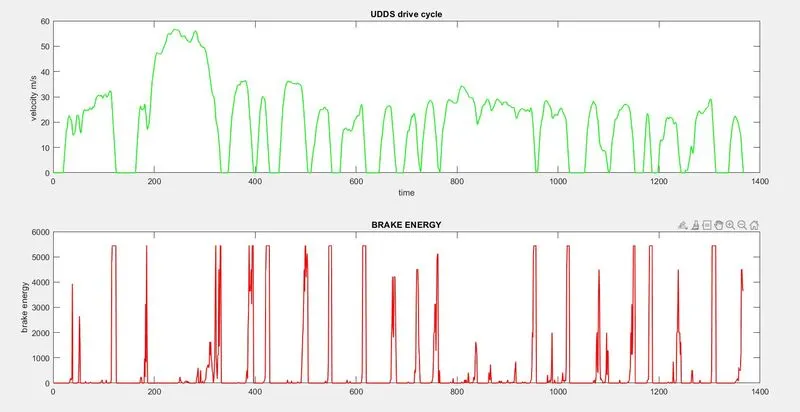
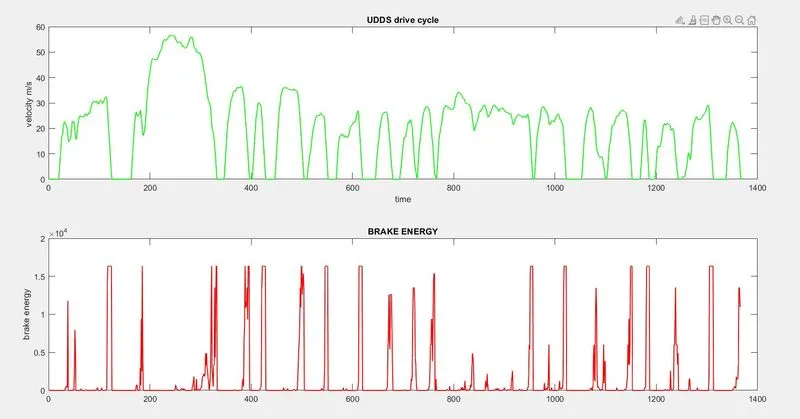
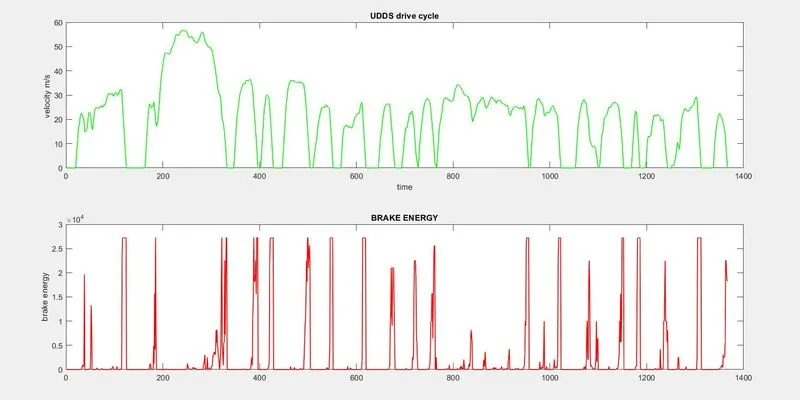
In this, let us consider 3 cases, where mass of the vehicle is
- 1000 Kg
- 3000 Kg
- 5000 Kg
1) 1000 Kg

1) 3000 Kg

3) 5000 Kg

-------------------------------------------------------------------------------------------------------------------------------------------
Question 2: Why electric motor can’t develop braking torque at high speed similar to starting? How electric and mechanical brakes are coordinated?
ANS: Consider the following diagram :
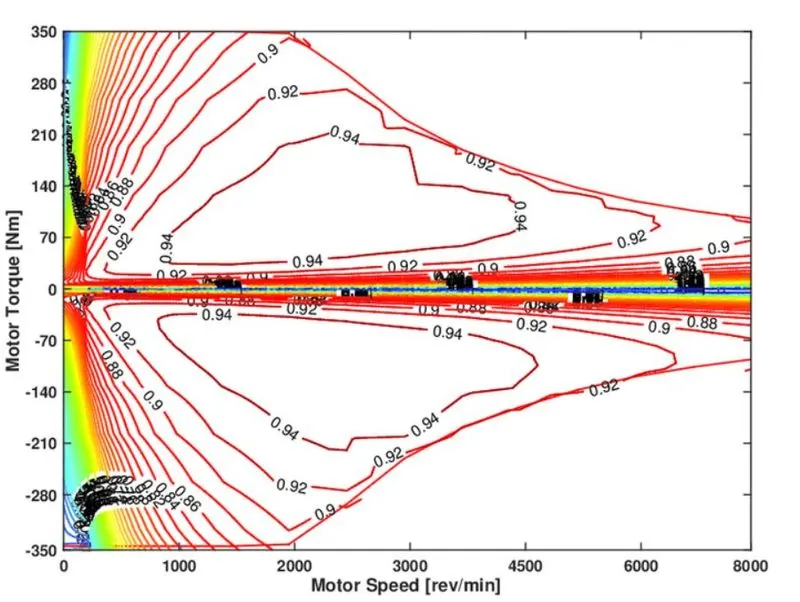
The graph is a Torque-Speed curve along with the efficiency contour. From the graph, the following things can be observed.
- For the motor to start operating from standstill condition, high starting torque is required.
- Once the motor reaches the critical speed, its torque reduces so as to keep the power constant.
- At higher RPM, the torque is very less compared to lower RPM
Now when the brakes are applied,
- the whole operation shifts to the second quadrant.
- It can be observed that the corresponding torque that is developed is very less compared to the initial torque
- As a result, motor is not able to develop a high amount of braking torque
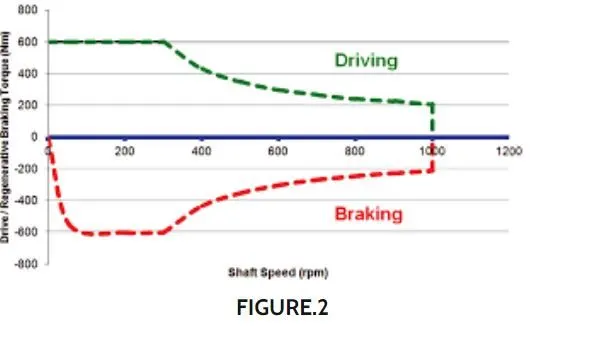
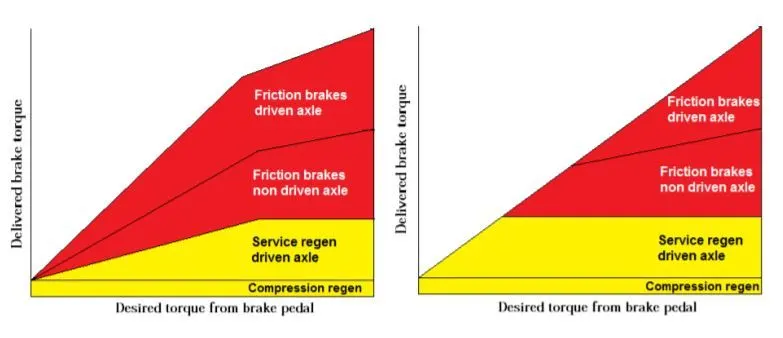
Solution(b): Usually most of the EVs are equipped with electric as well as hydraulic braking systems. Regenerative braking as such is not sufficient enough to produce the required braking torque as a result conventional braking with the help of hydraulic brakes is also required. The brake distribution is given in the below diagram:
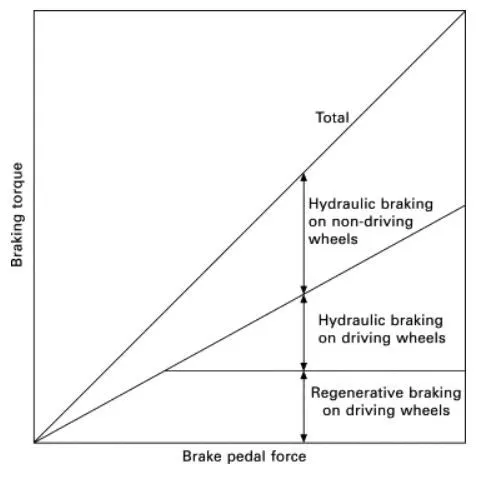
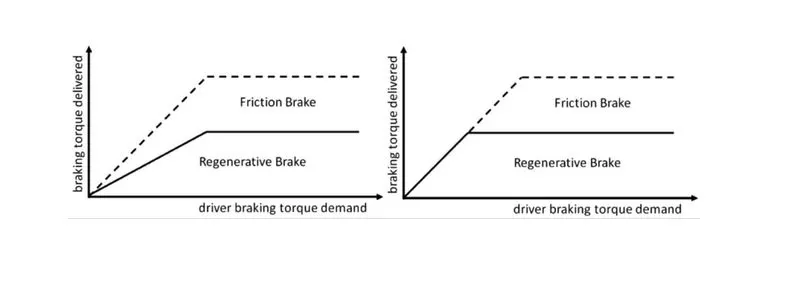
With the help of conventional braking , the motor gives the driver the best braking experience with maximum regenerative braking. When less braking is sufficient to slow down the vehicle, electric braking alone is applied but the demand is higher, the mechanical brakes also come into play , while keeping the regenerative braking maximum to recover the kinetic energy.
Usually two stratergies are used to co-ordinate electric and mechanical braking:
- Serial braking
- parallel braking
Serial braking:
Serial regenerative braking is based on a combination of friction-based adjustable braking system with a regenerative braking system that transfers energy to the electric motors and batteries under an integrated control strategy .The overall design is to estimate the deceleration required by the driver and distribute the required braking force between the regenerative braking system and the mechanical braking system . Serial regenerative braking could give an increase of 15-30% in fuel efficiency. It requires a brake-by-wire system and has more consistent pedal feel due to good torque blending capability.
Parallel Braking:
Parallel braking system is based on a combination of friction-based system and the regenerative braking system, operated in tandem without an integrated control. The regenerative braking force is added to the mechanical braking force which cannot be adjusted. The regenerative braking force is increasing with the mechanical braking force.
-------------------------------------------------------------------------------------------------------------------------------------------
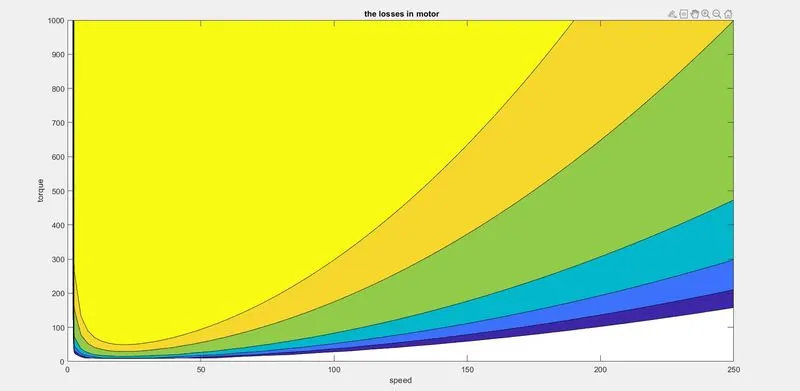
question(3): Make a MATLAB program which plots contour of given motor speed, torque and efficiency values. Attach the code as a .m file attach a screenshot of all the plots.
ANS:
A motor has various kinds of losses happening :
1.Copper losses:

2. Iron Losses

3. Windage losses

4.Constant losses: C
Total loss is the sum of all the losses:

MATLAB PGM TO CALCULATE ALL THE LOSSES:
clear all
close all
clc

omega=linspace(0,1000);
torque=linspace(0,250);

cl_c=input("enter the copper loss constant");
il_c=input("enter the iron loss constant");
wl_c=input("enter the windage loss constant");
constl_c=input("enter the constant loss constant");


[T,W]= meshgrid(torque,omega)

OP= T.*W;
a= (T.^2) * cl_c;
b=  W * il_c;
c= (T.^3)* wl_c;

input_power=OP+a+b+c+constl_c;

Z=OP./input_power;

V=[0.75,0.8,0.85,0.9,0.95,0.97];

contourf(T,W,Z,V)
xlabel("speed")
ylabel("torque")
title(" the losses in motor")
OUTPUT: