Week-11 Challenge: Braking
AIM :
- For a defined driving cycle, calculate the energy required for braking.
- Why electric motor can’t develop braking torque at high speed similar to starting? How electric and mechanical brakes are coordinated?
- Make a MATLAB program which plots contour of given motor speed, torque and efficiency values. Attach the code as a .m file attach a screenshot of all the plots.
1.For a defined driving cycle, calculate the energy required for braking.
Theory :
The Braking performance is one of the most important concerns in vehicle safety. In urban area driving, a significant amount of energy is consumed in braking. Electrification of vehicle makes it feasible to recover some of the energy lost in braking. A hybrid braking system was developed to ensure the efficient braking of vehicle and recovering the braking energy. The design and control objectives of such hybrid braking system is to ensure sufficient braking force to quickly reduce the vehicle speed, properly distributing the brake force to front and rear axle and also to recover as much braking energy as possible. So understanding of braking energy of a drive cycle is important.
Governing Equation :
Braking Energy = 0.5 x m v^2 J
where,
m = mass of vehicle (kg)
v = Velocity of vehicle (m/s)
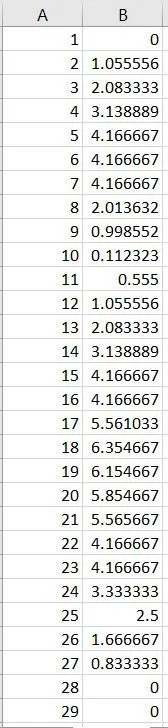
Drive Cycle :
MATLAB Code -
clear all
close all
clc

% Importing Drive cycle
drive_cycle = xlsread('DriveCycle.xlsx');
speed = drive_cycle(:,2);
time = drive_cycle(:,1);
vf=[];       % final speed
vi=[];       % initial speed
m = 600      % mass of vehicle

% picking initial and final speed of decceleration
for i = 1:(length(speed)-1)
    if speed(i)>speed(i+1) && speed(i+2)<speed(i+1) && speed(i-1)<speed(i)
        vi = [vi,speed(i)];
    elseif speed(i)<speed(i+1) && speed(i+2)>speed(i+1) && speed(i-1)>speed(i)
        vf = [vf,speed(i)];
    end
end
% Calculating Energy required in acceleration and decceleration at each step
dV = gradient(speed);
dt = 1;
a = dV./dt;
E = (0.5*m.*gradient(speed).^2);

% Calculating Braking Energy at each step
B = (0.5.*m.*(vf-vi).^2)/1000
x = sprintf('Total Braking energy = %0.2f kJ',sum(B));
disp(x)

% Plotting Drive cycle with energy required in acceleration and decceleration
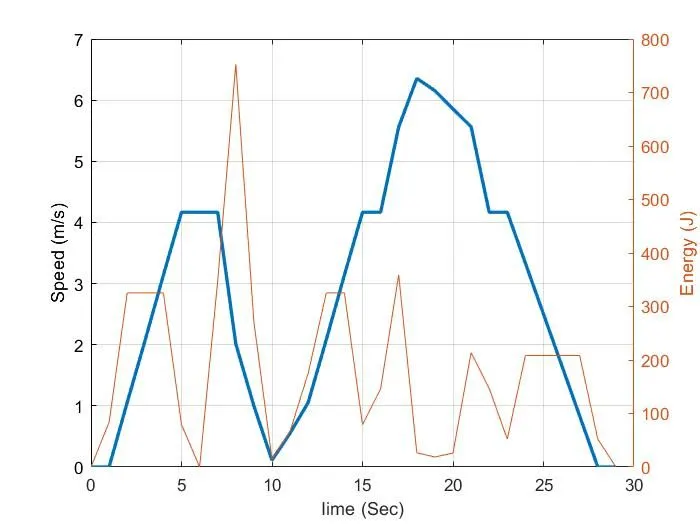
plot(time,speed,"LineWidth",2)
yyaxis right
plot(time,E)
xlabel('Iime (Sec)')
ylabel('Speed (m/s)')
grid on
Explaination :
- Import the drive cycle file
- Extract the speed and time from the file and assign it to arrays
- Initialize the initial and final speed arrays.
- Define mass of vehicle.
- For loop to get the initial and final speed of decceleration.
- Use of if and if-else statement to determine the decceleration condition and storing it in the initial and final speed arrays.
- Calculate the acceleration and decceleration at each time step by calculating gradiant of velocity.
- Calculating instantaneous energy and total braking energy.
- Use sprintf command to formatting the data into string for display. Sum command to add all the elements of braking energy.
- Displying the string.
- plotting the drive cycle and energy using plot command
Results :
The Total Braking Energy for the given drive cycle is
B = 11.6901 kJ
2. Why electric motor can’t develop braking torque at high speed similar to starting?
The electric motor can't develop braking torque at high speed similar to starting because once the electric supply is cutoff, it acts as a generator and due to the flux weakening effect generator, the generator produces low torque as expected. This condition is called forward braking condition.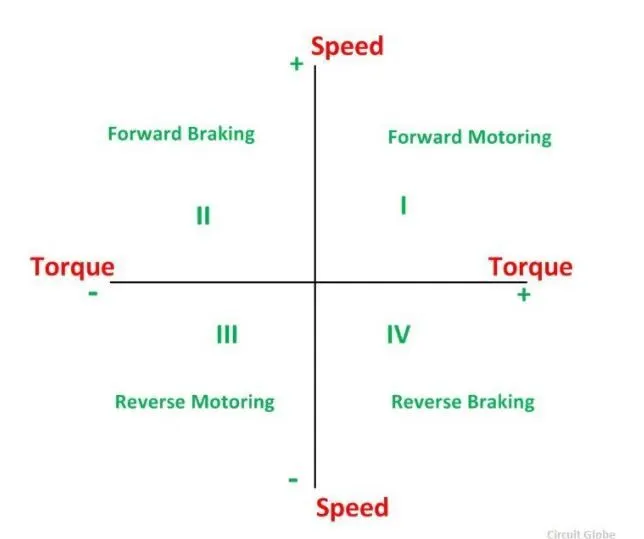
Regenerative Braking :
Regenrative braking is an energy recovery mechanism that slows down a moving vehicle or object by converting its kinetic energy into a form that can be either used immediately or stored until needed. In this mechanism, the electric traction motor uses the vehicle's momentum to recover energy that would otherwise be lost to the brake disc as heat. This contrasts with conventional braking systems where the excess kinetic energy is converted by using electric motors as generator but is immediatly dissipated as heat in resistors. In addition to improving the overall efficiency of the vehicle, regeneration can significantly extend the life of the braking system as the mechanical parts will not wear out very quickly.
The most common form of regenerative brake involves an electric generator. In electric railways, the electricity generated is fed back into the traction power supply. In battery electric and hybrid electric vehicles, the energy is stored chemically in a battery, electrically in a bank of capacitors or mechanically in a rotating flywheel. Hydraulic hybrid vehicles use hydaulic motors to store energy generated by the motor is used to break waste water down into oxygen and hydrogen which is recycled back into the fuel cell for later reuse.
How electric and mechanical brakes are coordinated?
In an electric motor, the Total Brake distribution is in two aspects which are electrical brake which is called Regenerative Brake, and mechanical Brake or classical brake with a hydraulic cylinderical system. Brake Force distribution must be uniform, if the regenerative braking power capacity of the machine we must apply mechnical brake as well. In a practical case, the combination of these two is applied. So usually it is a combined, that particular phenomenon are called brake control stratergies. There are two brake Conttrol Stratergies, which are Series - In case of series, we apply Mechanical brake and Regenerative electric brake one after another. We can apply only one brake stratergy at a time either apply regeneratively or apply mechanical brake. The series brake control stratergy has a further classification, that is based on whether we want the comfort of driver or Brake behaviour compared to energy effciency. In Parallel braking, we apply both brakes simultanously. The Particular Parallel braking is going to happen both at a time. Electric Driven Inteligent Brake (EDIB) is a combination of Hydraublic brake or Mechanical brake along with a Regenerative brake. It is Parallel braking technique. The control criteria such that at low speed use regenerative braking higher and at high speed or during the initial braking period we actually combine the both.
3. Make a MATLAB program which plots contour of given motor speed, torque and efficiency values. Attach the code as a .m file attach a screenshot of all the plots.
To plot contour lines for a given motor. A motor have various types of losses as mentioned below.
1. Copper Losses -
I^2R, where R is armature resistance. As torque is proportional to current, this copper loss can be considered as function of torque to take care of resistance of brushes and also take care of us and its effect.
Copper Loss = Kc x T^2
2. Iron Losses -
Iron Losses are nothing but magnetic losses. For permanent magnets have constant magnetic field and iron losses depend on the value of back EMF that changes with the angular velocity of the motor.
Iron Loss = Ki x w
3. Windage Losses -
This is mechanical or friction windage losses. this is based on size and shape of motor and amount of windage losses that the motor is going to experience.
Windage Loss = Kw x w^3
4. Constant Losses -
Denoted by c is determined by the experimental procedure
Total Losses -
The Total losses are the sum of all four losses,
Total Losses = Kc x T^2 + Ki x w + Kw x w^3 + c
MATLAB Code to calculate losses -
clear all
close all
clc


% Torque and Velocity range of the motor
Torque = linspace(0,250);
Vel = linspace(0,1500);

% Copper Loss Constant
Kc = 0.2;

% Iron loss constant
Ki = 0.008;

% Windage Loss constant
Kw = 0.00001;

% Constant motor loss
c = 20;

% Creating 2D Array for torque & velocity
[W,T] = meshgrid(Vel,Torque);
output_power = (W.*T);

% Loss Calculation
cu_l = Kc*(T.^2);        % Copper Loss
Fe_l = Ki.*(W);          % iron Loss
Windage_l = Kw*(W.^3);   % Windage Loss

% Power and Efficiency calculations
Input_power = output_power + cu_l + Fe_l + Windage_l + c;
Efficiency = output_power./Input_power;

% Efficinecy curve value range
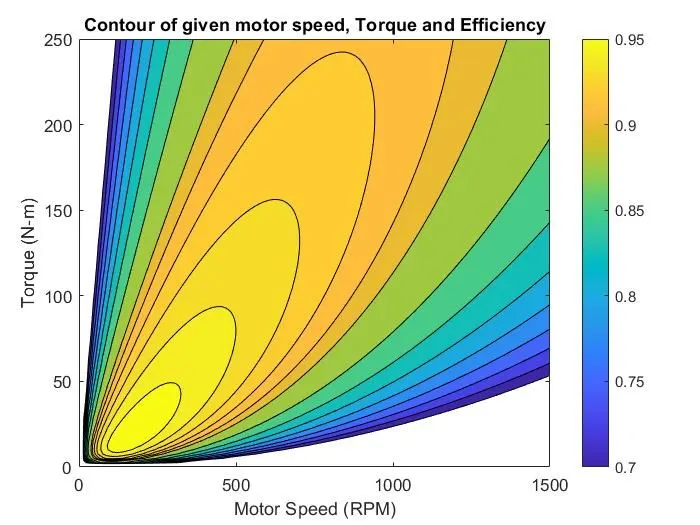
V = [0.70,0.725,0.75,0.775,0.80,0.825,0.85,0.875,0.90,0.91,0.920,0.93,0.94,0.95]

% Plotting the contour for Speed Torque and Efficiency
box off
grid off
contourf(W,T,Efficiency,V);
colorbar
xlabel ('Motor Speed (RPM)');
ylabel ('Torque (N-m)');
zlabel ('Efficiency');
title ('Contour of given motor speed, Torque and Efficiency')
Explaination -
- Create motor speed and torque array
- Input the values of losses constant
- Create meshgrid of motor speed and torque
- Calculate the total loss based on the above equations
- Calculate input power and input power to get the motor efficiency.
- Create an array for mapping the range of efficiency.
- Plot the contour with colorbar and label the plot
Result -
Google drive link -
https://drive.google.com/drive/folders/1_9kQNaOHgWtSadfSrtRkIHOflTmtL4Ov?usp=sharing