Project 1 - Parsing NASA thermodynamic data
Aim -
- - Write a function that extracts the 14 co-efficients and calculates the enthalpy, entropy and specific heat of all the specices given in the data file.
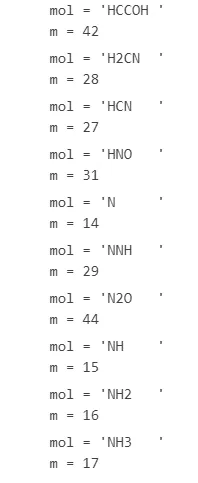
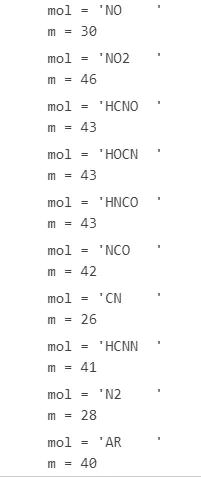
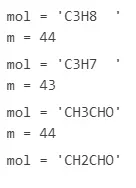
- - Calculate the molecular weight of each species and display it in command window.
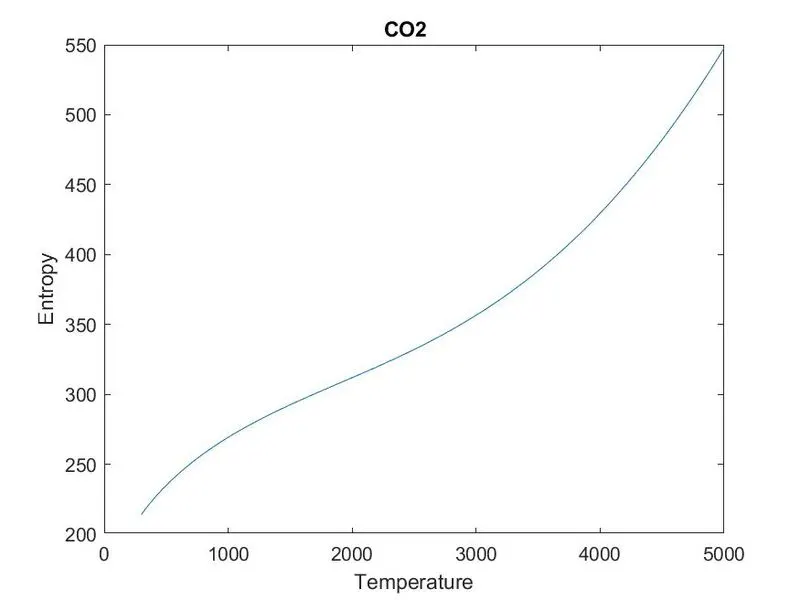
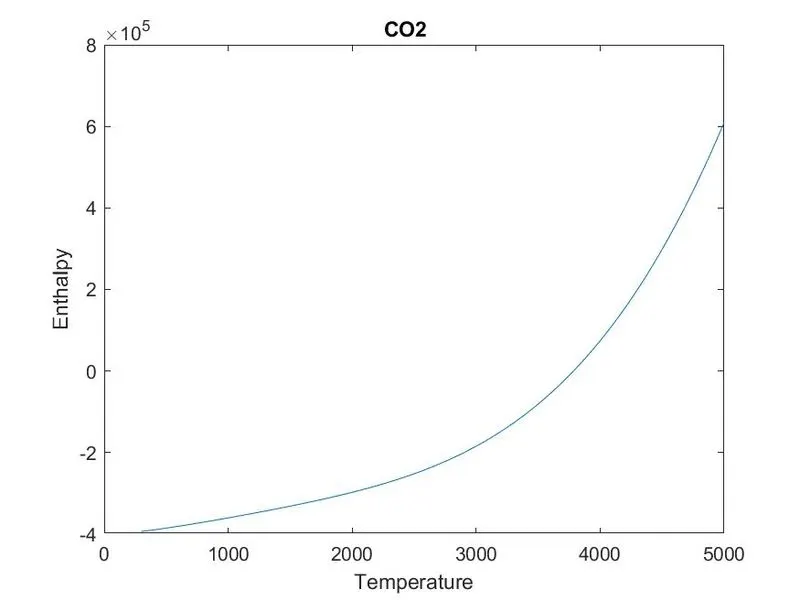
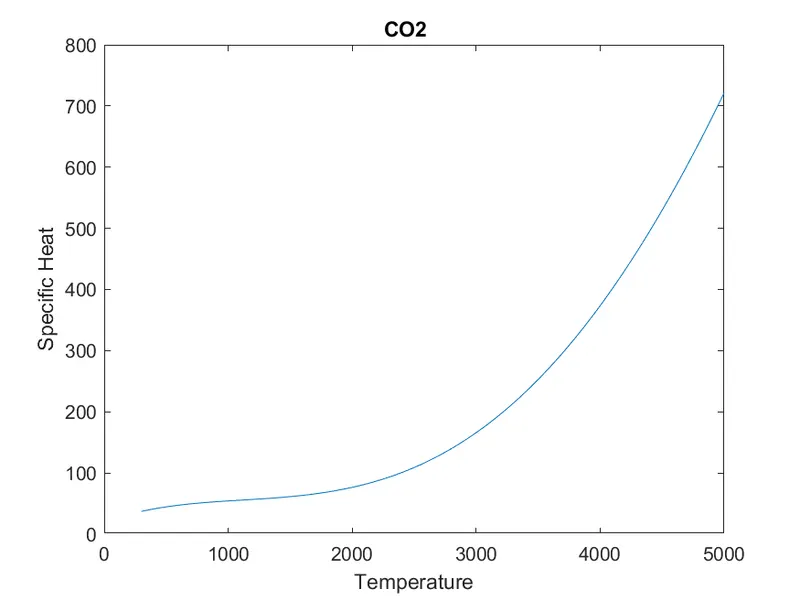
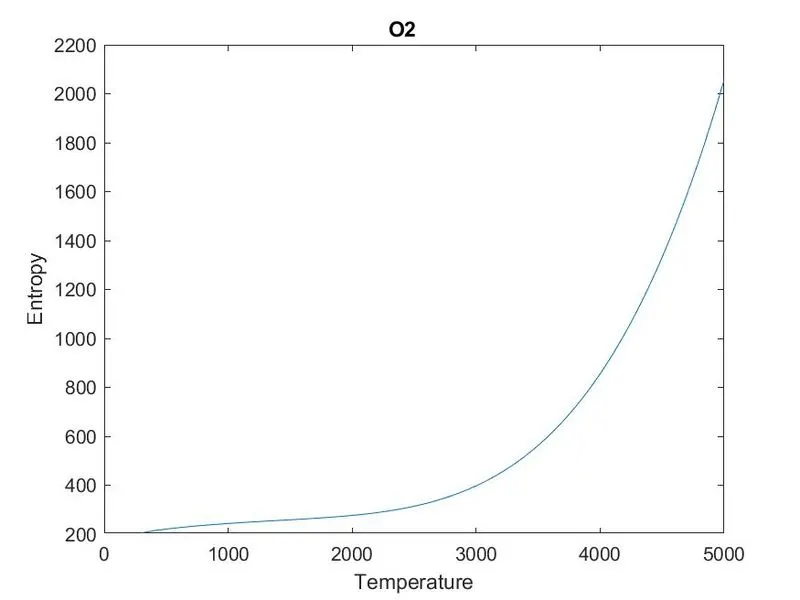
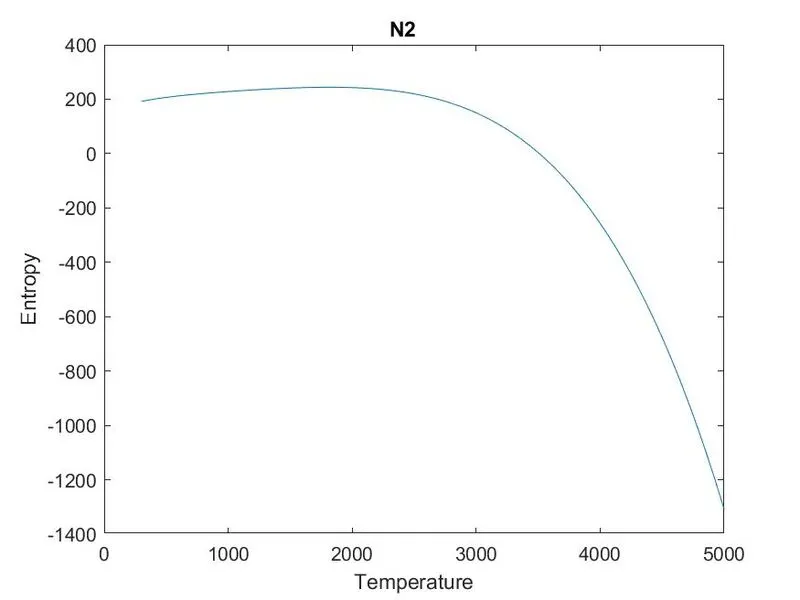
- - Plot the specific heat, enthalpy and entropy for each species corresponding to the local temperature range.
Methodology -
File parsing is the process to analyze string of words into its constitutation.. The purpose of file parsing is to extract the useful data from the data provided which is easy to manipulate and stored.
This project deals with extracting NASA's thermodynamic data which contains coefficient of the polynomial to calculate specific heat ,entropy and enthalpy. There are 14 polynomial coefficients for each of the 53 species, these polynomials will be used to get global termperature and local temperature using following formula.
Cp/R = a1 + a2xT + a3xT^2 + a4xT^3 + a5xT^4
H/RT = a1 + a2xT/2 + a3xT^2/3 + a4xT^3/4 + a5xT^4/5 + a6/6
S/R = a1xln(T) + a2xT + a3xT^2/2 + a4xT^3/3 + a5xT^4/4 + a7
Where,
R = Universal gas constant (J/mol.K)
T = Temperature (K)
Cp = Specific Heat (J/kg.K)
H = Enthalpy (J)
S = Entropy (J/K)
Code -
clear all
close all
clc

% Extract Thermo Data from data file
data = fopen("THERMO.dat",'r');


% Read header
header = fgetl(data);

% Read temperature
temp_str = fgetl(data);
temp_num = str2num(temp_str);       % Convert string to numeric
low_temp = temp_num(1);
mid_temp = temp_num(2);
high_temp = temp_num(3);

% Skipping unnecessary lines
fgetl(data);
fgetl(data);
fgetl(data);

% Universal gas constant R (J/mol.k)
R = 8.314

% Define Temperature Range
t = linspace(low_temp,high_temp,500);
% For Loop to get values of coefficients
for i = 1:53
    mol_name = fgetl(data);
    mol = mol_name(1:6)
    l1_str = fgetl(data);
    l1 = strfind(l1_str,'E');
    a1 = str2num(l1_str(1 : l1(1)+3));
    a2 = str2num(l1_str(l1(1)+4 : l1(2)+3));
    a3 = str2num(l1_str(l1(2)+4 : l1(3)+3));
    a4 = str2num(l1_str(l1(3)+4 : l1(4)+3));
    a5 = str2num(l1_str(l1(4)+4 : l1(5)+3));
    l2_str = fgetl(data);
    a6 = str2num(l2_str(1 : l1(1)+3));
    a7 = str2num(l2_str(l1(1)+4 : l1(2)+3));
    a8 = str2num(l2_str(l1(2)+4 : l1(3)+3));
    a9 = str2num(l2_str(l1(3)+4 : l1(4)+3));
    a10 = str2num(l2_str(l1(4)+4 : l1(5)+3));
    l3_str = fgetl(data);
    a11 = str2num(l3_str(1 : l1(1)+3));
    a12 = str2num(l3_str(l1(1)+4 : l1(2)+3));
    a13 = str2num(l3_str(l1(2)+4 : l1(3)+3));
    a14 = str2num(l3_str(l1(3)+4 : l1(4)+3));

     % Using if-else loop to find Cp, H, S at different temperature
    if t < mid_temp
        Cp = R.*(a1 + a2.*t + a3.*(t.^2) + a4.*(t.^3) + a5.*(t.^4));
        H = R.*(a1.*t + a2.*(t.^2)/2 + a3.*(t.^3)/3 + a4.*(t.^4)/4 + a5.*(t.^5)/5 + a6);
        S = R.*(a1.*log(t) + a2.*t + a3.*(t.^2)/2 + a4.*(t.^3)/3 + a5.*(t.^4)/4 + a7);
    else
        Cp = R.*(a8 + a9.*t + a10.*(t.^2) + a11.*(t.^3) + a12.*(t.^4));
        H = R.*(a8.*t + a9.*(t.^2)/2 + a10.*(t.^3)/3 + a11.*(t.^4)/4 + a12.*(t.^5)/5 + a13);
        S = R.*(a8.*log(t) + a9.*t + a10.*(t.^2)/2 + a11.*(t.^3)/3 + a12.*(t.^4)/4 + a14);
    end

   % Creating directory
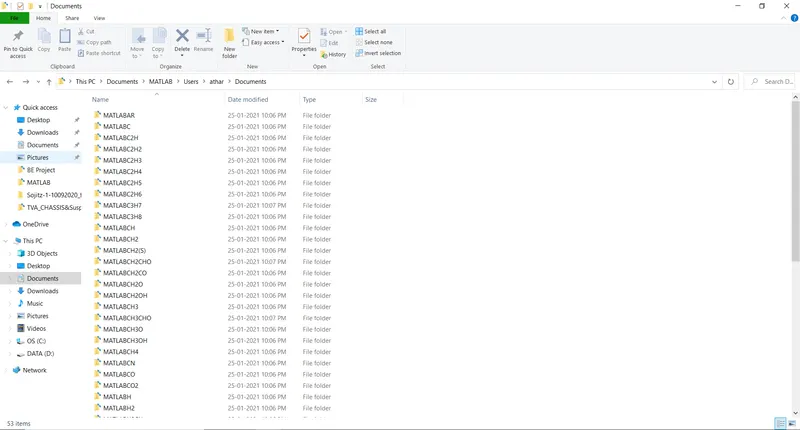
   mkdir(['C:Users\athar\Documents\MATLAB',mol]);

   % Plotting Temperature vs Specific heat
   figure (1)
   plot(t,Cp)
   xlabel('Temperature')
   ylabel('Specific Heat')
   title(mol)

   %  Plotting Temperaturre vs Enthalpy
   figure(2)
   plot(t,H)
   xlabel('Temperature')
   ylabel('Enthalpy')
   title(mol)

   % Plotting temperature vs Entropy
   figure(3)
   plot(t,S)
   xlabel('Temperature')
   ylabel('Entropy')
   title(mol)

   dir = ['C:Users\athar\Documents\MATLAB',mol];
   cd(dir);


   % Saving Figures in jpg
   saveas(figure(1),'Specific heat.jpg')
   saveas(figure(2),'Enthalpy.jpg')
   saveas(figure(3),'Entropy.jpg')
   cd('C:\Users\athar\Documents\MATLAB');


   % Calling function to find molecular weight
   m = molecular_mass(mol)
end
Explaination -
- Start with fopen command which takes file name and mode as it's parameter as read (r) mode and store under the variable name data.
- Read the header with fgetl command. fgetl command reads new line, if we use it again.
- Now read next line with fgetl command. This string line has temperature values. We convert it into numerical line by using str2num command.
- Store temperature values into variables low_temp, mid_temp, high_temp.
- Now read next three lines by fgetl, we don't need to store these into any variable because they are not useful.
- Assign the value of universal gas constant to variable R.
- Define temperature range using linspace command.
- For loop will run from 1 to 53 to extract data for all 53 species.
- Read next line and store it's first 6 characters under variable name mol, it will store species name.
- Read next line, store it under a variable and find E in the line using strfind command.
- Using proper indexing to store all coefficient values under variables a1 to a14 respectively and converting them into numerical values using str2num command.
- Apply if else statement to calculate Cp, H, S for different temperatures.
- Now mkdir command is used to create directory. It takes parent directory name as parameter.
- Use plot command to plot Cp, H, S vs temperature for each species.
- Now list the current directory with dir command and set remote directory with cd command.
- Use saveas command to save all the plots.
- Again set remote directory using cd.
- Call the function molecular_mass to calculate the molecular weight of each species.
- End the for loop.
Function molecular_mass code -
function  m = molecular_mass(mol)

atom = ['H';'C';'N';'O';'A';'S'];   % Element Name
mol_wt = [1 12 14 16 40 32];        % Atomic weight
m = 0;
% For loop to find molecular weight
for i = 1:length(mol)
    for j = 1:length(atom)
        if strcmp(mol(i),atom(j))
            m = m + mol_wt(j);
            p = j;
        end
    end
    n = str2num(mol(i));
    if n>1
        m = m + mol_wt(p)*(n-1);
    end
end
end
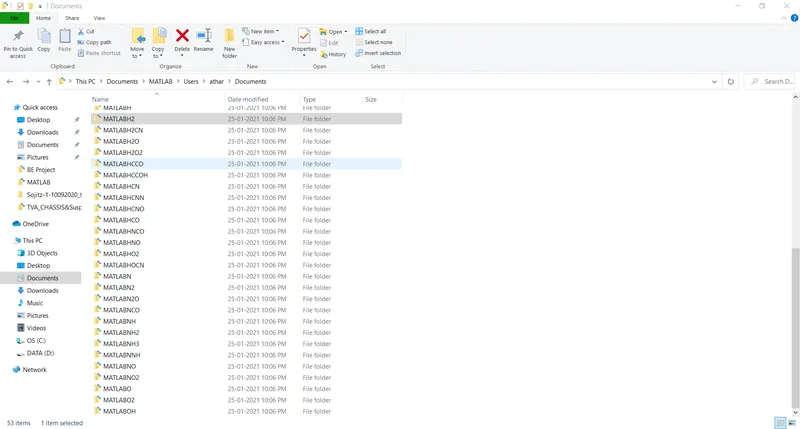
- Directory of saved folders
- Molecular Weight -
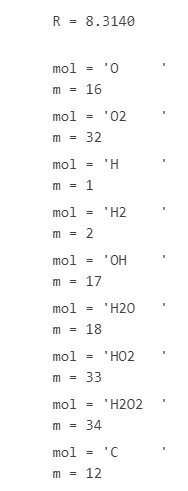
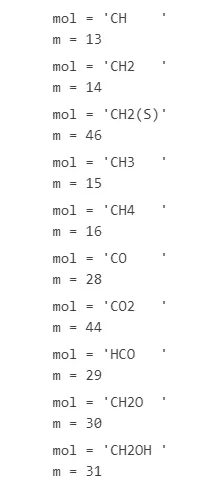
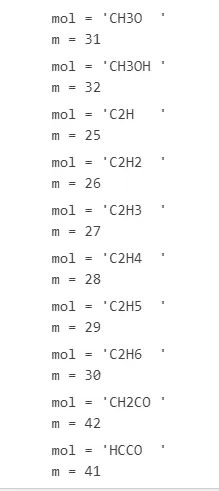
3. Plot for O2 -
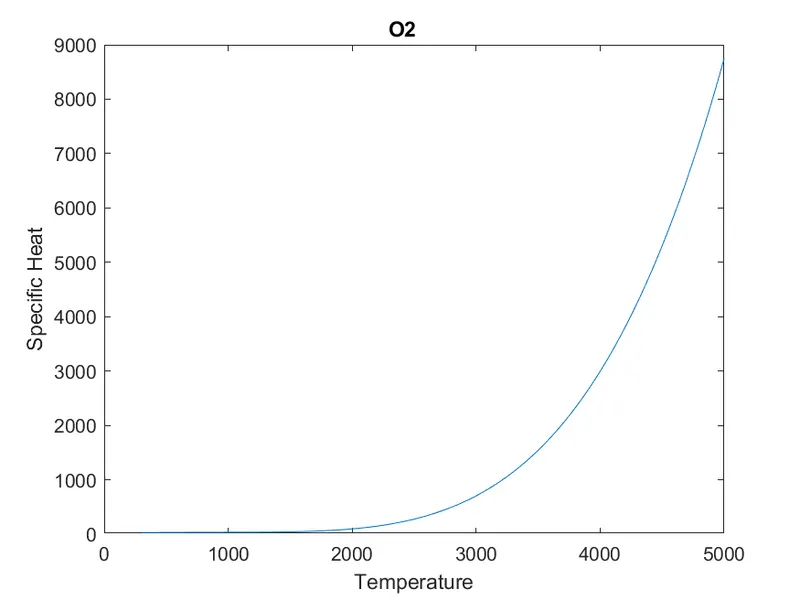
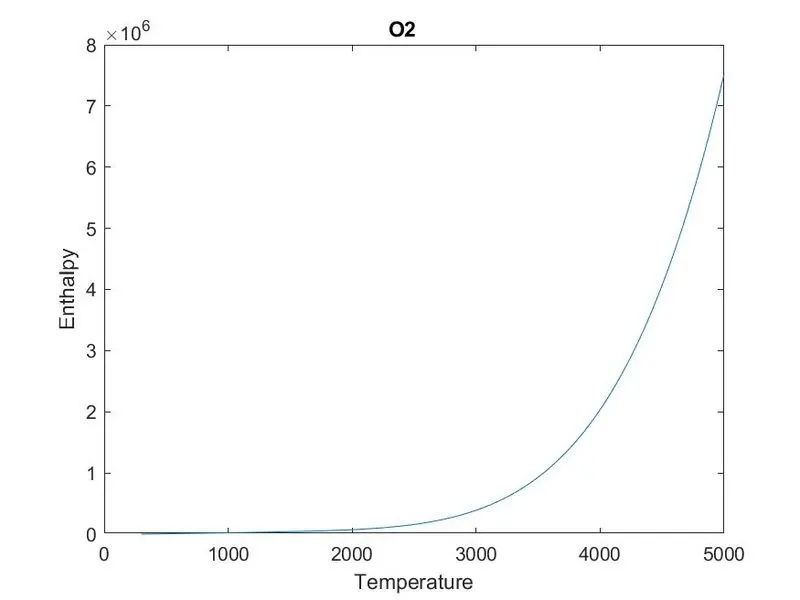
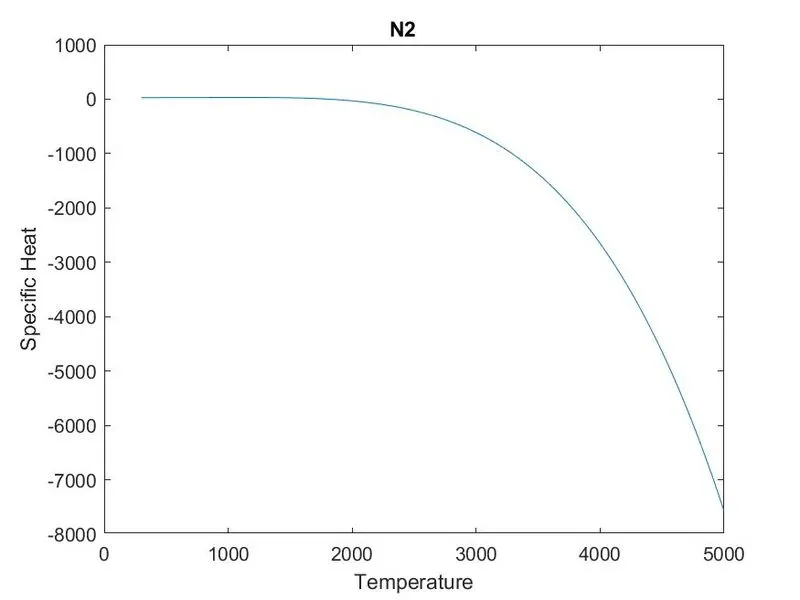
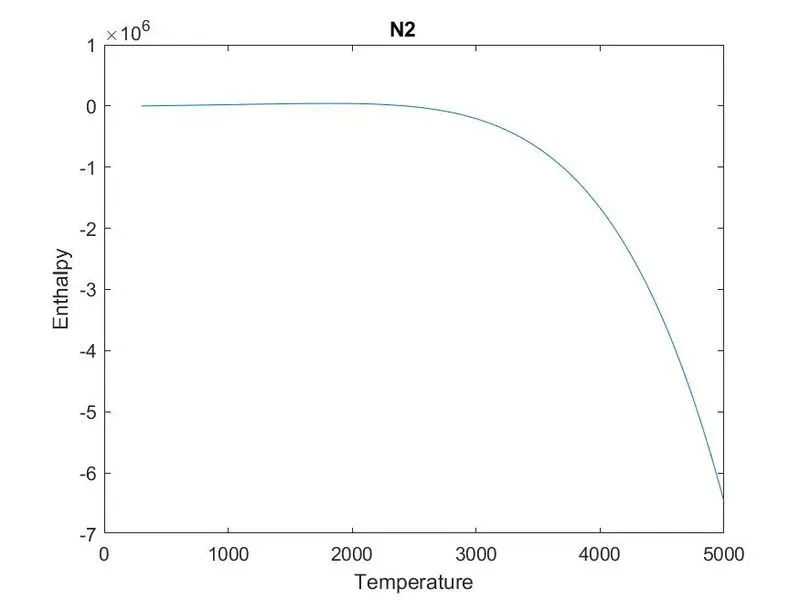
4. Plot for N2 -
5. Plot for CO2 -