Week-11 Challenge: Braking
WEEK 11 CHALLENGE – BRAKING
Questions:
- For a defined driving cycle, calculate the energy required for braking.
- Why electric motor can’t develop braking torque at high speed similar to starting? How electric and mechanical brakes are coordinated?
- Make a MATLAB program which plots contour of given motor speed, torque and efficiency values. Attach the code as a .m file attach a screenshot of all the plots.
Question 1: For a defined driving cycle, calculate the energy required for braking.
Explanation:
- The braking performance is one of the most important concerns in vehicle safety. In urban area driving, a significant amount of energy is consumed in braking.
- Electrification of vehicle makes it feasible to recover some of the energy lost in braking. A hybrid braking system was developed to ensure the efficient braking of vehicle and recovering the braking energy.
- The design and control objectives of such hybrid braking system is to ensure sufficient braking force to quickly reduce the vehicle speed, properly distributing the brake force to front and rear axle, and also to recover as much braking energy as possible.
- So, understanding of braking energy of a driving cycle is important.
GOVERNING EQUATION:
Braking Energy = 1/2 mv^2 kWh
Where,
m - Mass of vehicle (kg)
v - Velocity of vehicle (m/s)
MATLAB CODE:
mass = 1000; % mass of the vehicle in kg
t = drive_cycle(:,1); % time period
v = drive_cycle(:,2); % velocity data in m/s

for i = 1:(length(drive_cycle)-1)

    if v(i)>v(i+1)
        BE(i) = 0.5*mass*(v(i) - v(i+1))^2; % BE stands for brake energy
    end
end
fprintf('Total Brake Energy is %d',sum(BE))
fprintf('Average Brake Energy is %d',mean(BE))

% plotting the results
figure(1)
subplot(2,1,1)
plot(t,v,'linewidth',3,'color','g')
xlabel('Time(s)')
ylabel('Velocity(m/s)')
title('Drivecycle')

subplot(2,1,2)
plot(BE,'linewidth',3,'color','r')
xlabel('Time(s)')
ylabel('Braking Energy')
Code Explanation:
- Line 1: Initialize the mass
- Line 2&3: Time and Velocity values extracting.
- Line 4 to 9: For loop to get the initial and final speed of deceleration.
- Line 10 & 11: Printing the brake energy and average brake energy
- Line 12: Plotting the results
Drive Cycle excel file:
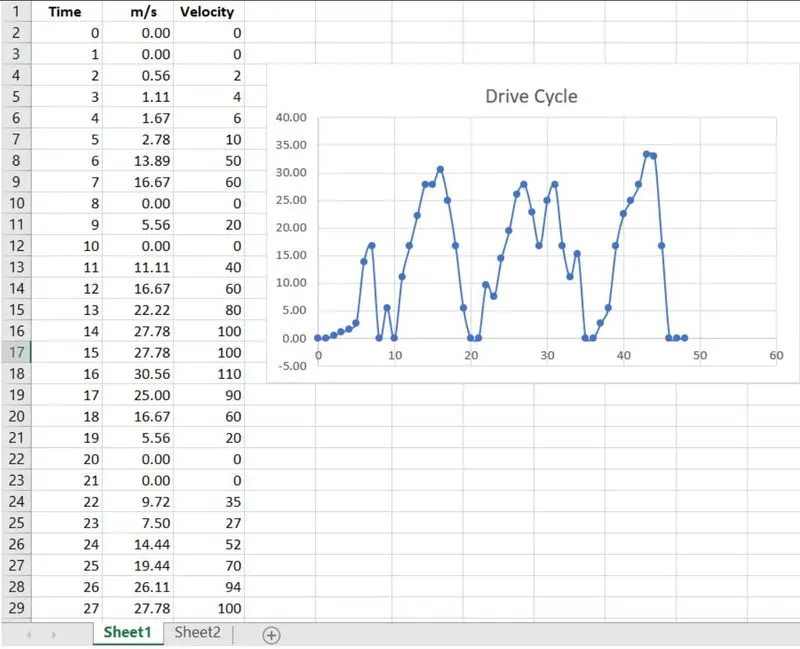
Table 1. Drive cycle
Results:
Command Window:
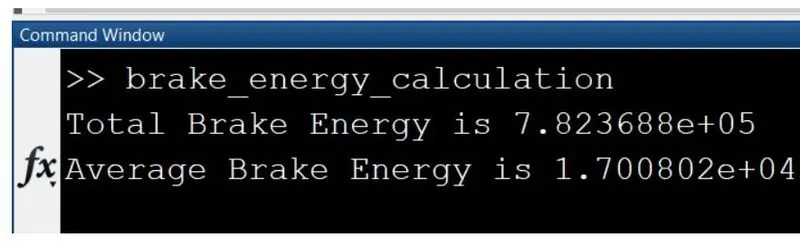
Fig.1.1 Command window results
Plot Results:
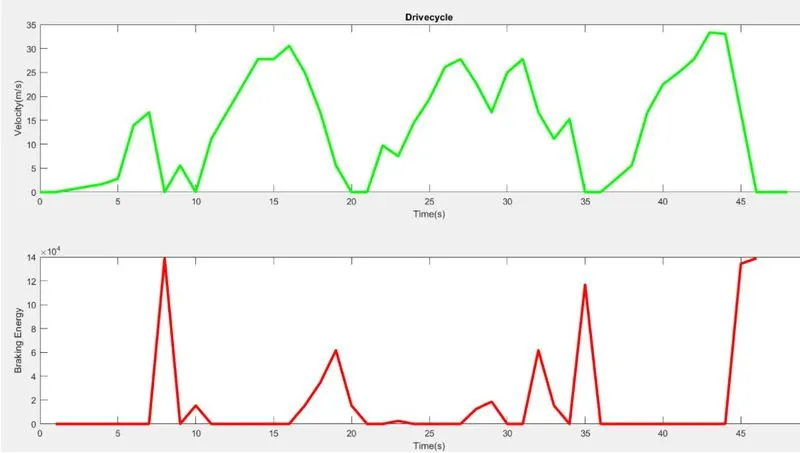
Fig.1.2 Plot Results
Question 2: Why electric motor can’t develop braking torque at high speed similar to starting? How electric and mechanical brakes are coordinated?
- The electric motor can't develop braking torque at high speed similar to starting because once the electric supply is pulled off from the motor, it acts as a generator and due to the flux weakening effect of the electric generator, the generator produces low torque as expected.
- The braking torque in a electric motor is not as high as that of the acceleration torque at higher speeds. This can be attributed to many different reasons. The rate of discharge of the battery is higher than the charging rate it can be said that the discharge rate can be twice as that rate of charging rate.
- There are other limitations to the motors in the form of power converters too. This power converter is customised 3 phase inverters which are bi directional as it needs to convert regenerative braking energy back to dc current for the battery and this reduces the efficiency of the power converter at low speeds regenerative braking is very high as speed increases.
- The regenerative braking reduces as the effectiveness of inverter plays an important role and the overall efficiency reduces resulting in reduced braking torque. Hence for effective braking at high speeds, we use a combination of hydraulic brake and regenerative brake.
- There are different ways of coordinating between the hydraulic brakes and regenerative brakes.one of the brake control strategies involves series connection where both brakes are connected together which implies that in this scenario both brakes are used together and the next one in the parallel connection where either of the two brakes is operated individually without relying on one another depending on the braking requirements.
Types of control strategy:
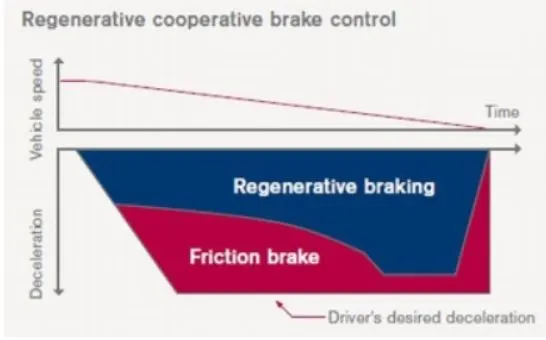
Fig.2.1 Control Strategy
Series:
The braking is applied one after the other. either of regenerative and mechanical braking is applied alternatively.
Parallel:
Both the brakes are applied. The regenerative and mechanical are applied in parallel.
when the brake pedal is applied it supplies the hydraulic fluid to the disc to slow the tires at the same time when the acceleration pedal is lifted a certain number of electric brakes are applied at high speed, since the braking force is required is a high large number of hydraulic brakes are applied and once the speed is reduced and the torque value is also high so the electric brakes become pre dominate so the battery charging occurs efficiently. The ECU system with feedback system to find the torque region and regenerative braking predominates in the high torque region.
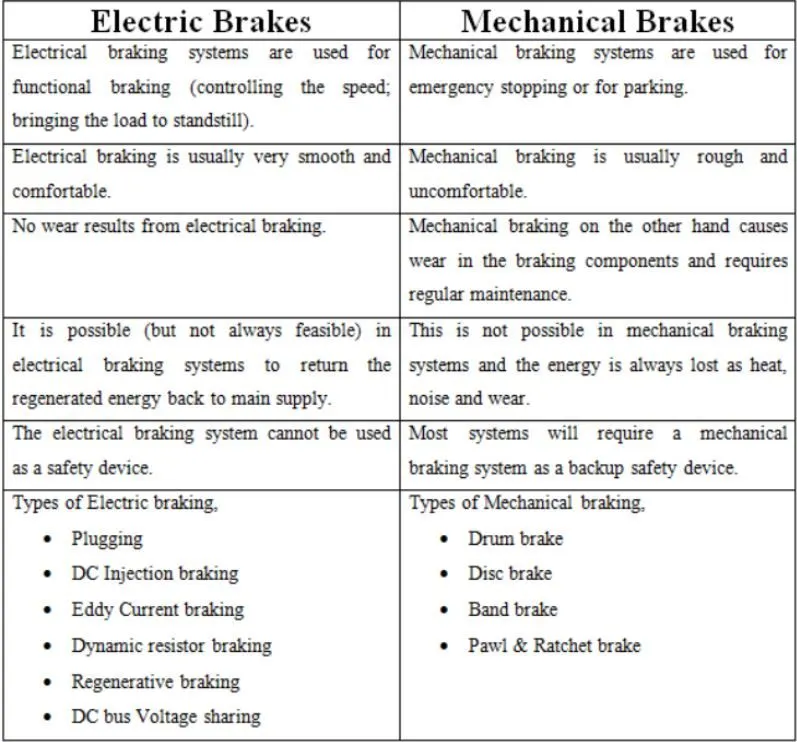
Table 2. Comparison of electric brakes and mechanical brakes
Question 3: Make a MATLAB program which plots contour of given motor speed, torque and efficiency values. Attach the code as a .m file attach a screenshot of all the plots.
Explanation:
A Motor have various types of losses happening inside. The various types of losses are:
Copper Losses - `I^2R` , where R is the Armature resistance and we say that Torque is proportional to Current, this copper loss can be consider as .where is to take care of resistance of brushes and also take care of ux and its effect.
Copper losses = `k_c*T^2`
Iron Losses - Iron Losses are nothing but Magnetic losses, which is denoted as , where factor is based on the Magnetic eld effect. For Permanent Magnets have constant Magnetic eld and this Iron losses is based on the value of and this are going to change according to the Speed. At Various Speed have different value of Back EMF and that is going to affect the Iron Losses.
Iron Losses = `k_i*omega`
Windage Losses - This is a Mechanical or friction of Windage losses. This is based on size of shape of Motor and the amount of windage losses that the motor is going to experience.
Windage Losses = `k_w*omega^3`
Constant Losses - This is denoted as C.
Total Losses - The Total Losses are considering the above four losses and denoted as,
Total Losses = `k_c*T^2 + k_i*omega + k_w*omega^3 + C`
All Motors are model as per the above equation of losses. This above equation is not only applicable for Permanent Magnet DC Motor, but other motors as well like induction motor.
MATLAB program for calculating the losses of the EV motor:
close all;
clear all;
clc;
Velocity = linspace(1,1000);               % speed in rad/s
Torque = linspace(1,250);                  % Torque in Nm 0 to 40 Nm
t=linspace(-1,-250);
[X,y]=meshgrid(Velocity,t);
kc =0.2;                                   % kc - copper losses coefficient
ki = 0.008;                                % ki – iron losses coefficient
kw = 0.00001;                              % kw – windage losses coefficient
conL = 20;                                 % Constant motor losses

[X,Y] = meshgrid(Velocity,Torque);
Output_power_1 =(X.*Y);
Output_power_2=(X.*y);

Copper_losses = (Y.^2)*kc;
Iron_losses = X.*ki;
Windage_losses = (X.^3)*kw;

Input_power_1 = Output_power_1+Copper_losses+Iron_losses+Windage_losses+conL;
Input_power_2 = Output_power_2-Copper_losses-Iron_losses-Windage_losses-conL;
Efficiency_1  =  Output_power_1./Input_power_1;
Efficiency_2  =  Output_power_2./Input_power_2;
V = [0.7,0.75,0.8,0.85,0.875,0.9,0.91,0.92,0.93]; % Efficiency curves to be plotted

box off
grid off
contourf(X,Y,Efficiency_1,V);
hold on
contourf(X,y,Efficiency_2,V)
colorbar
xlabel('Rotor Speed (rpm)')
ylabel('Torque induced N.m')
zlabel('Efficiency')
title('Torque speed curve of induction motor with Efficiency values')
Contour Plot:
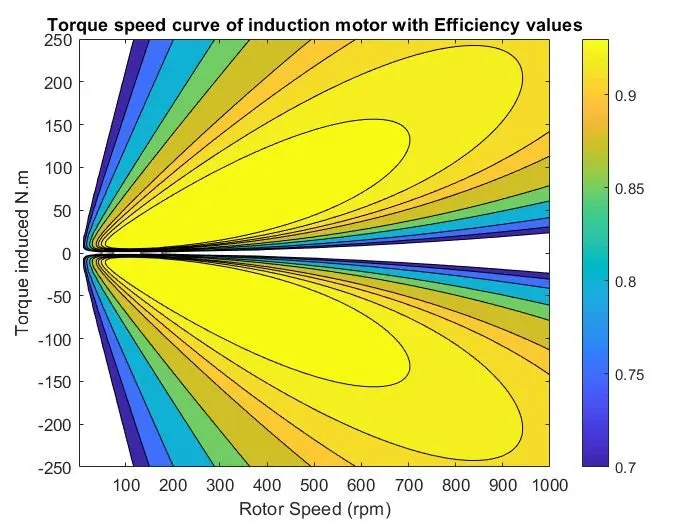
Fig.3.1 Contour Plot
Here the contours represent the group of efficiencies at certain characteristics of motor. The inner contour is having the highest efficiency.
References: