Project 1 - Parsing NASA thermodynamic data
FILE PARSING OF NASA THERMODYNAMIC DATA
AIM:
To study the NASA thermodynamic data file and calculate the dependence of different thermodynamic properties with respect to the temperature by using file parsing.
OBJECTIVE:
To write a function that extracts the 14 co-efficient and calculates the enthalpy, entropy and specific heats for all the species in the data file.
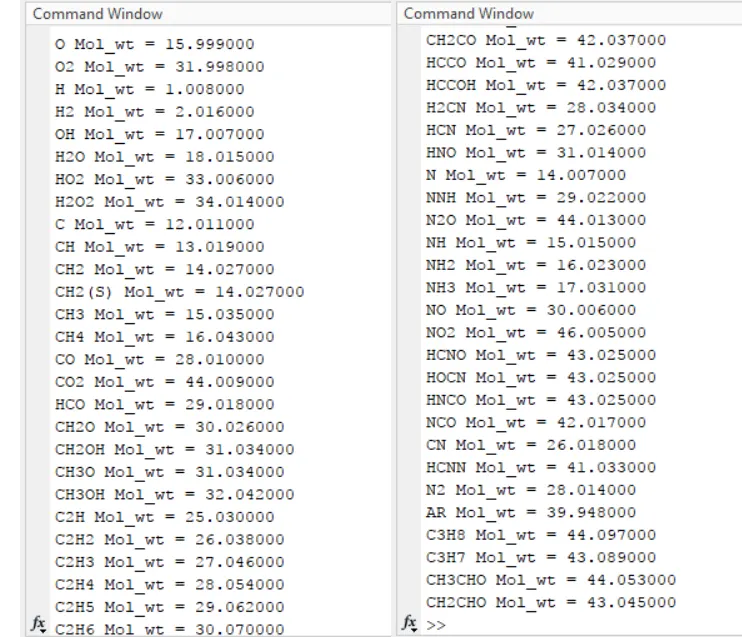
To calculate the molecular weight of each species and display that in the command window.
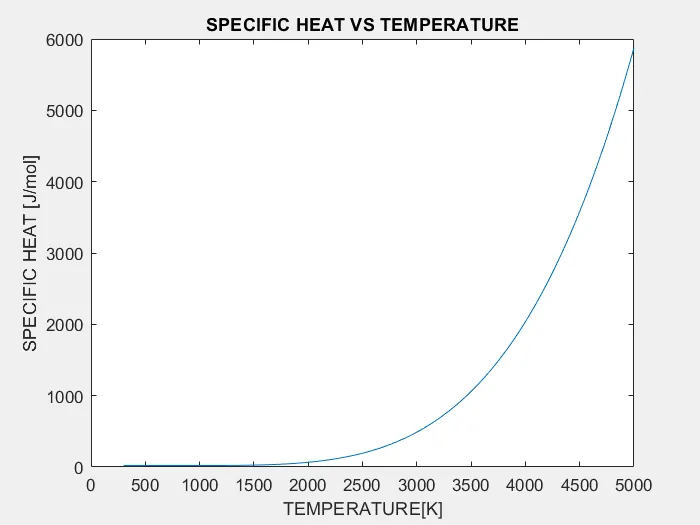
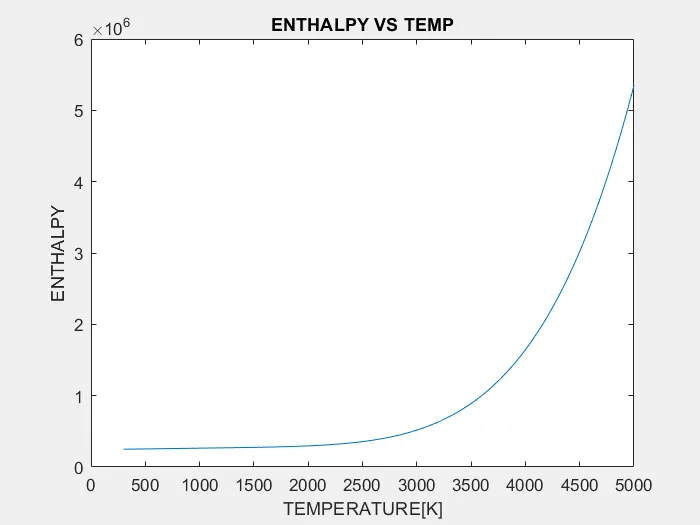
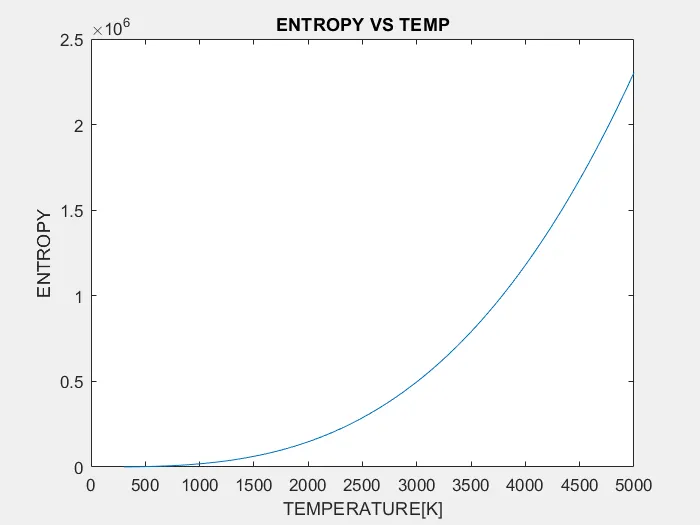
To plot the cp, enthalpy and entropy for the local temperature ranges.
To plot the given co-efficient cp, enthalpy, entropy.
INTRODUCTION:
Nasa has come up with the polynomials that have been used for evaluating the thermodynamic properties such as specific heat, enthalpy and entropy. The meaning of file parsing means to split the data which are present in the file that can be easily manipulated or stored according to the requirement.
In this project, the MATLAB has been used for the file parsing of the THERMO.dat NASA thermodynamic files. This file consists of the species name, local temperature ranges for the individual species, high temperature coefficients and lower temperature coefficients for individual species and global temperature range for all the species.
Below is the formula for calculating various thermodynamic properties:

The above formula we can use for high temperature coefficients and as well as for the low temperature coefficients and we can use the coefficients for high temperature range and the remaining seven are the low temperature ranges.
Here R is the universal gas constant (8.314 J/mol k)
CP – Specific heat, H – Enthalpy, S – Entropy
Where a1, a2, a3,a4,a5,a6,a7,a8,a9,a10,a11,a12,a13,a14 are the coefficients of each species.
The functions are assigned individually for calling in the main program to calculate the molecular weight.
SYNTAX USED:
Here the syntax used for given exercise
f1= fopen(‘THERMO.dat’,’r’) where syntax used for file name for thermo.dat file.
- fileID = fopen(filename, permission) here permission for access a file type.
- Fgetl – this syntax to get the first line of data.
- String split – split a character vector that contains comma separated values.
- Scan string – scan input string and convert to signals per specified format
- String compare – compare two input strings
- String concatenate- concatenate input strings to form one output string
- String constant – output specified string
- String find – return index of first occurrence of pattern string.
EXPLANATION OF MAIN PROGRAM:
- First of all we have to type clear all, close all, clc. The clear all command helps to clear the workspace. The close all command closes all figures and the clc command clears the command window.
- We have used the fopen command in reading mode to read the THERMO.dat file using syntax f1=fopen(‘THERMO.dat’,’r’)
- Now files are assigned as input data contained various species with different coefficients.
- Fgetl(f1) syntax is used for calling the first line of thermo data so that line are called for loop executed for skip the three lines.
- We want to split the coefficient by the numerical value so that string split syntax is used strsplit(line_1,’ ’)
- Global temperature low, mid ,high are also splited in the data.
- To separate each coefficient in species, find string command is usedcoeff=fgetl(f1); a=findstr(coeff,’E’);
- Applying this string finds the coefficient value. Then formula are assigns for calculating the next coefficient in same species a(1)=(1:12+3).
- A2=str2double(coeff(a(1)+4:a(2)+3)) now a(2) are calculated by this equation here str2double is refer as string2num that syntax separates the coefficient as numerical value.
- Same process is followed for 14 coeffs in species.
- Then open a loop for finding the values of all 53 elements to calculate the molecular weight.
- Functions are assigned in different tabs by using formula were given in challenges.
- Where R is the universal gas constant-8.314 J/mol k.
- In each function loop is present to determine the low temperature and high temperature of variable coefficients.
- Mid temperature is initiated in if, else loop function
- Functions are calling as same name for execute the main program calculation.
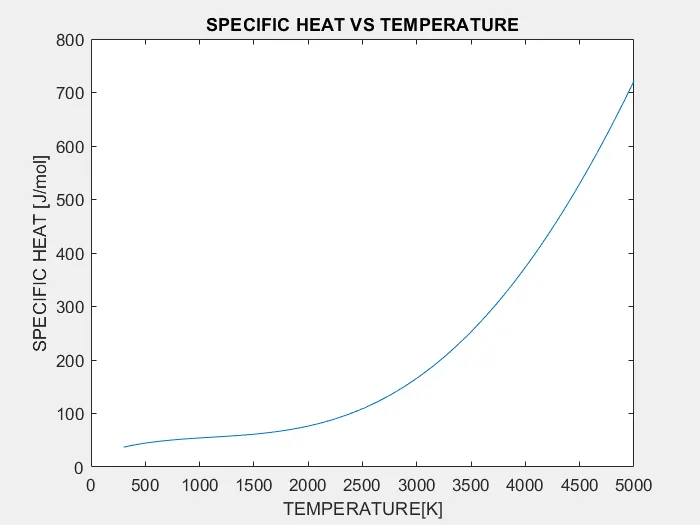
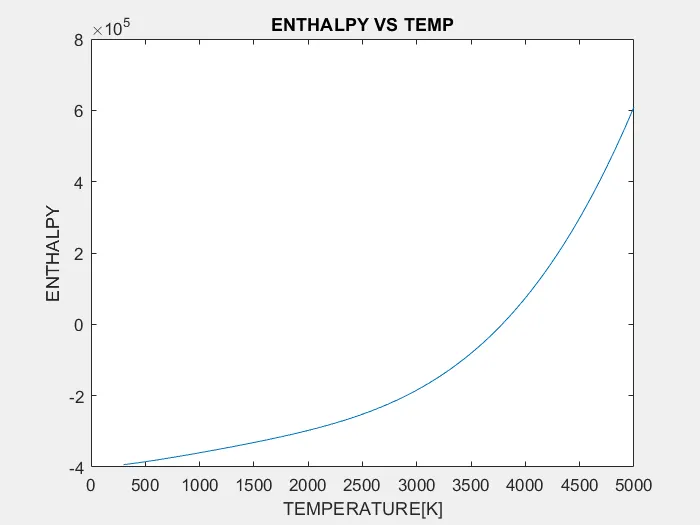
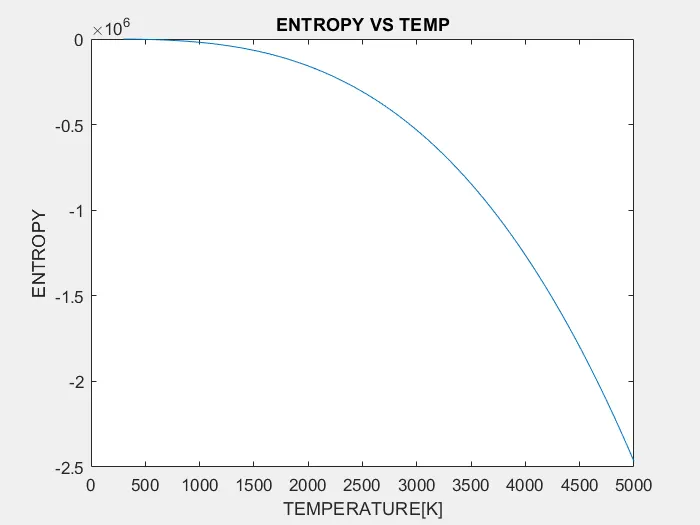
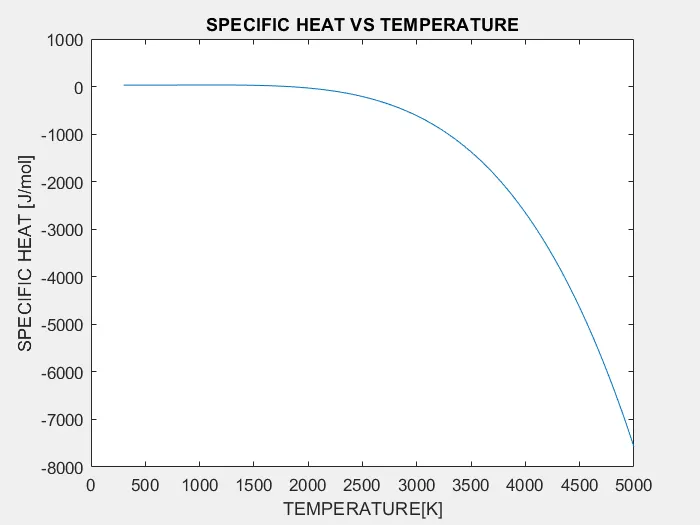
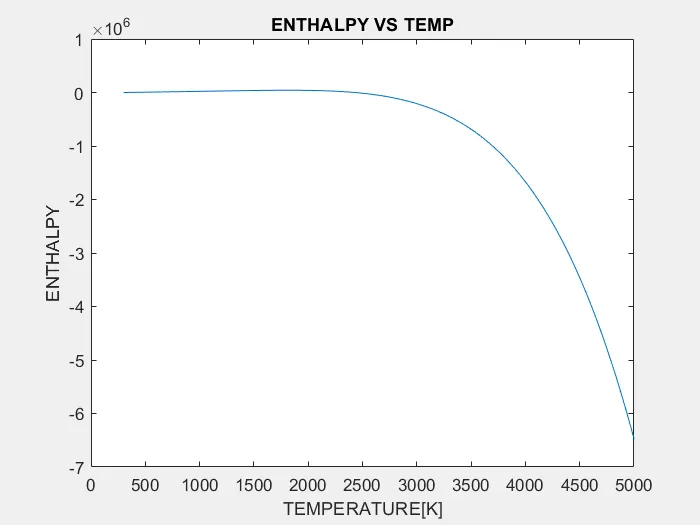
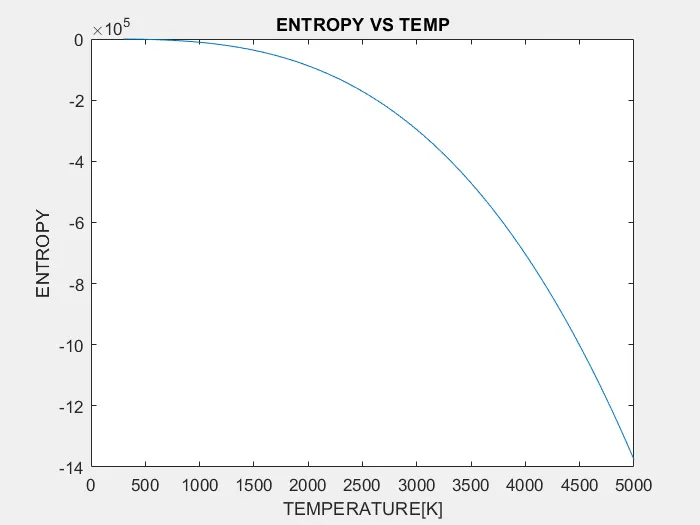
- Now plots are plotted and label as specific heat,enthalpy,entropy,and temperature.
- An required species are initiated req_species=[“O2”,”N2”,”CO2”]
- Image=getframe(gcf),imwrite(image.cdata,’cpvsT.png’) these command used to get the frame of image that obtain by in plot and imwrite command is used for save that image in folder.
- Molecular weight is calculated by using atomic mass and molecular weight of the each species.
- In next step calling the molecular function program calculate the molecular weight.
- By using the species and elements in the for loop and if condition and substitute the atomic values in the molecular weight formula.
- After finding the molecular weight return to the main program and display the molecular weight for the required species.
- Finally run the program to get the specific heat,enthalpy,entropy ,temperature plots.
FUNCTION CALLING PROGRAM:
SPECIFIC HEAT(C_P):
function[C_P]=specific_heat(a1,a2,a3,a4,a5,a6,a7,a8,a9,a10,a11,a12,a13,a14,low_temp,mid_temp,high_temp,T);
if(T>mid_temp)
   C_P = (a1+a2.*T+a3.*T.^2+a4.*T.^3+a5.*T.^4);
else
    C_P = (a8+a9.*T+a10.*T.^2+a11.*T.^3+a12*T.^4);
end
ENTHALPY(S):
function[H] = enthalpy_func(a1,a2,a3,a4,a5,a6,a7,a8,a9,a10,a11,a12,a13,a14,low_temp,mid_temp,high_temp,T)
if(T>mid_temp)
    H = (a1*T+(a2*(T.^2)/2)+(a3*(T.^3)/3)+(a4*(T.^4)/4)+(a5*(T.^5)/5)+a6);
else
    H = (a8*T+(a9*(T.^2)/2)+(a10*(T.^3)/3)+(a11*(T.^4)/4)+(a12*(T.^5)/5)+a13);
end
ENTROPY(H):
function[S] = entropy_func(a1,a2,a3,a4,a5,a6,a7,a8,a9,a10,a11,a12,a13,a14,low_temp,mid_temp,high_temp,T)

if(T>mid_temp)
    S = (a1*log(T)+(a2*T)+(a3*(T.^2)/2)+(a4*(T.^3)/3)+(a5*(T.^4)/4)+a7);
else
    S = (a8*log(T)+(a9*T)+(a10*(T.^3)/3)+(a12*(T.^4)/4)+a14);
end
MOLECULAR WEIGHT:
function [mol_wt] = molecular_weight(species_name)

Atomic_mass = [15.999,1.008,12.011,14.007,39.948];
Elements = ['O','H','C','N','A'];
mol_wt = 0;
z=0;
for i =1:length(species_name)
    for j = 1:length(Elements)
        if strcmpi(species_name(i),Elements(j))
            mol_wt = mol_wt + Atomic_mass(j);
            z=j;
        end
    end
    var = str2double(species_name(i));
    if(var>1)
        mol_wt = mol_wt + (Atomic_mass(z)*(var-1));
    end
end
M = mol_wt;
end
MAIN PROGRAM:
clear all
close all
clc
% Input data
% Read a data from the data file

f1 = fopen('THERMO.dat','r');

line_0 = fgetl(f1);
line_1 = fgetl(f1);
split = strsplit(line_1,' ');
low_temp = str2double(split{2});
mid_temp = str2double(split{3});
high_temp = str2double(split{4});

for i = 1:3
    data = fgetl(f1)
end

% For calculating the species
% for loop for total co-efficients

for i = 1:53
    line_2 = fgetl(f1);
     S = strsplit(line_2,' ');
     species_name = S{1};

     % Split the local temperature

     T = strfind(line_2,'G');
     temp_values = line_2(T+4:length(line_2));
     split_temp = strsplit(temp_values,' ');
     local_low_temp = str2double(split_temp{1});
     local_mid_temp = str2double(split_temp{2});
     local_high_temp = str2double(split_temp{3});

     coeff = fgetl(f1);
     a = findstr(coeff,'E');

     % Calculate the coefficient values
     %a(1)=(1:12+3)
     a1 = str2double(coeff(1:a(1)+3));
     a2 = str2double(coeff(a(1)+4:a(2)+3));
     a3 = str2double(coeff(a(2)+4:a(3)+3));
     a4 = str2double(coeff(a(3)+4:a(4)+3));
     a5 = str2double(coeff(a(4)+4:a(5)+3));

     % Co_efficient of 5 to 10

     coeff_1 = fgetl(f1);
     a = findstr(coeff_1,'E');

     a6 = str2double(coeff_1(1:a(1)+3));
     a7 = str2double(coeff_1(a(1)+4:a(2)+3));
     a8 = str2double(coeff_1(a(2)+4:a(3)+3));
     a9 = str2double(coeff_1(a(3)+4:a(4)+3));
     a10 = str2double(coeff_1(a(4)+4:a(5)+3));

      coeff_2 = fgetl(f1);
     a = findstr(coeff_2,'E');

     a11 = str2double(coeff_2(1:a(1)+3));
     a12 = str2double(coeff_2(a(1)+4:a(2)+3));
     a13= str2double(coeff_2(a(2)+4:a(3)+3));
     a14= str2double(coeff_2(a(3)+4:a(4)+3));

     r = 8.314;
     T = linspace(low_temp,high_temp,200)

    C_P = r*specific_heat(a1,a2,a3,a4,a5,a6,a7,a8,a9,a10,a11,a12,a13,a14,low_temp,mid_temp,high_temp,T);
     H = r*enthalpy_func(a1,a2,a3,a4,a5,a6,a7,a8,a9,a10,a11,a12,a13,a14,low_temp,mid_temp,high_temp,T);
     S = r*entropy_func(a1,a2,a3,a4,a5,a6,a7,a8,a9,a10,a11,a12,a13,a14,low_temp,mid_temp,high_temp,T);

     req_species = ["O2","N2","CO2"];
     if (species_name==req_species(1)||species_name==req_species(2)||species_name==req_species(3))
         mkdir(['C:',species_name])
         cd(species_name)

         % To plot specific heat vs temperature

         figure(1)
         plot(T,C_P)
         title('SPECIFIC HEAT VS TEMPERATURE')
         xlabel('TEMPERATURE[K]')
         ylabel('SPECIFIC HEAT [J/mol]')
         image = getframe(gcf);
         imwrite(image.cdata,'CPvsT.png')

         % To plot Enthalpy vs Temperature

         figure(2)
         plot(T,H)
         title('ENTHALPY VS TEMP')
         xlabel('TEMPERATURE[K]')
         ylabel('ENTHALPY')
         image = getframe(gcf);
         imwrite(image.cdata,'HvsT.png')

         % To plot Entropy vs Temperature

         figure(3)
         plot(T,S)
         title('ENTROPY VS TEMP')
         xlabel('TEMPERATURE[K]')
         ylabel('ENTROPY')
         image = getframe(gcf);
         imwrite(image.cdata,'SvsT.png')

     end
    MOLECULAR_WEIGHT = molecular_weight(species_name)

     K = sprintf('%s mol_wt = %f',species_name,MOLECULAR_WEIGHT)
     req_species = ["O2","N2","CO2"];
     if (species_name==req_species(1))||(species_name==req_species(2))||(species_name==req_species(3))
         disp(K)
     end
end
fclose(f1)
RESULTS: IMAGE 1 : Folder the species

Image 2: Molecular weight displayed in command window
Plots for O2: (1. SPECIFIC HEAT VS TEMPERATURE)
2.ENTHALPY VS TEMPERATURE:
3.ENTROPY VS TEMPERATURE:
PLOTS FOR CO2: (1. SPECIFIC HEAT VS TEMPERATURE)
2.ENTHALPY VS TEMPERATURE:
3.ENTROPY VS TEMPERATURE:
PLOTS FOR N2: 1. SPECIFIC HEAT VS TEMPERATURE
2.ENTHALPY VS TEMPERATURE:
3.ENTROPY VS TEMPERATURE:
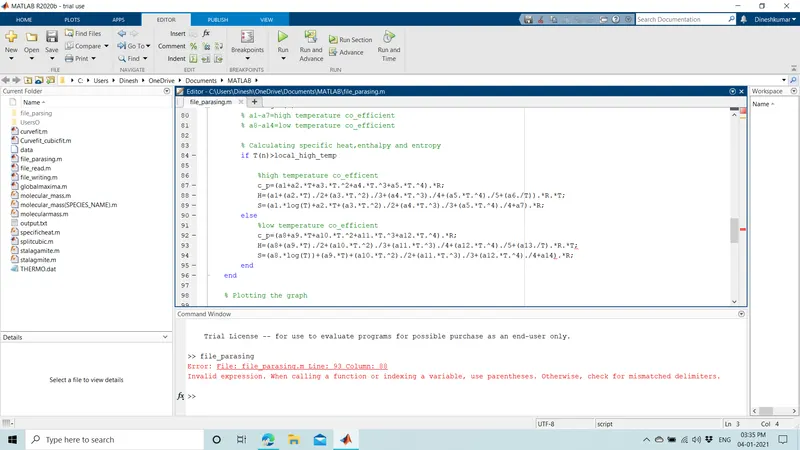
ERRORS ENCOUNTERED WHILE PROGRAMMING:
- Formula typing error.
CONCLUSION:
The results are obtained by running the program. File parsing is successfully done and the plots of 53 species are plotted and respective molecular weight are calculated.