Week-11 Challenge: Braking
1)For a defined driving cycle, calculate the energy required for braking.
Here the driving cycle is been created in excel file.
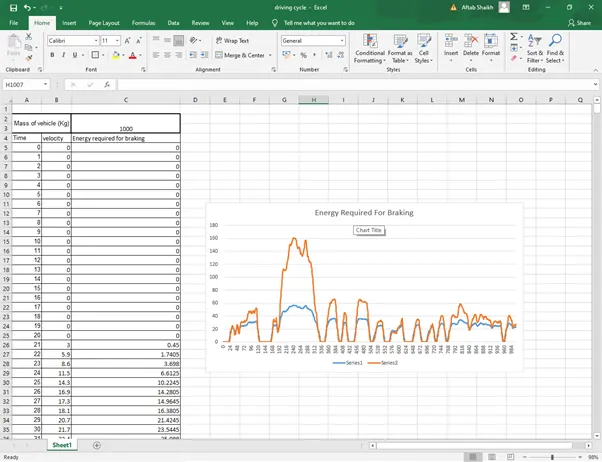
The data when plotted is as shown in below graph:-
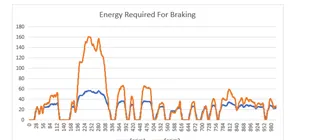
The blue line indicates the velocity of vehicle and the orange line indicate the energy required for braking.
The parameters taken here are :-
Mass of vehicle(m)= 1000kg
V= velocity of vehicle (kmph)
Formula for finding the brake energy-
The excel file is been attached below.
2) Why electric motor can’t develop braking torque at high speed similar to starting? How electric and mechanical brakes are coordinated?
When the motor is at rest with zero speed or rpm it has to develop a large amount of torque to reach its highest speed , during this the motor operates in constant torque region , once the required speed is obtained the region of the motor shifts to constant power region.
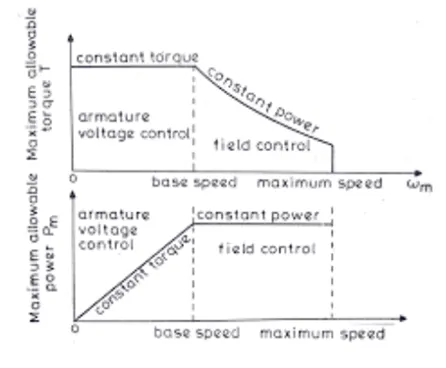
While during braking the similar graph is been mirrored while braking , during braking the vehicle is already at high speed at capping speed or the limit is reached by the motor operation and any further higher torque could not be obtained while braking.
Let consider , the motor which is producing 7 Nm torque for acceleration can not produce same 7Nm of torque during braking , because we are operating in field weakening region and operating above base speed . thus peak acceleration torque is grater than the peak acceleration torque . Thus for acceleration it has higher torque with low speed and for deacceleration it has low torque for high speed.
The coordination of electric and mechanical brakes are done in following manner:-
Generally there are 2 main types of brakes they are Regenerative and Mechanical brakes the brake force distribution is generally done is this both. The regenerative brake are nothing but the application of electric brakes which convert the kinetic or frictional energy during braking into electric energy which is feed back to the battery. And the mechanical brakes are conventional brakes which uses a drum or a disc mechanism for applying the brakes.
The brakes are further divided on the basis of Brake control strategies :-
- Series
- Parallel
In series brakes the brakes are applied one after the otherit may be regenerative first and the mechanical or vice versa , the are applied only one ay a time we use such type of brake control strategies where we are required for comfortable and efficient braking.
In parallel braking strategy both the brakes are applied at a time.
As per the system developed by Nissan leaf Electric Driven Intelligent Brake (EDIB) the below graphs are been shown where the coordination of brake system is been plotted ,
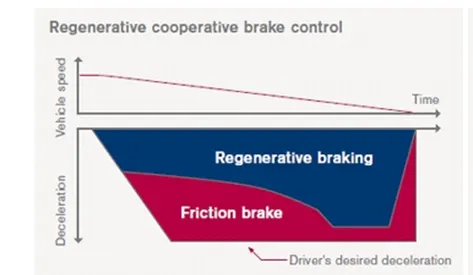
As from the graph its clear that at high speed of vehicle the percentage of frictional brakes or mechanical brakes are ap[plied is higher as compared to regenerative brakes but as the speed of vehicle is decreasing the percentage of brake ratio is changing and the regenerative brake are applied in greater ratio as compared to mechanical brakes.
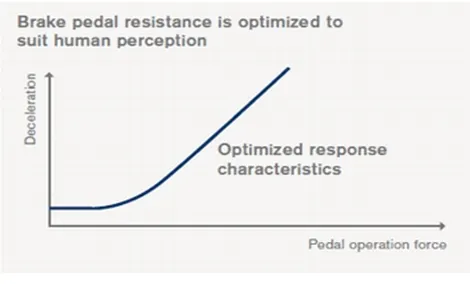
In the above graph of brake pedal resistance we can see that as the brake operation force is increased the rate of deacceleration is also increased. The percentage of ratio of regenerative and friction braking is decided by the position of brake pedal.
3) Make a MATLAB program which plots contour of given motor speed, torque and efficiency values. Attach the code as a .m file attach a screenshot of all the plots.
The matlab program for plotting the contour of given motor speed is been generated as below-
clc
clear all
close all
%Program for efficiency contour plot
w=linspace(0,1300); %Motor Speed(rad/sec)
T=linspace(0,250);  %Torque(Nm)
kc=0.3;      %Copper loss constant
ki=0.008;     %Iron loss constant
kw=0.00001;   %Windage loss constant
c=5;         %Constant
[x,y]=meshgrid(w,T);
output_power= (x.*y);    %Power = speed * torque
cu=kc.*(y.^2);           %Copper loss= kc*torque^2
I=ki.*x;                 %Iron loss= speed*ki
w=kw.*(x.^3);            %Windage loss= kw*speed^3
input_power=output_power+cu+I+w+c; %Input power= Output power+Losses
z=output_power./input_power; %Efficiency
%Mapping of efficiency point
v=[0.70,0.80,0.90,0.91,0.92,0.93];
contourf(x,y,z,v)
colorbar
grid on;
title("Speed-Torque-Efficiency characteristic of Motor");
xlabel("speed(rad/sec)");
ylabel("torque(Nm)");
here in above code,
the two array are been created for speed and torque by using linspace command
the constant values/ parameter are been defined
the meshgrid is been created to create a 2 dimensional and 3 dimensional mesh surface.
The output power is been calculated
After this the input power is calculated and finally from this the efficiency is been calculated
Finally the code is been written for giving x-label, y-label, title ,etc.
After running the code the results obtained are as shown in below fig-
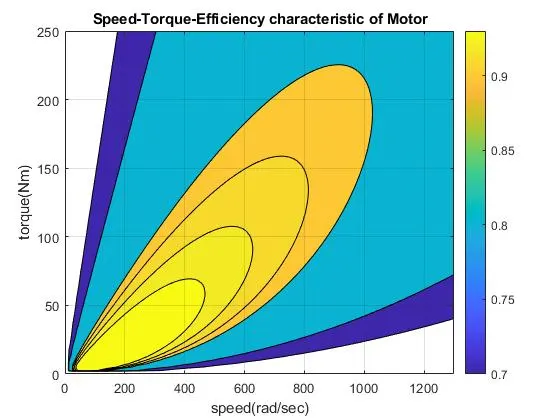
i have atteached the matlab file pls go through it.