Understanding Braking in Electrical Vehicles
1. For a defined driving cycle, calculate the energy required for braking.
To calculate the braking energy, the equation used is 1/2*m*V^2, where m takes into consideration the inertia effect, m = 1000kg and V is the difference in velocity, V=Vf-Vi.
To calculate the energy, it is necessary to consider retardation processes in the cycle. A sample driving cycle is taken to solve the energy braking problem.
Calculation of braking energy for a sample driving cycle
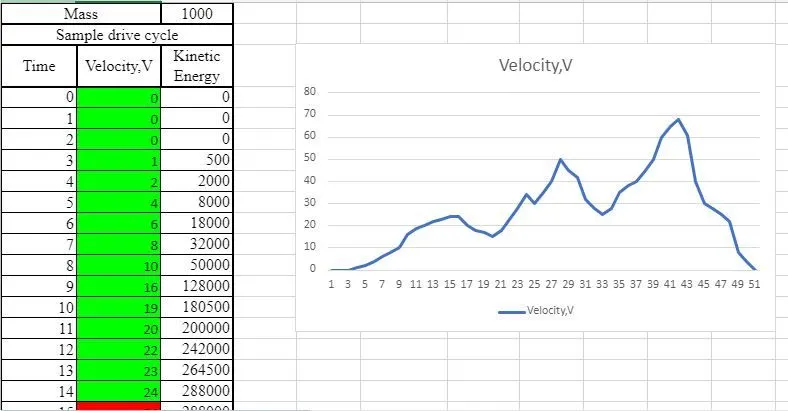
The above image shows us the drive cycle graphically. Below are the calculations for braking energy.
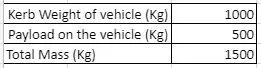
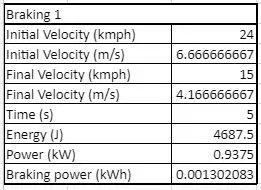
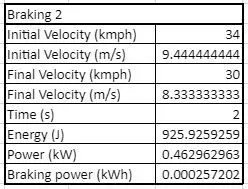
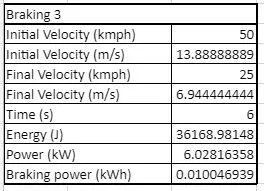
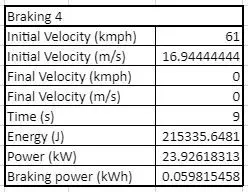

Hence, the required total energy for braking is 0.071422kWh or 257.119kJ.
2. Why electric motor can’t develop braking torque at a high speed similar to starting? How electric and mechanical brakes are coordinated?
In DC motors when the load on the motor is constant, the speed of the motor is proportional to supply voltage. When the supply voltage is constant, speed is inversely proportional to the load on the motor.
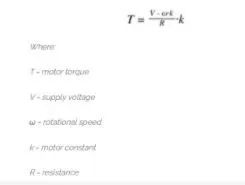
Any increase in load torque on the motor will cause a decrease in the motor speed which can be inferred from the relationship: T=(V-w*k/R)*k
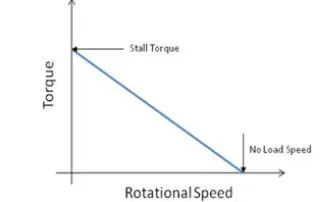
The torque-speed curve begins at the crossing of the Y-axis, where the value torque is at peak and motor speed is zero. This torque is called stall torque or the maximum value of torque when the motor is running at nominal voltage. The characteristics have a negative slope and intersect the X-axis where there is zero torque and attain a maximum speed. This point is known as the no-load speed - the speed when running at nominal voltage and zero loads.
In mechanical braking which we usually see and experience in all vehicles, the brake pedal in the vehicle cabin helps us to engage or disengage the brakes. Currently, the braking technology has done wonders by inventing life-saving technologies such as ABS, EBD, BA, and many others. All these technologies play a vital role in stopping the vehicle and coming back to rest from a high speed. In all these vehicles when the driver applies brakes, the brake pedals come closer to the disc connected with the driving disc. The brake pads usually help in efficient braking. There are two generic methods by which the vehicle could be braked in electric brakes.
Series - The regenerative braking or the mechanical braking both are applied one after another.
Parallel - Regenerative braking or mechanical braking both are applied in parallel.
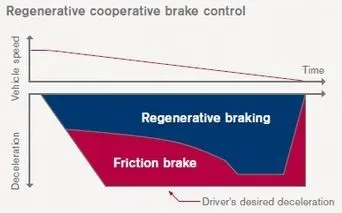
When the brake pedal is pressed, the hydraulic fluid reaches the brake piston and creates a braking pressure on the wheels and the same kinetic energy is used by the regenerative braking for generating more power using the bi-directional motor which operates as a generator while braking.
An example of the proposition of regenerative braking and mechanical braking is explained below.
NISSAN LEAD - EDIB (ELECTRONIC DRIVEN INTELLIGENT BRAKING)
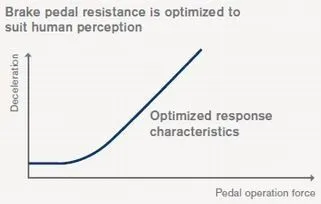
EDIB controls the regenerative brake and friction brake to support both of these requirements. Further, it also controls the reactive force from the pedal to unify the feeling when stepping down on the pedal and the sense of deceleration.
3. Make a MATLAB program that plots the contour of given motor speed, torque, and efficiency values. Attach the code as a .m file attach a screenshot of all the plots.
The program is shown below.
%To write a program that plots a contour of given motor speed, torque and
%efficiency values
close all
clear all
clc

%Speed array
w=linspace(1,1000);
%Torque array
T=linspace(1,300);

%Loss coefficients
Kc=0.18; %Copper loss coefficient
Ki=0.006; %Iron loss coefficient
Kw=0.000015; %Windage loss coefficient

%Creating a meshgrid
[X,Y]=meshgrid(w,T);

%To calculate the respective losses using the above data
copper_loss=(Y.^2)*Kc;
iron_loss=X.*Ki;
windage_loss=(X.^3)*Kw;
const_loss=20;

%To calculate the output and input power
out_pwr=X.*Y;
in_pwr=out_pwr+copper_loss+iron_loss+windage_loss+const_loss;

%To calculate the efficiency
Eff=out_pwr./in_pwr;
n=linspace(0.75,0.95,10);

%To plot the required contour
box off
grid off
contour(X,Y,Eff,n)
xlabel('Speed,rad/s')
ylabel('Torque,Nm')
title('Speed Torque Characteristics')
- Arrays are formed for rotational speed and torque using linspace command
- In a motor, there are 4 types of losses - Copper loss(Kc), Iron loss(Ki), Windage loss(Kw), Other losses that are constant.
- A meshgrid is formed with X as rotational speed and Y as torque
- Output power at these points is found using the relation, T*w.
- Total losses are a sum of all the above losses
- Input power is the sum of output power and all the losses.
- To form a contour different variable values are assigned for efficiencies. Here the V which contains efficiency values is plotted on the w-T plane.
The '.m' file for the above program is attached below.
https://drive.google.com/file/d/1kl2DnoxMopwGr5uxqdy-kLIdaHASU7hq/view?usp=sharing
RESULT -
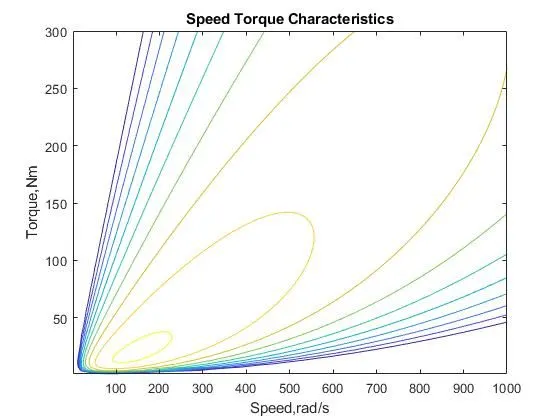
The innermost contour has the highest efficiency. The contour plots help in identifying the range values for which maximum efficiency can be obtained.