Week-11 Challenge: Braking
1. For a defined driving cycle, calculate the energy required for braking.
Solution
The Simulink model to calculate braking energy is shown below. The drive cycle US06 is given as input. It is converted from kmph to mps using a gain block and given as input to the vehicle model subsystem.
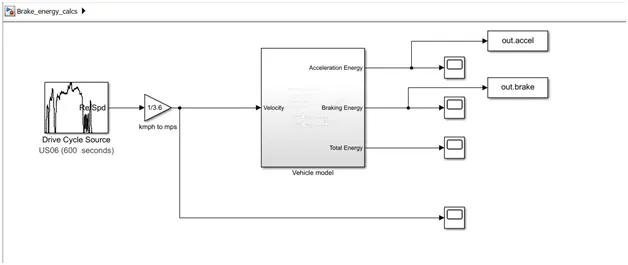
Figure 1: Simulink model to calculate Energy of a Drive cycle
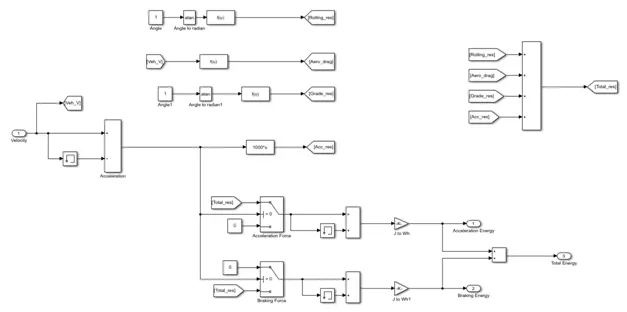
Figure 2: Vehicle model subsystem to calculate energy
Inside this block, the resistive forces are calculated as follows.
Rolling Resistance = m*g*Cr*cos(alpha) = 1000*9.81*0.02*cos(1)
Aerodynamic drag = 0.5*Cd *Af*Ad*V^2 = 0.5* 0.33*2.34*1.25*V^2
Grade Resistance = m*g*sin(beta) = 1000*9.81*sin(1)
Acceleration resistance = m*a = 1000*(Velocity difference)
Total force = Sum of all the above forces.
For positive acceleration, Acceleration Energy will be calculated and for negative aceleration, braking energy will be calculated.
Output Analysis
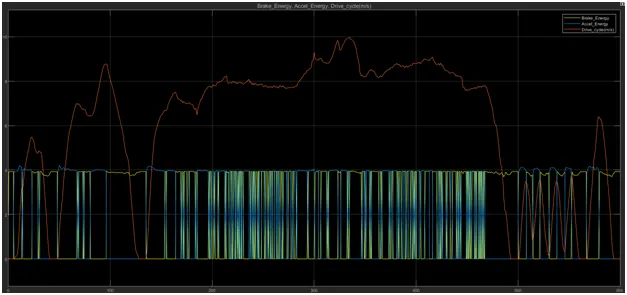
Figure 3: US06 Drive cycle with Acceleration and Brake energy distribution
The drive cycle US06 in meter per second along with acceleration and braking energy has been shown in figure 3. We can see that, whenever speed is reducing, braking energy is applied and it is same as acceleration energy.
The individual Energy for acceleration and braking has been plotted in figure 4 and 5 respectively. Total energy is the sum of acceleration and braking energy.
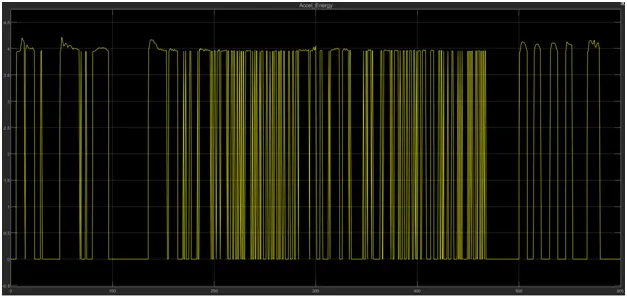
Figure 4: Acceleration Energy
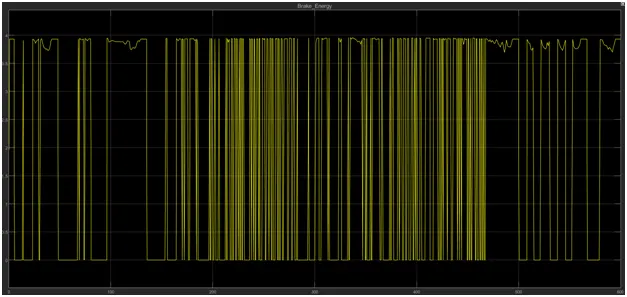
Figure 5: Braking Energy
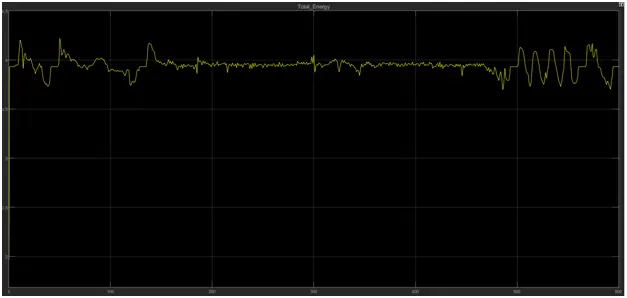
Figure 6: Total Energy
Calculation of Total Accel/Brake Energy
The Braking and acceleration energy values are saved into workspace in variables out.brake and out.accel. By adding all the elements in the array, we can calculate the total acceleration and braking energy.
sum(out.brake)
ans =
2.8871e+03
>> sum(out.accel)
ans =
2.4896e+03
Total Braking Energy = 2.88 kWh
Total Acceleration Energy = 2.489 kWh
2. Why electric motor can’t develop braking torque at high speed similar to starting? How electric and mechanical brakes are coordinated?
Solution
Electric motor has certain limitations to develop high torque during braking. The figure 7 shows the motor characteristics from an experimental data. Even though the characteristics appear as mirror image of positive quadrant operation, the torque values are less than that in positive region. This is due to the following reasons.
- At low speeds motor operates in constant Torque mode. But at high speeds, it will operate at constant Power mode. If braking happens at high speed, Torque produced will be less.
- During braking, motor will operate in field weakening mode, so Torque produced is less.
- Back EMF generated will also be less in braking mode. This also contributes to lesser Torque.
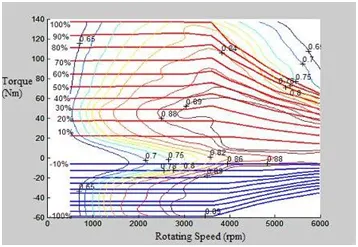
Figure 7: Motor Torque distribution
Coordination of Electrical and Mechanical Braking
Electric braking force is related to the vehicle speed, and its braking capacity was limited, which can’t meet requirements of heavy braking intensity. Thus the electro-mechanical hybrid braking system should be adopted in the EVs with regenerative braking system. The braking stability is influenced by electric braking force which only acts on driving wheels and changes the distribution portion of braking force of front and rear axles of conventional friction braking system. It can be achieved to meet the requirements of braking stability that the front axle is locked before the rear axle or the two axles are locked simultaneity by allocating electric braking torque and friction braking torque reasonably, choosing proper braking force control strategy of front and rear axles.
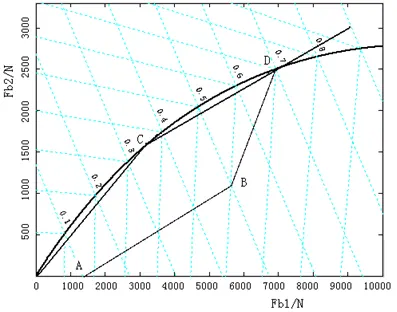
Figure 8: Braking force distribution curve of an EV
Fig.8 showed the braking force distribution curve of the front and rear axles, and the total braking force is borne both by electric braking force and friction braking force under a fixed proportion. There is only electric braking force acting on the whole vehicle when the z=0.1; there are both electric braking force and friction braking force bring to bear at a fixed ratio while 0.1<z=0.7; the z> 0.7 is the state of emergency braking, and there is only friction braking force in this situation.
Braking Stability
Braking stability is the capacity that vehicles do not deviate, sideslip, or lose the steering ability when braking; it is closely related to the distribution and regulation of the braking force of the front and rear arrester. In order to ensure the braking stability of vehicles, firstly, it must make sure that the instances that only the rear wheels locked or rear wheels locked ahead of the front wheels do not happen; Secondly, it should also be avoided that only the front wheels locked or the front and rear wheels locked simultaneity. The ideal instance is that none of the wheels locked when vehicles braking.
Electronic Brake Force Distribution (EBFD)
Electronic brake-force distribution (EBFD) is an active vehicle safety feature designed to make braking as efficient as possible. A special function of antilock braking systems (ABS), EBFD makes the amount of brake force applied to a wheel proportional to that wheel’s load at the time.
Electronic brake-force distribution is often installed with antilock braking systems (ABS). ABS installations that are supplemented with EBFD react more quickly and deliver more situation-specific braking commands than older ABS setups. EBFD systems are usually made up of three subcomponents that are monitored and guided by an electronic control unit (ECU). These components include speed sensors for each wheel (sensors that Electronic Brake-Force Distribution (EBFD) Your brain is your vehicle’s most important safety feature. monitor how fast the wheel is rotating), brake-force modulators (a mechanism that increases or decreases brake-force applied to a wheel), an acceleration / deceleration sensor that detects the vehicle’s forward and sideways acceleration/deceleration, and usually a yaw sensor (a sensor that monitors a vehicle’s movement along its vertical axis). The electronic control unit interprets the information from the speed and yaw sensors, and then sends commands to the brake-force modulators. Similar to how ABS setups operate; the ECU in EBFD systems is attached to the hydraulic brake-force modulator. So, while the ECU and brake modulator serve different purposes, they are physically combined into one electro-hydraulic unit.
EBID employed in Nissan
In Nissan EVs, EBID has been employed for the control and optimization of regenerative as well as mechanical (hydraulic) braking.
Figure 9 shows the configuration of brakes in Nissan cars.
In this, when the driver steps on the brake pedal, the stroke sensor detects operation of the brake. That information is communicated to the ECU and controls the motor. The motor engages the piston and amplifies the friction brake's pressure (hydraulic pressure). Through optimum control of the friction brake's hydraulic pressure, the energy regeneration outcome is maximized.
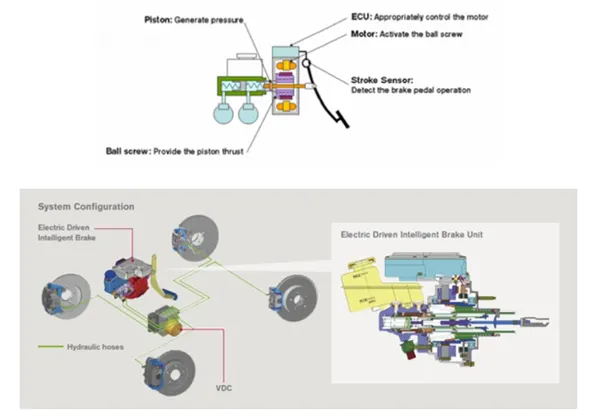
Figure 9: EBID employed in Nissan
3.Make a MATLAB program which plots contour of given motor speed, torque and efficiency values. Attach the code as a .m file attach a screenshot of all the plots
Solution
The code to plot contour of motor speed, Torque and Efficiency is given below.
% To plot the efiiciency contour
x = linspace(1,1000);     % Speed in rad/s
y = linspace(1,250);      % Torque in Nm
kc = 0.2;      %Copper loss constant
ki = 0.008;    %Iron loss constant
kw = 0.00001;  %Windage loss constant
conL = 20;     %Constant losses
[x,y] = meshgrid(x,y);
Outputpower = (x.*y);
B = (y.^2)*kc;  %Cu loss
C = x*ki;       %Iron loss
D = (x.^3)*kw;  %Windage loss
Inputpower = Outputpower + B + C + D + conL;
z = Outputpower./Inputpower;
%Specify efficieny for plotting
v = [ 0.75 0.80 0.85 0.90 0.91 0.92 0.925 0.93];
box off
grid off
contour(x,y,z,v);
xlabel('speed'),ylabel('Torque');
hold on
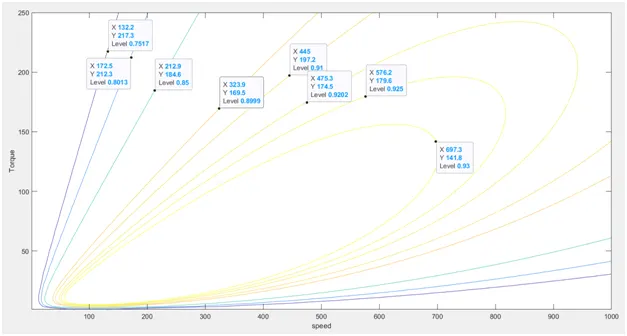
Figure 10: Contour plot of motor speed, Torque and Efficiency
In the above figure, we can see that each contour corresponds to each efficiency value. To indicate the efficiency values, certain points have been highlighted.
Conclusion
- Simulink model to calculate Acceleration and Braking Energy has been developed and results have been plotted.
- Electric motor Braking Characteristics and coordination with mechanical brakes have been analysed.
- With a MATLAB program, contour of given motor speed, torque and efficiency values have been plotted.