Week 11 Challenge
AIM OF THE EXPERIMENT: To determine the temperature load acting on bridge structure and perform analysis in Staad.Pro.
THEORY:-
Temperature Loads:- A thermal load is defined as the temperature that causes the effect on buildings and structures, such as outdoor air temperature, solar radiation, underground temperature, indoor air temperature and the heat source equipment inside the building.
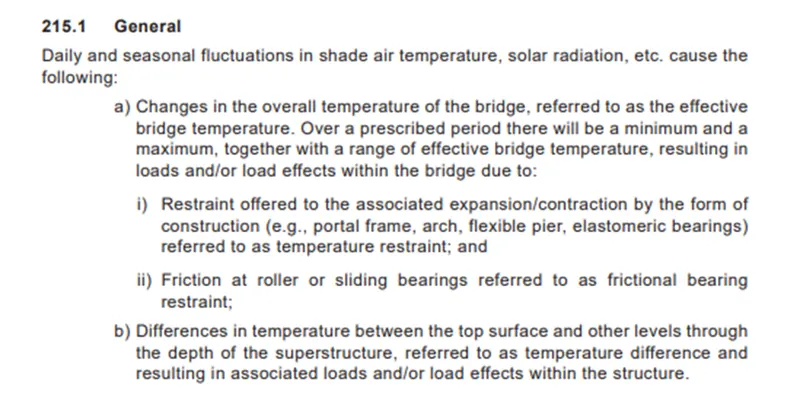
Given Data :-
Span of bridge = 9.0 m
Width of carriage way = 7.0 m
Location = Delhi (New Delhi C.H.O)

Diameter of pier = 2.5 m
Width of Pier cap = 6.0m
Thickness of deck slab = 550 mm = 0.55 m
Size of Box girder = 1.5 m x 1.5 m and thickness of web = 0.3 m
Compressive strength of concrete = 40 N/mm2
CALCULATIONS:-
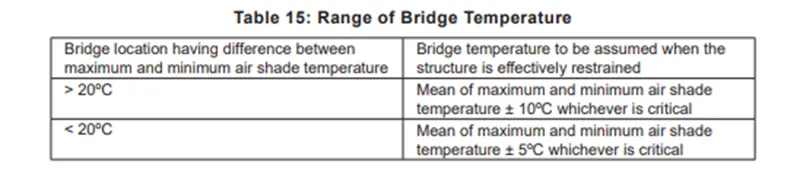
Maximum temperature at Delhi C.H.O. as per IRC 6 2017 = 47.8o C
Minimum temperature at Delhi C.H.O. as per IRC 6 2017 = -0.4o C
Effective temperature difference (Teff) = [(47.8 - (-0.4))/2] + 10 = 34.1 o C
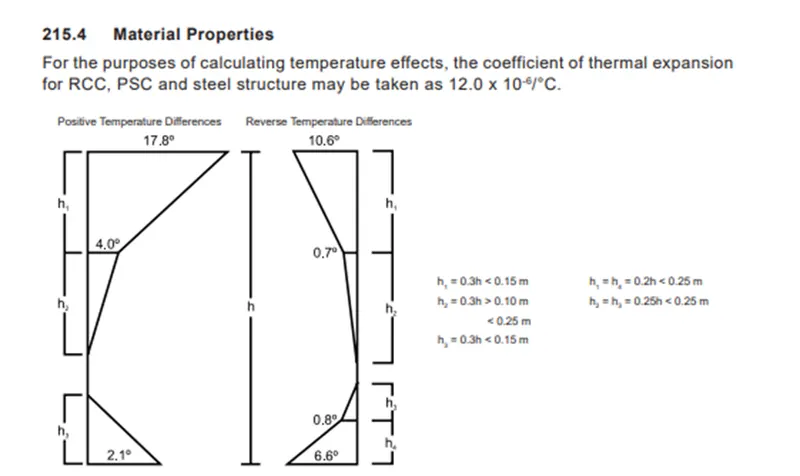
Coefficient of Thermal Expansion (α) = 12.0 x 10⁻⁶/ o C
Young Modulus of concrete (E) as per IS 456 = 5000√fck = 5000 x √40 = 31622.777 KN/m2
Stress due to Temperature (σtemp) = α x Teff x E = 12.0 x 10-6 x 34.1 x 31622.777 = 12.94 KN/m2
Maximum Permissible Stress (σperm) = (2/3) x 0.7 x √fck = (2/3) x 0.7 x √40 = 2.952 KN/m2
Therefore, Stress = 3 KN/m2.
Positive Temperature Differences:
Temperature at top of deck = 47.8 o C
Temperature at bottom of deck = (2.1/17.8) x 47.8 o C = 5.64 o C
So, 47.8 oc-5.64 oc
=42.16 o C
Reverse Temperature Differences:
Temperature at top of deck = 47.8 o C
Temperature at bottom of deck = (6.6/10.6) x 47.8 o C = 29.762 o C
PROCEDURES IN STAAD PRO
STEP 1:- Modelling of Structure
Model the structure as per given data in the question
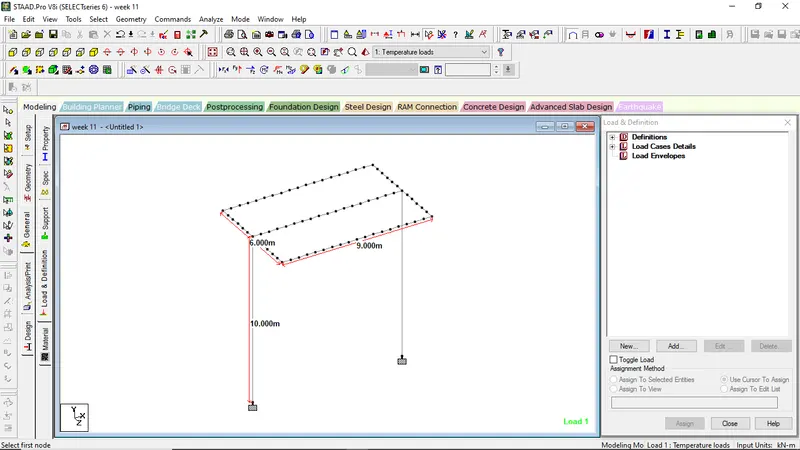
Pier Height=10m
Width of the Pier Cap=6m
Span of Pier cap=9m
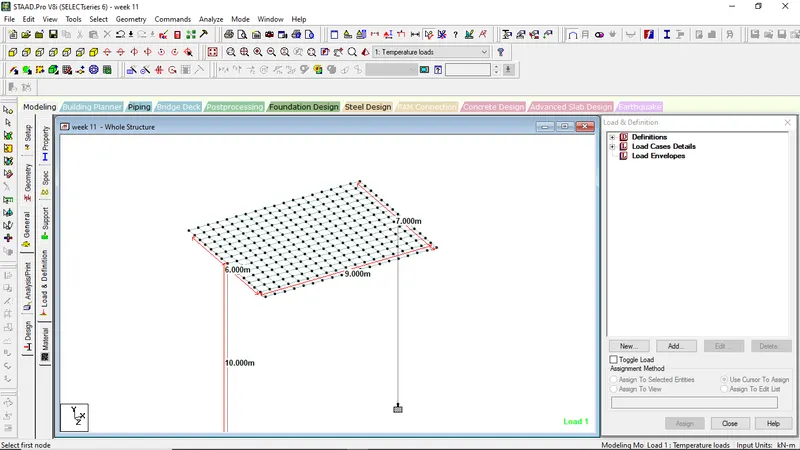
Width of the Deck slab= 7m
STEP 2:-
Assignation of Properties to the section
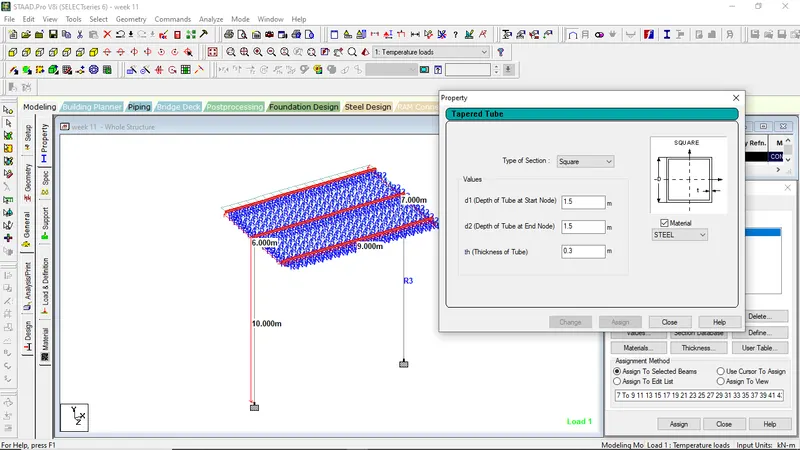
For Box Girder
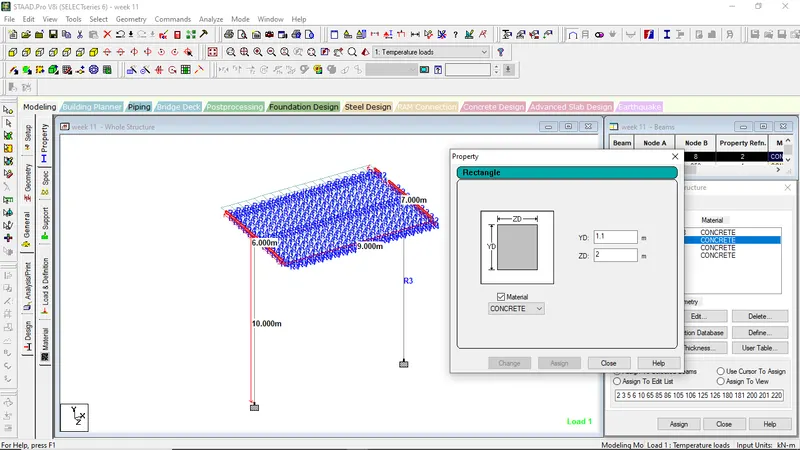
For Pier Cap
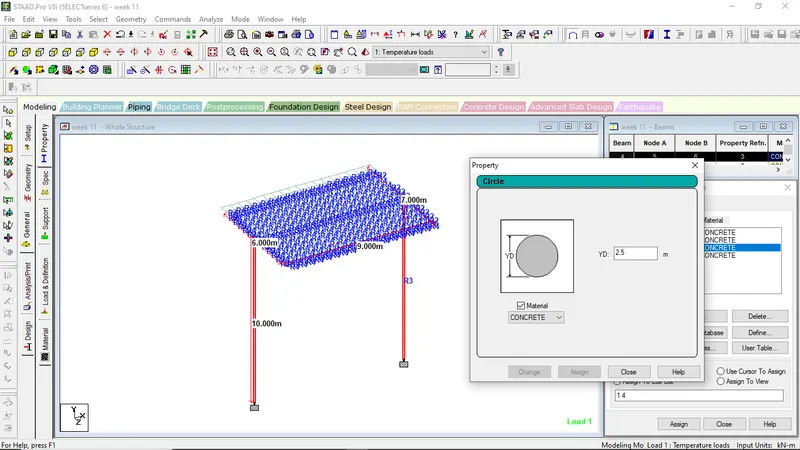
For Piers
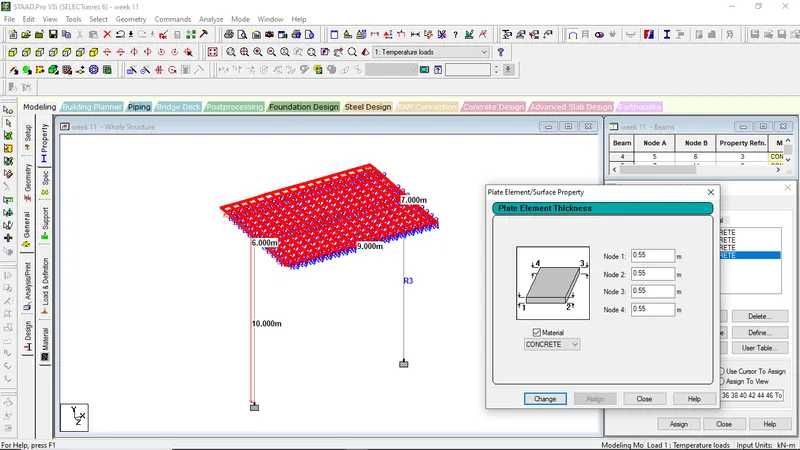
For Deck Slab
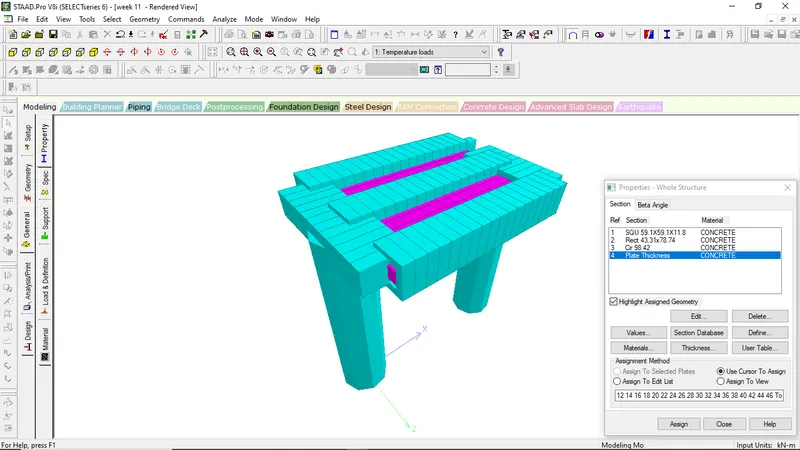
STEP-3:-
Assigning of supports to the Model
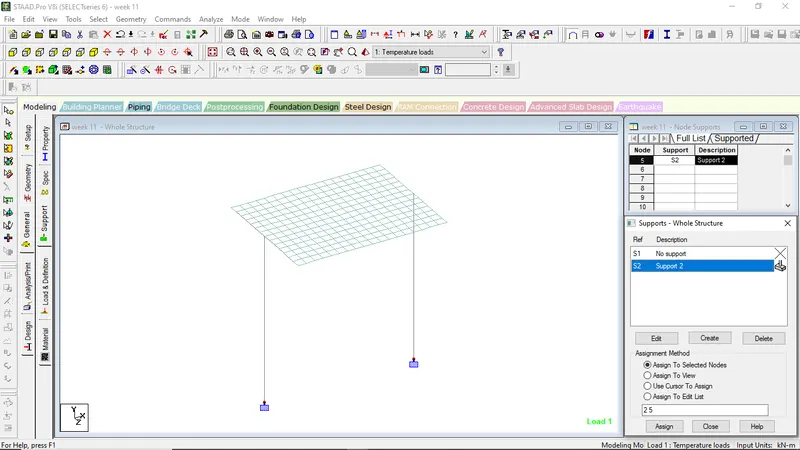
STEP 4:-
Applications of Loads to the model:-
- Go to General Tabs
- Go to Loads and Defination
- Create New, Rename as Temperature Load and click add.
- Click onTemperature Loads and click add
- click on temperature loads on left side
- Put the calculated values
- click add
- and click temp load assign to view
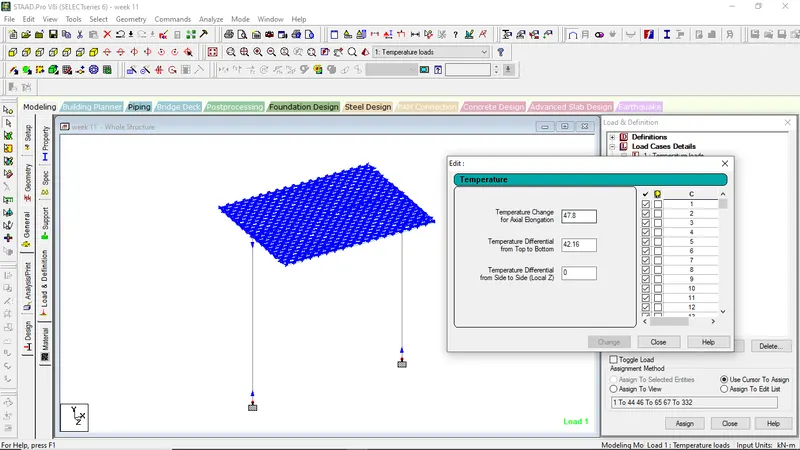
STEP 5:-
Analyze the model
- Go to analalysis and print
- Select on no print option
- Click on analyze menu
- select run analysis
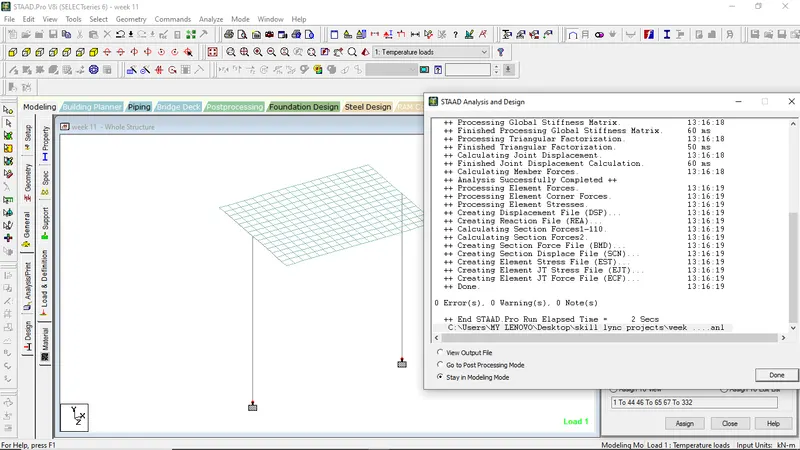
STEP 6:-
Go to the Post Processing mode to meet exact analytical results
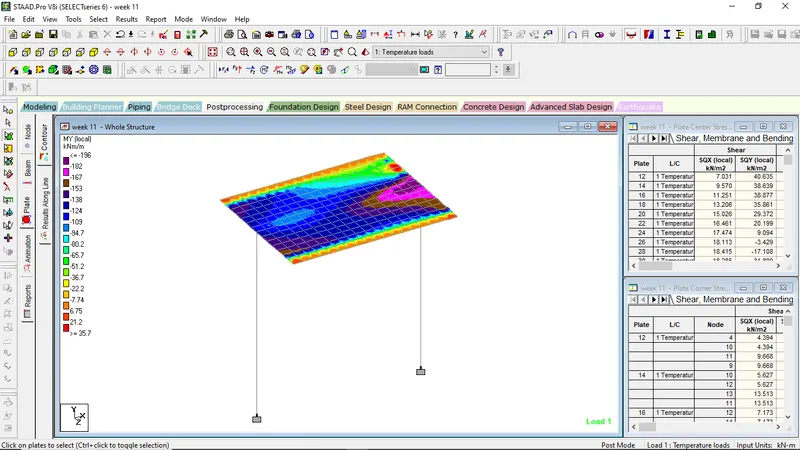
Plate contor showing My local values on Temp loads
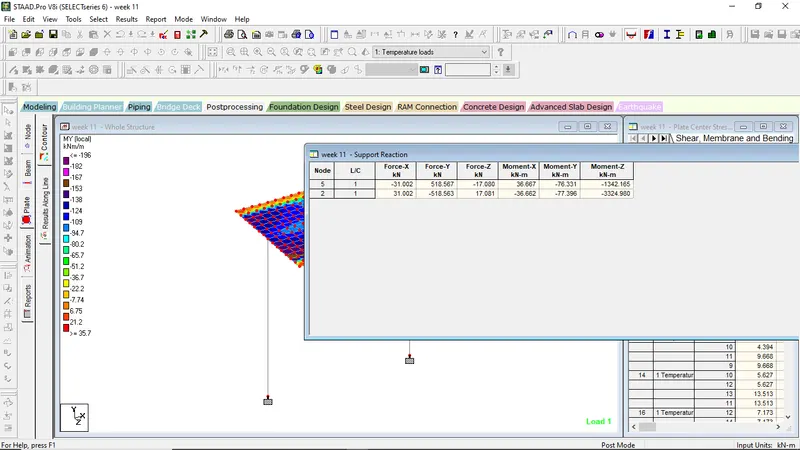
Value showing maximum support reactions for the model
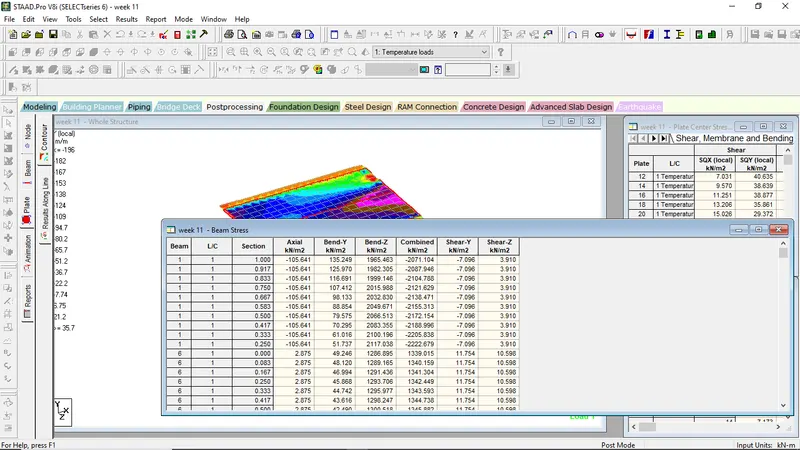
Values showing Maximum beam stress bending My