Week 10 - Simulating Combustion of Natural Gas.
Aim: To perform a combustion simulation on given combustor model and to observe the variation of mass fraction of different species in the simulation and study the effect of adding water in to the fuel.
Objective :
Part 1)
1) Perform a combustion simulation and plot the variation of the mass fraction of the different species’ in the simulation using line probes at different locations of the combustor.
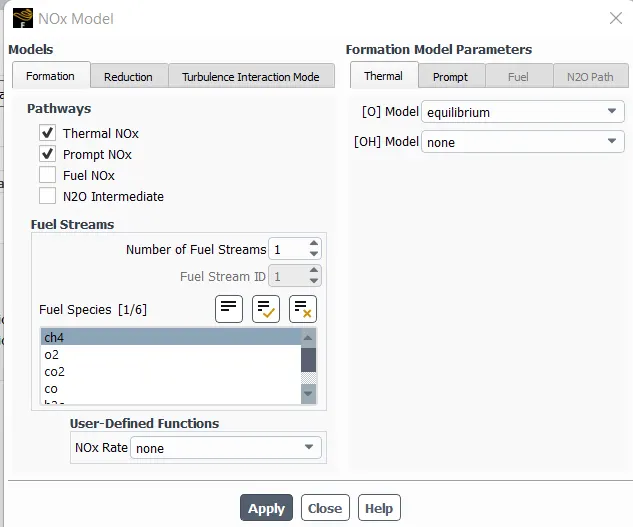
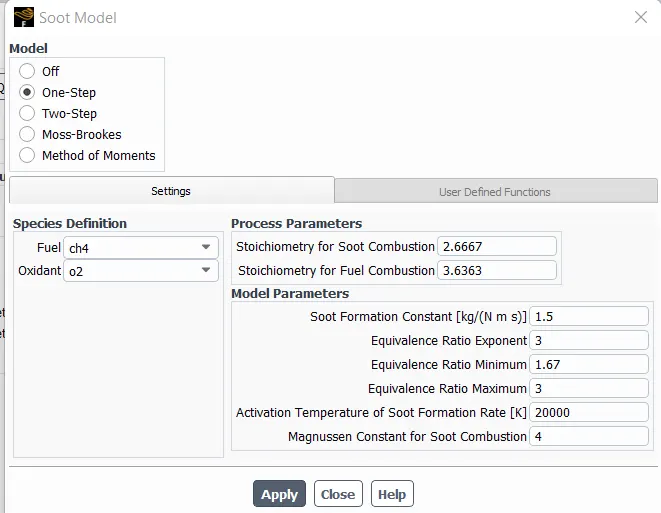
2) Setup NOx and soot model to observe NOx emissions and soot formation
Part 2
1) Add water content in the fuel from 5% to 30% by mole.
2) Provide necessary plots and contours from the CFD results
Introduction :
Natural gas is an extremely important source of energy for reducing pollution and maintaining a clean and healthy environment. In addition to being a domestically abundant and secure source of energy, the use of natural gas also offers a number of environmental benefits over other sources of energy, particularly other fossil fuels.
The combustion is defined as a chemical reaction in which a hydrocarbon fuel reacts with an oxidant to form products, accompanied with the release of energy in the form of heat. Being the integral part of various engineering applications like internal combustion engines, furnace, power station combustors, combustion exhibits itself as a wide domain during the design, analysis and performance characterics stages of the above mentioned applications.
In this simulation the Nox and soot is getting formed at the outlet of the combustor,such formation has harmful effects on the environment and human beings.The stringent government norms also demand the least formation of Nox and soot and to satisfy those requirements, you need to check the effect of adding the water in the fuel.
Here we add the water content in the fuel from 5% to 30% by mole and observe the effect of it on the results.
Step 1) Preprocessing
Geometry :
3D model :
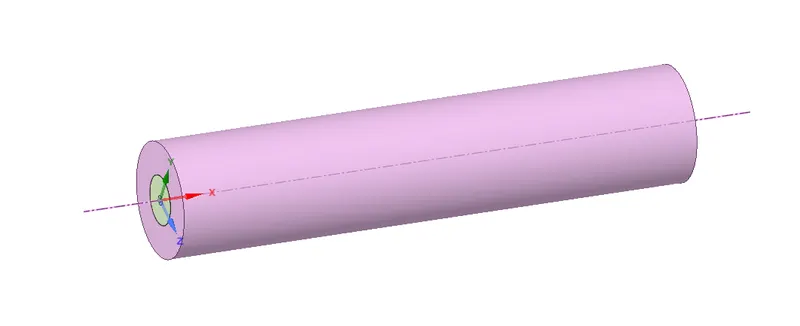
Their are three components in this 3D model so we have to combine this three component and use the split body command to split the region. we copy the region of XY plane and paste it on new design in space claim to create the 2D model.
2D model :
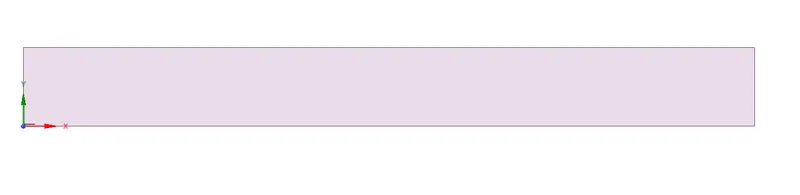
Step 2) Mesh :
The name selection are given which shown in figure below:
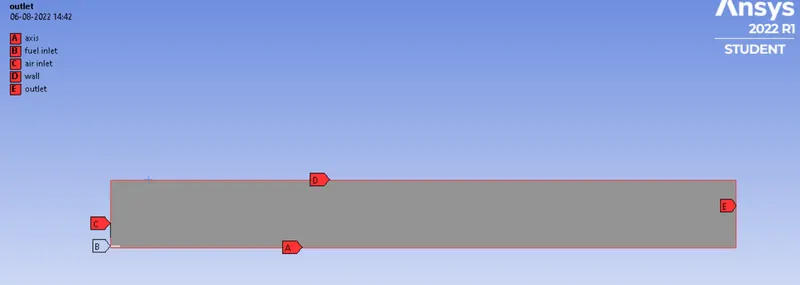
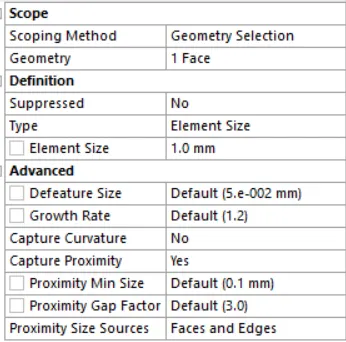
In this we use face sizing method and use 1 mm mesh size and capture proximity is enabled.

Mesh quality:
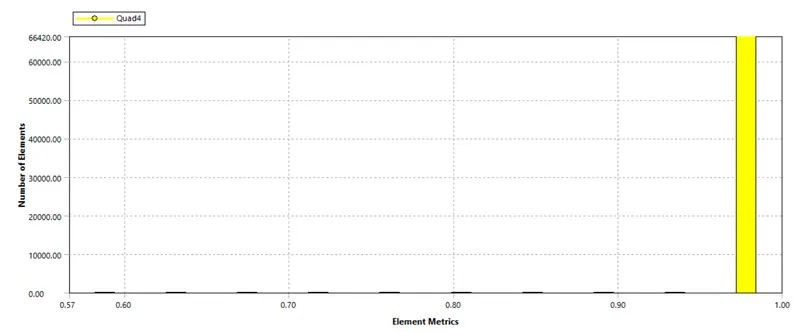
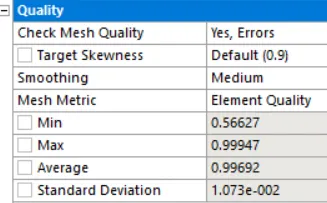
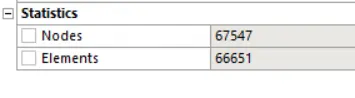
Mesh statistic :
Step 3) Set up
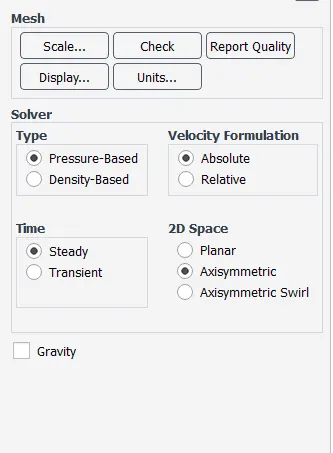
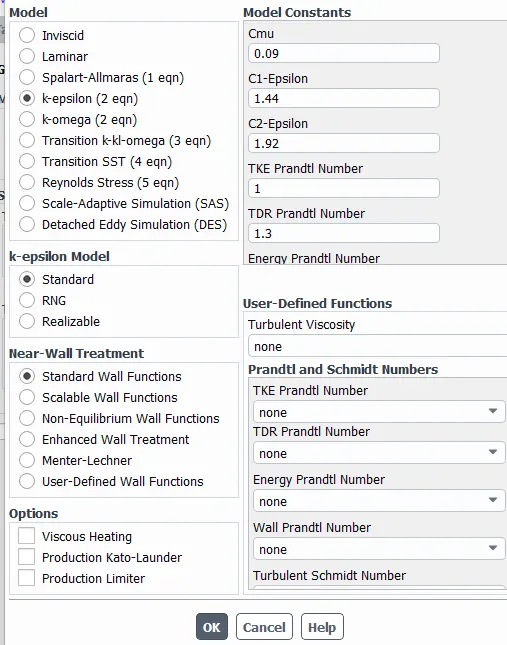
Energy equation = enabled
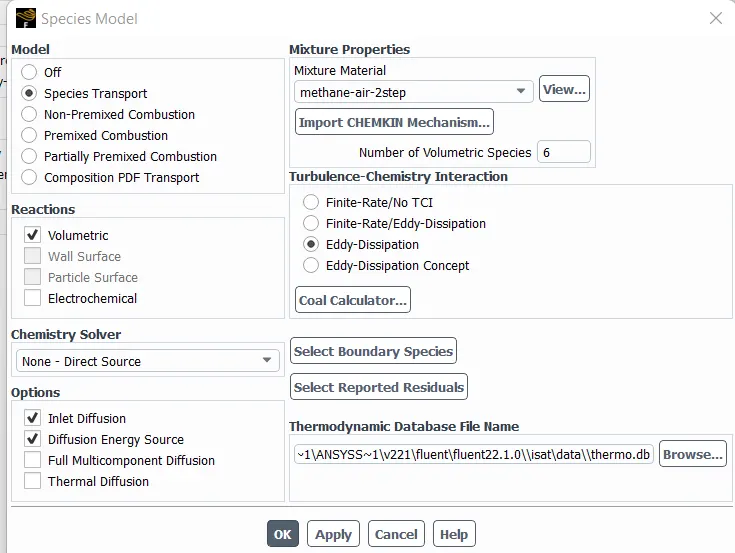
Species Model:
The species transport equations is enabled which helps in predicting the local mass fraction of each species in the simulation. The volumetric reaction is turned on as the reaction takes place in gaseous phase. The inlet diffusion is enabled to calculate the diffusion coefficients at inlet.The eddy dissipation model is selected for calculating the net rate of production of the species in the simulation.
Nox model:
Soot model:
In part 1) of simulation the mass fraction of H2OH2O is 0 and CH4CH4 is 1 at Fuel inlet and in part 2 the mass fraction of H2OH2O is increased from 5% to 30% by mole.
Part 1)
Boundary conditions
air inlet
Velocity = 0.5 m/sec
Temperature =300 K
Species :
| Species | Mass fraction |
| CH4CH4(methane) | 0 |
| O2O2 (Oxygen) | 0.23 |
| CO2CO2(Carbon dioxide) | 0 |
| CO (Carbon monoxide) | 0 |
| H2OH2O (Water) | 0 |
fuel inlet
Velocity = 80 m/sec
Temperature = 300 K
Species:
| Species | Mass fraction |
| CH4CH4(methane) | 1 |
| O2O2 (Oxygen) | 0 |
| CO2CO2(Carbon dioxide) | 0 |
| CO (Carbon monoxide) | 0 |
| H2OH2O (Water) | 0 |
outlet = Pressure outlet = Gauge pressure= 0 pa
axis : Type= axis
wall : Type= wall
Result of Part 1)
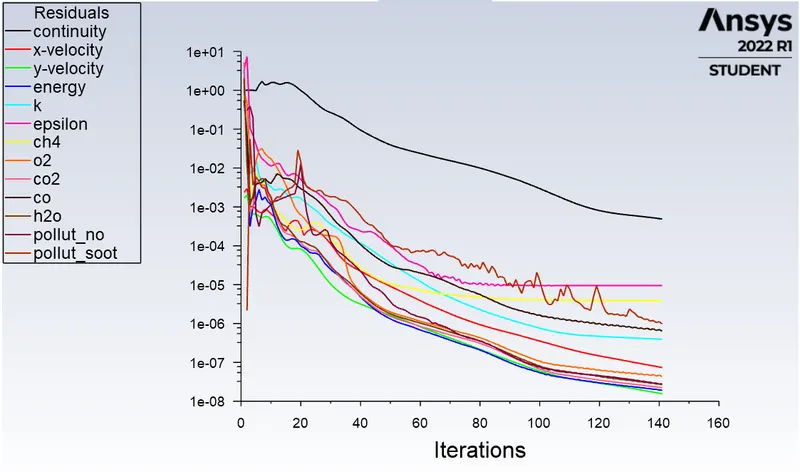
Residual plot:
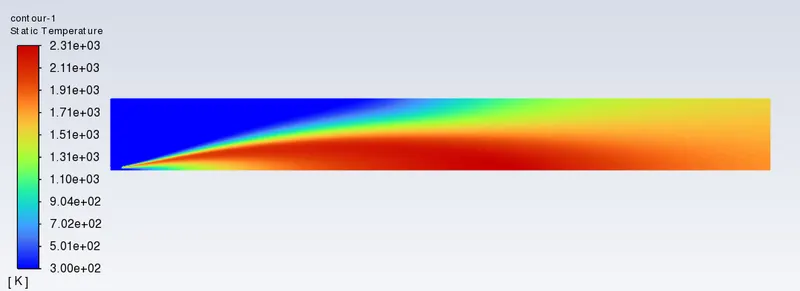
Temperature Contour :
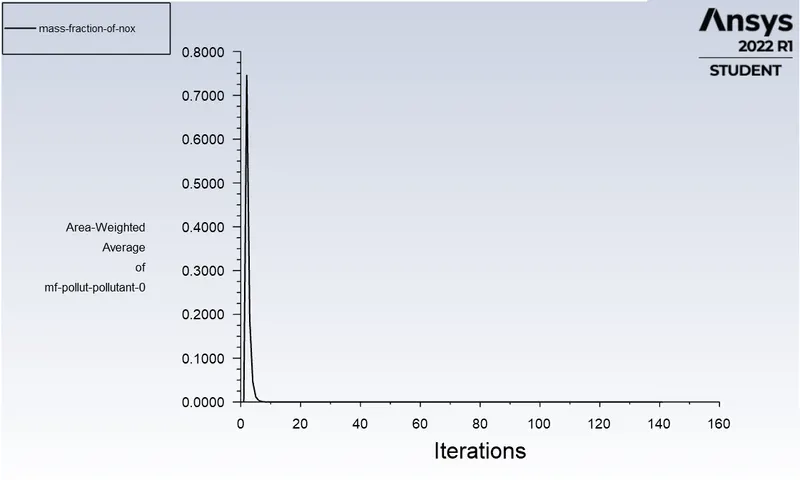
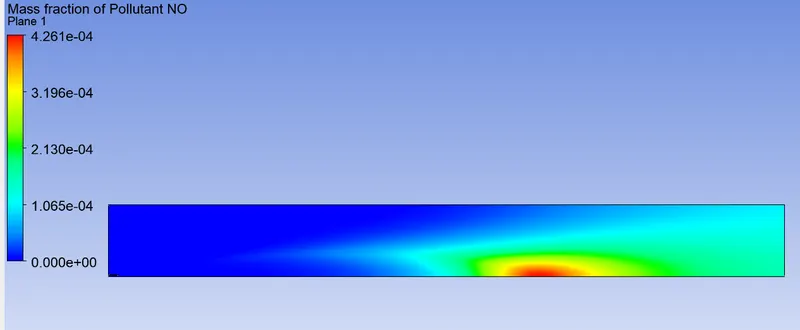
Mass fraction of pollutant No. of NOx plot:
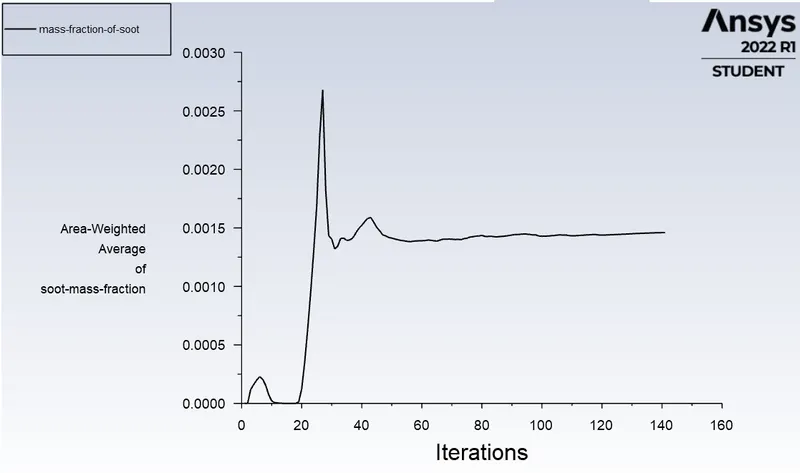
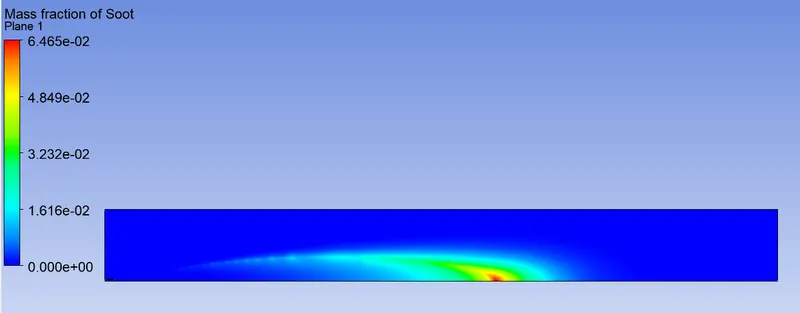
Mass fraction of Soot plot:
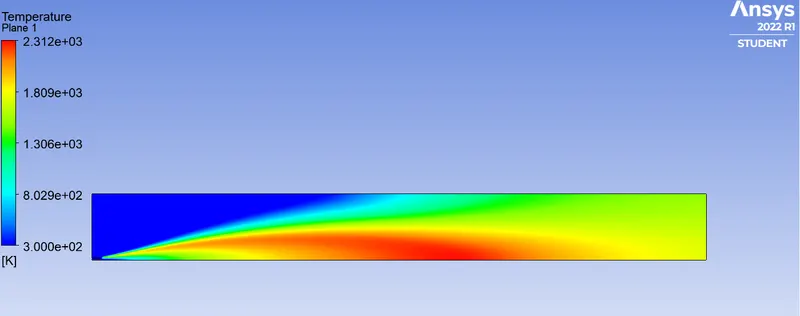
Temperature contour :
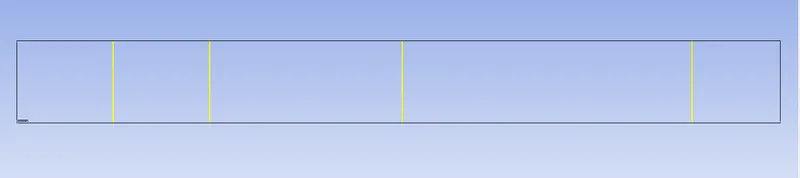
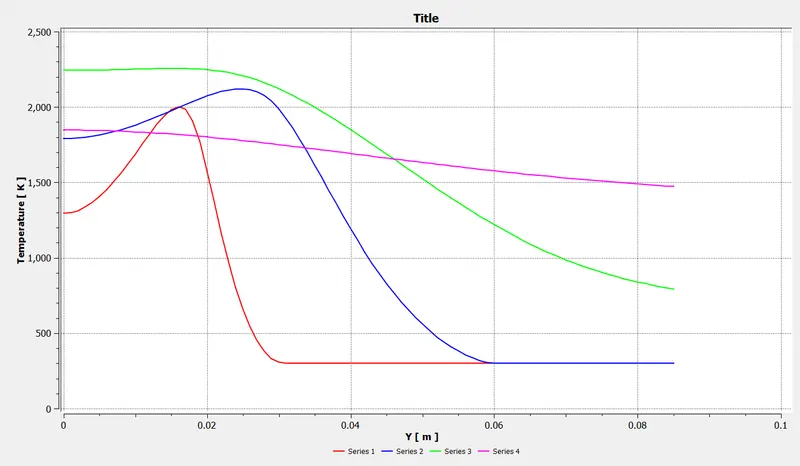
Line probes at different location of combustor:
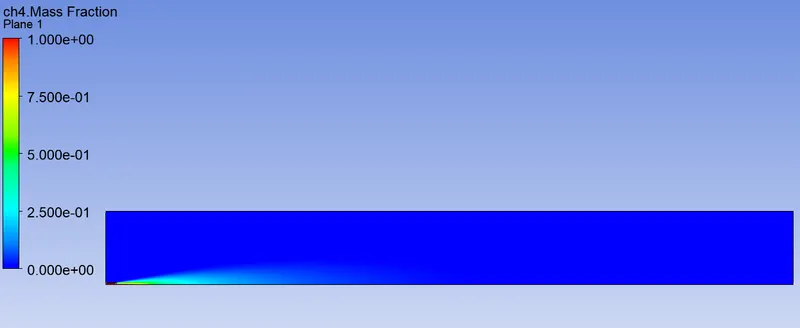
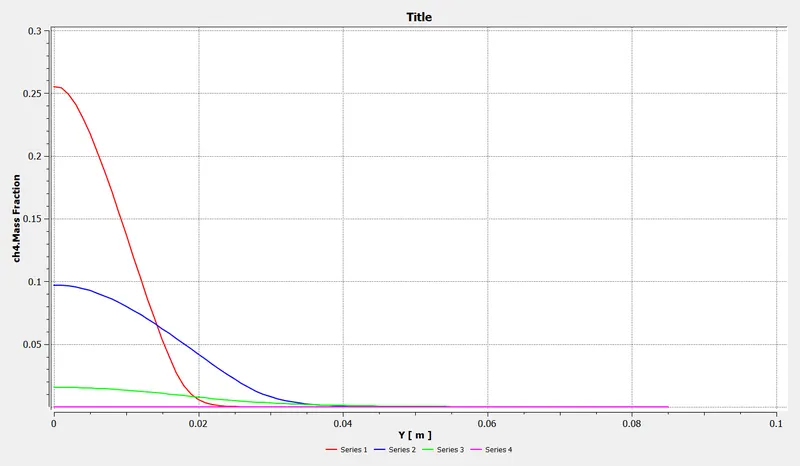
CH4CH4 Mass fraction :
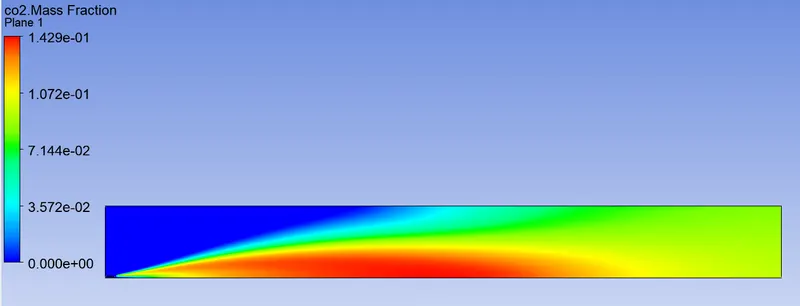
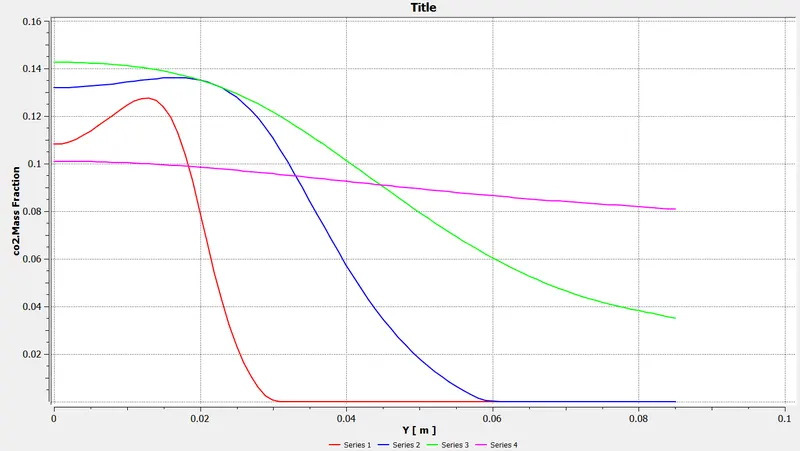
CO2CO2 Mass fraction :
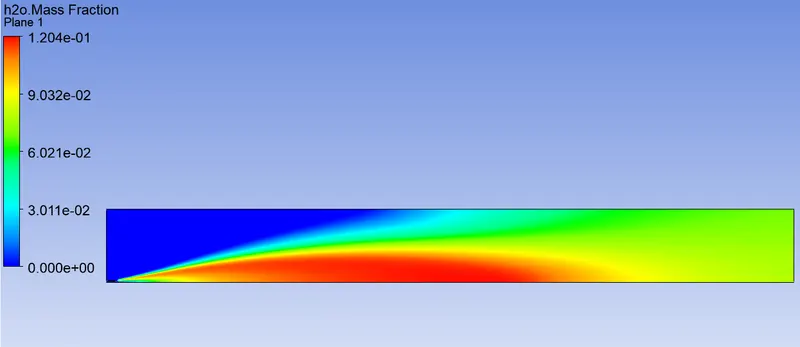
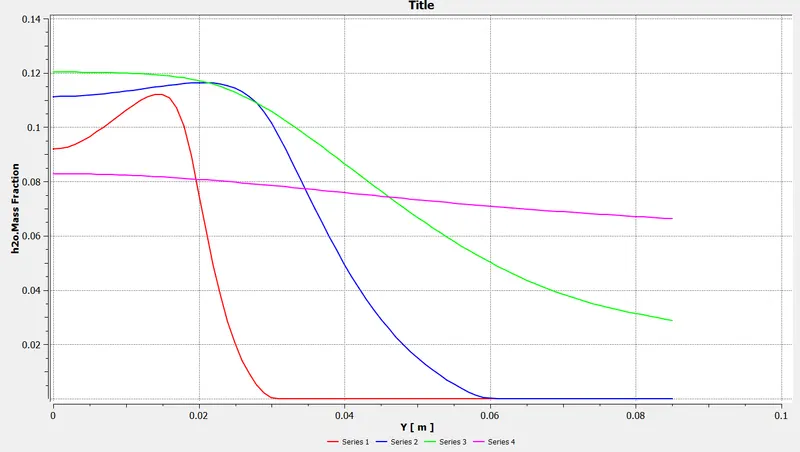
H2OH2O Mass fraction :
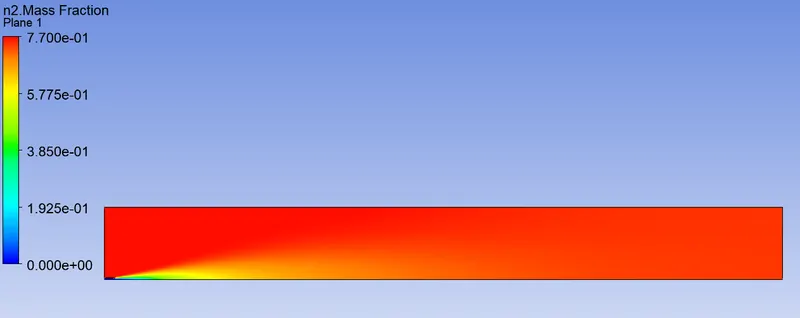
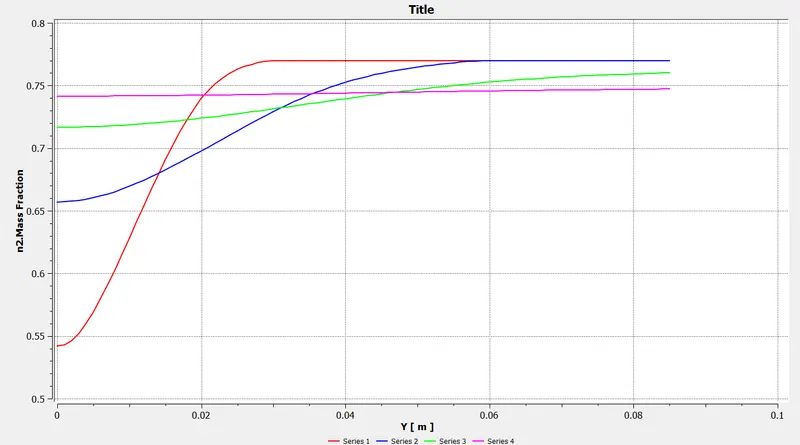
N2N2 Mass fraction :
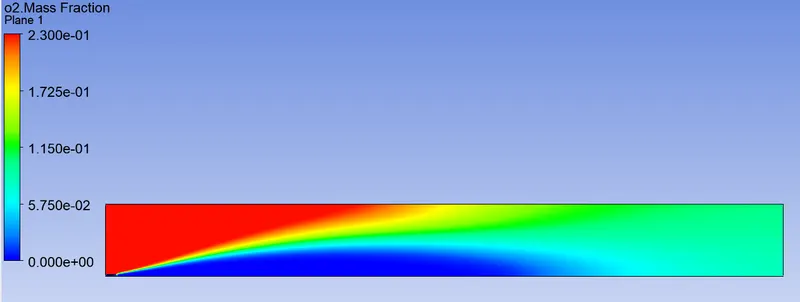
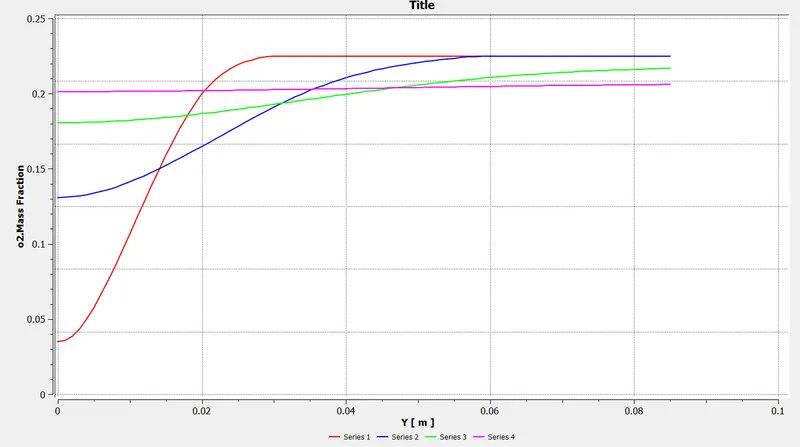
O2O2 Mass fraction :
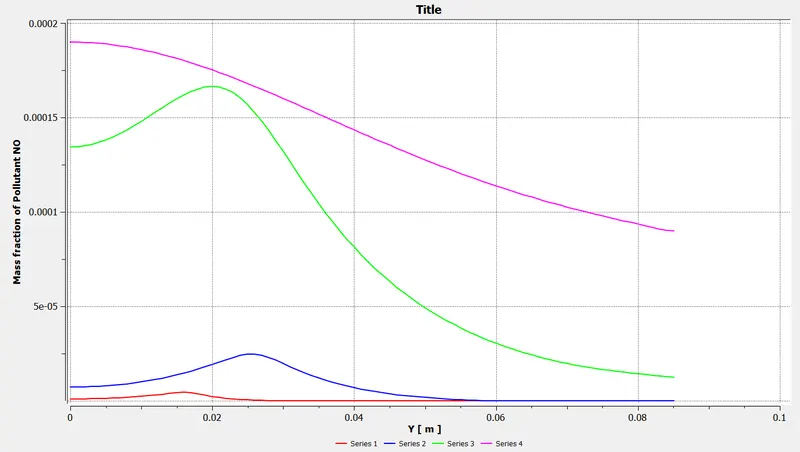
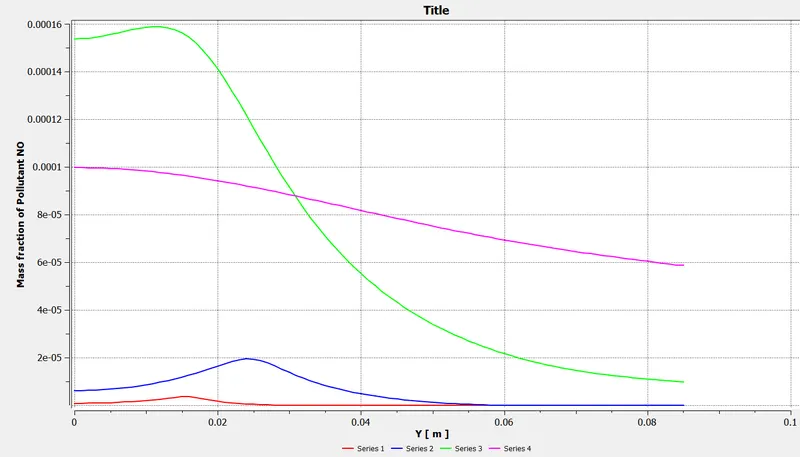
Pollutant NOx mass fraction :
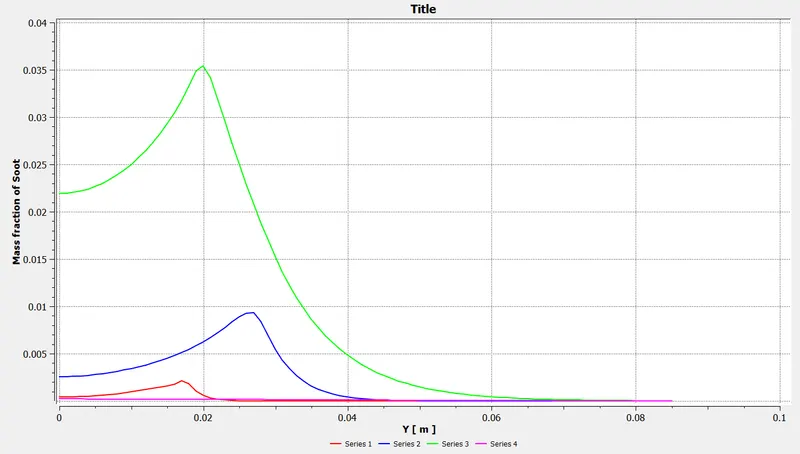
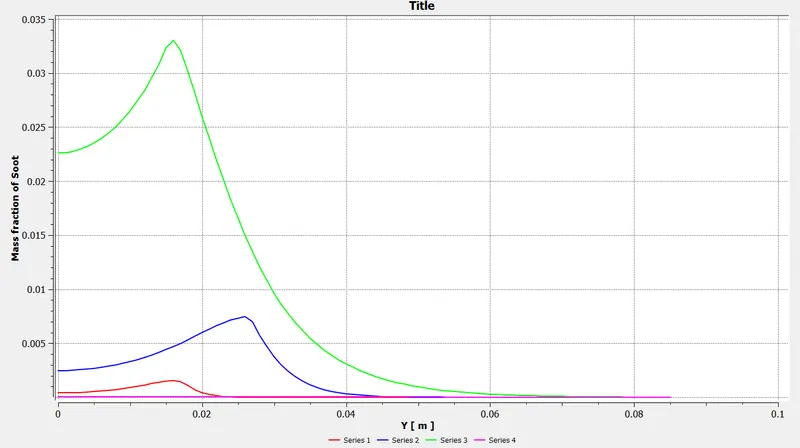
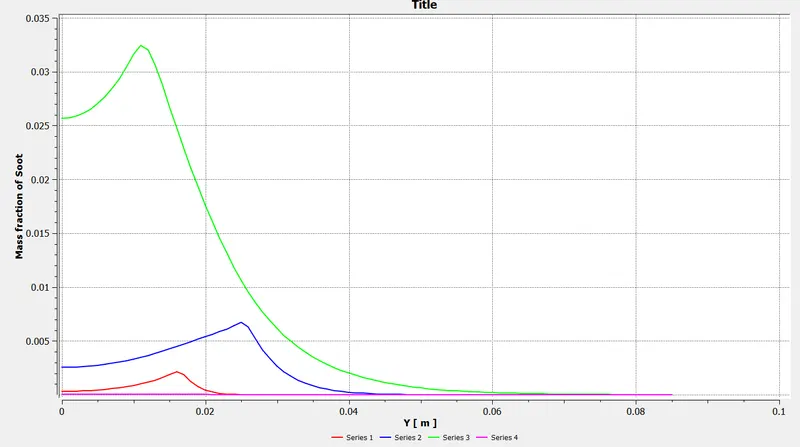
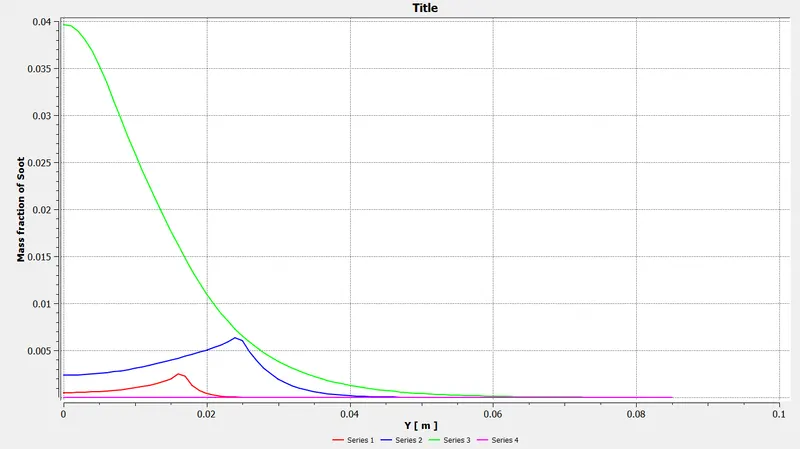
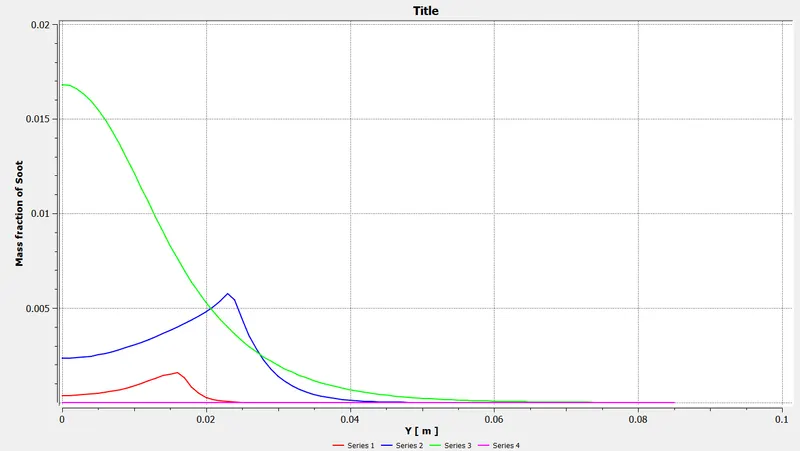
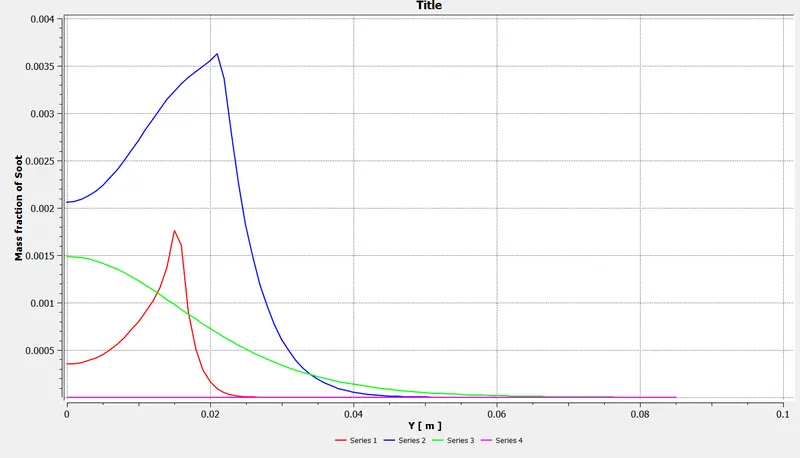
Mass fraction of soot :
Observations from part 1 simulation :
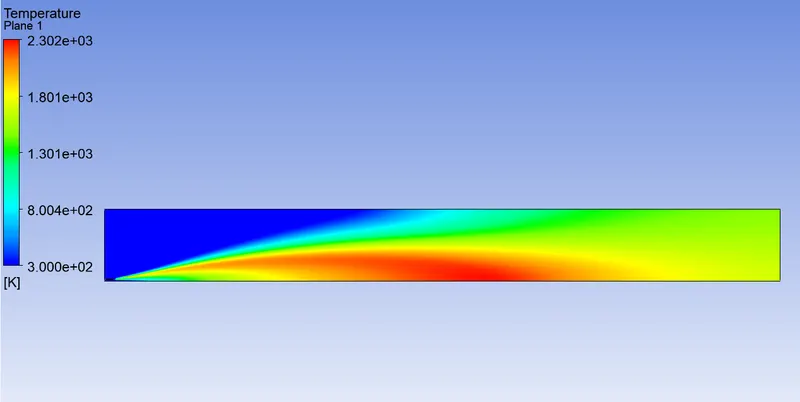
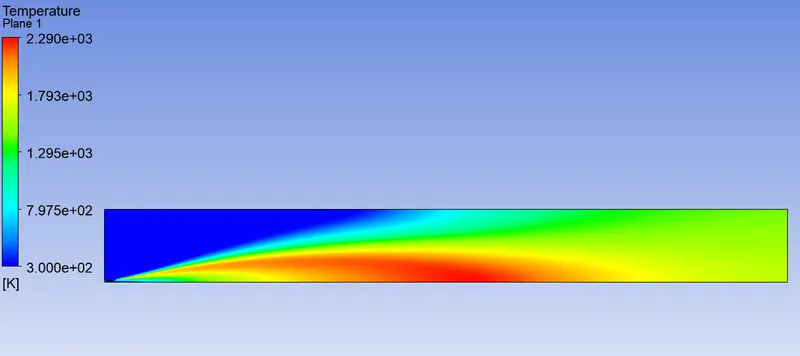
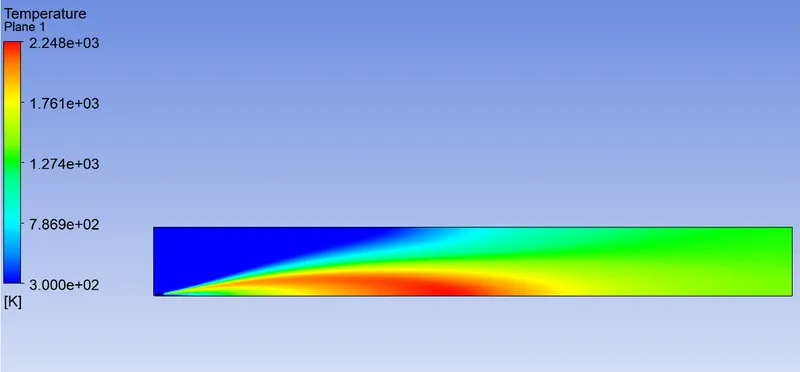
- From the temperature contour we can say that the temperature observed near the inlet of combustor is high where the mixing of fuel and air is takes place .
- In the CH4 mass fraction contour, the highest mass fraction is observed at near the fuel inlet and as combustion takes place then the CH4 mass fraction is decreases.
- The highest mass fraction of CO2CO2and H2OH2O is observed in the high temperature zone .
- From the N2 mass fraction contour we observed that the N2 is uniformly distributed from inlet to outlet.
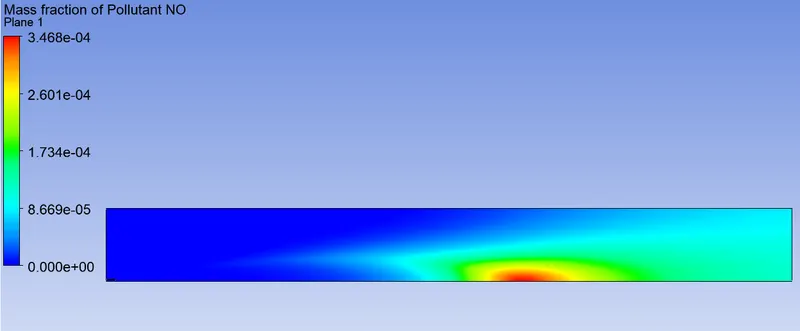
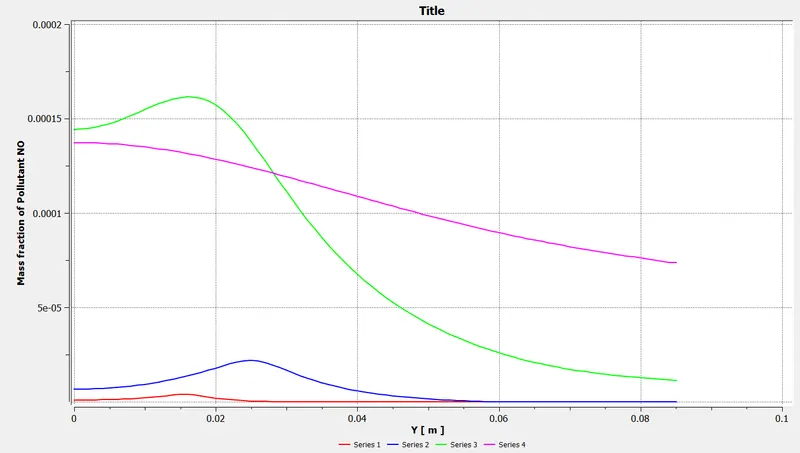
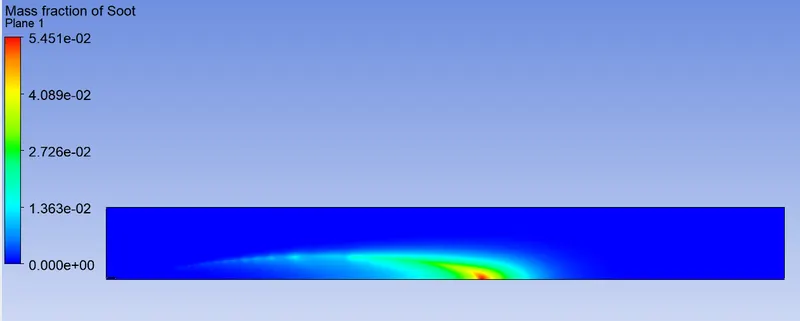
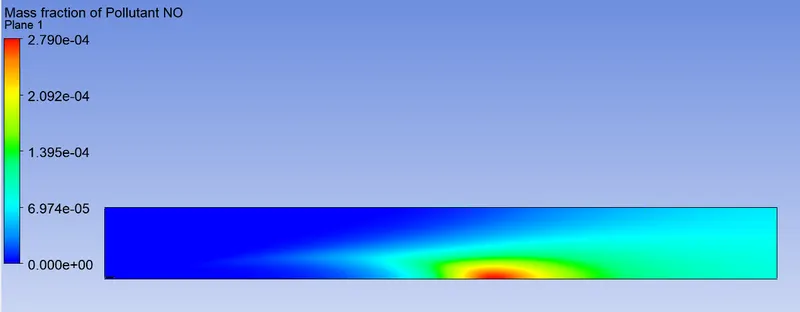
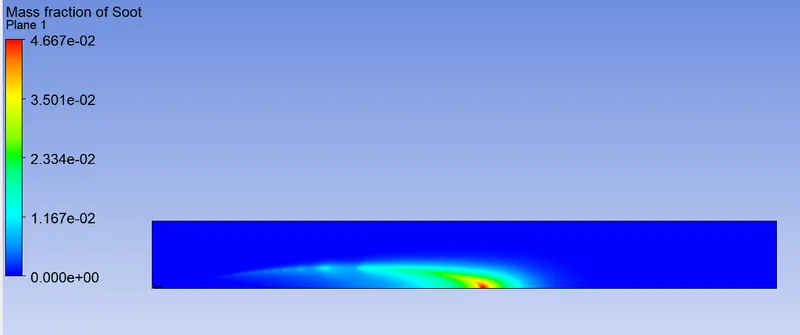
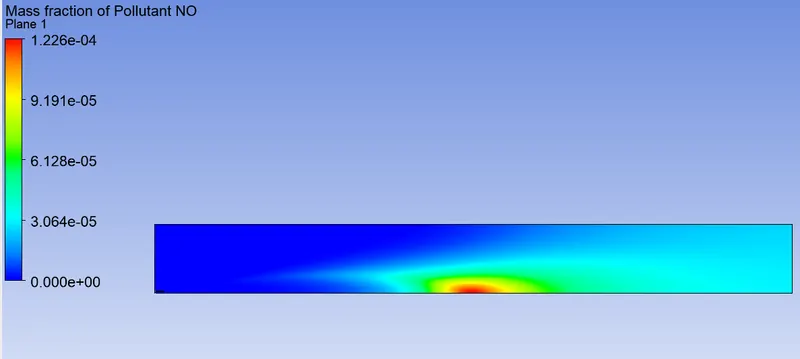
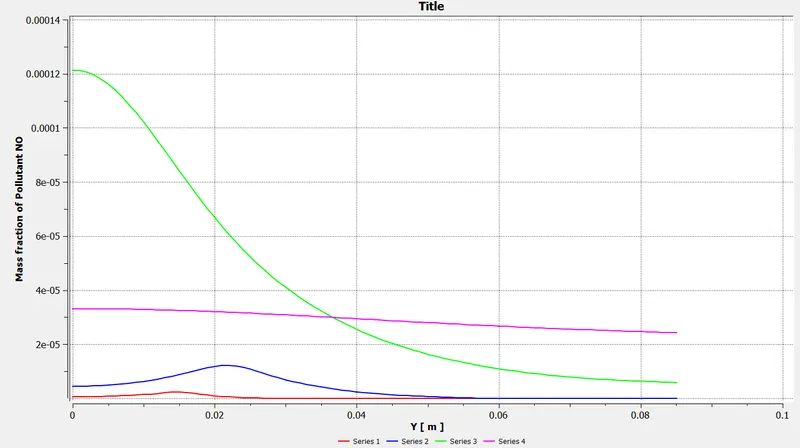
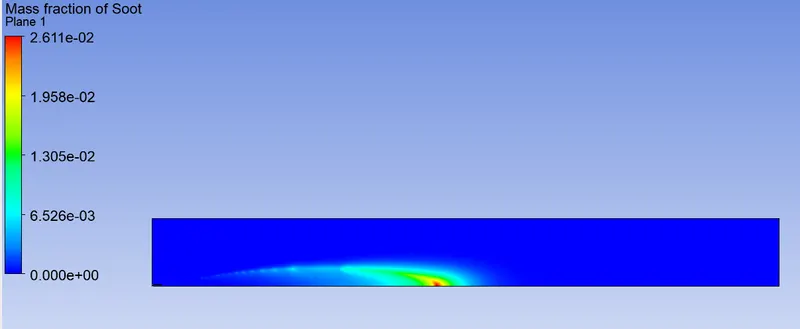
- The pollutant like NOx and Soot formation is observed in the contour plot.
- The mass fraction of pollutant no of NOx=5.8466e−55.8466e-5
- The mass fraction of soot =0.00146030.0014603
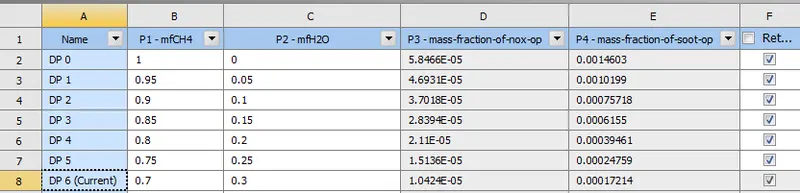
Part 2) In the part 2 simulation we use parametric study and add the water content in the fuel from 5% to 30% by mole.
Results :
1) Adding 5 % of water [95% methane +5% water]
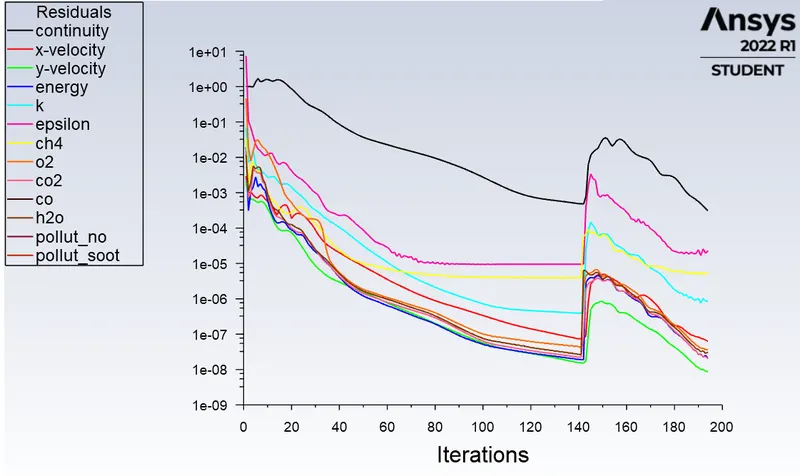
Residual plot:
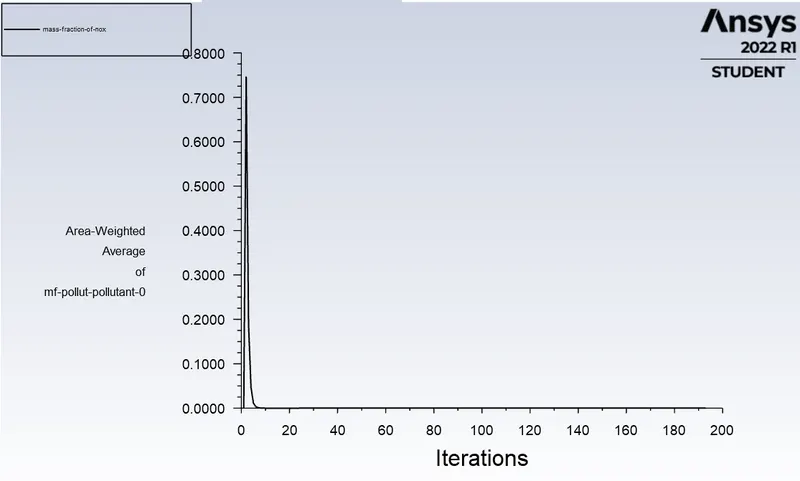
Mass fraction of pollutant No. of NOx plot:
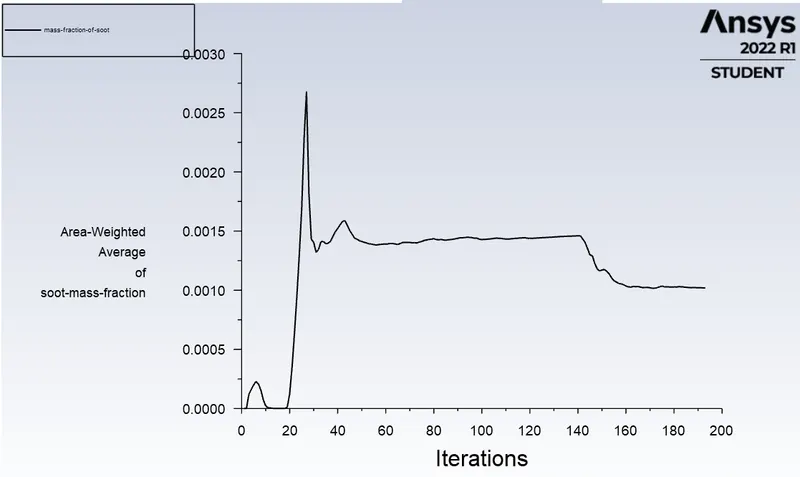
Mass fraction of soot plot:
Temperature contour :
Pollutant NOx mass fraction :
Mass fraction of soot :
2) Adding 10 % of water [90% methane +10% water]
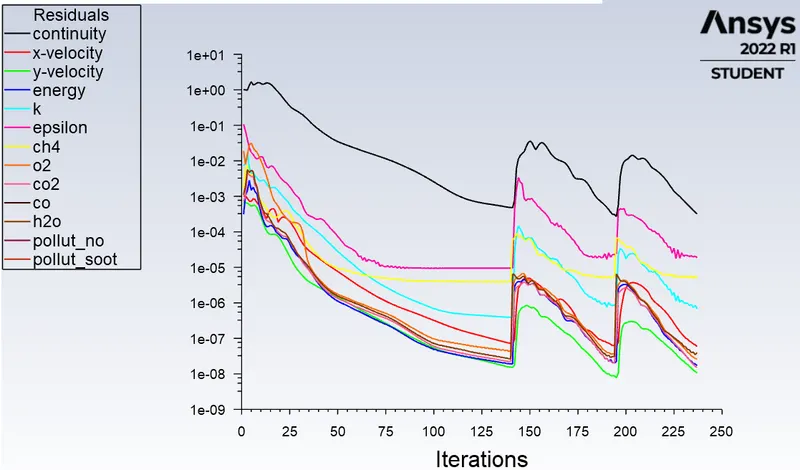
Residual plot:
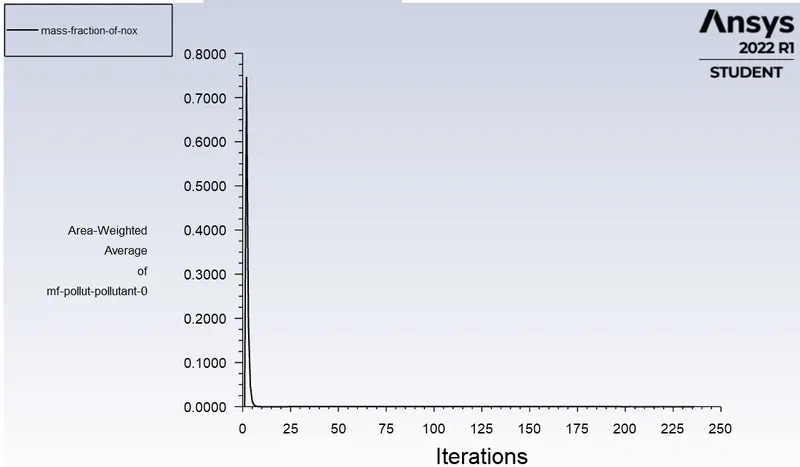
Mass fraction of pollutant No. of NOx plot:
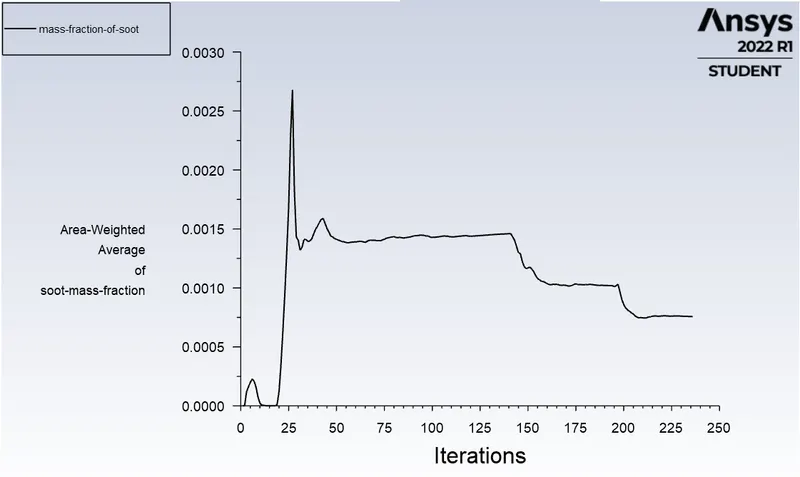
Mass fraction of soot plot:
Temperature contour :
Pollutant NOx mass fraction :
Mass fraction of soot :
3) Adding 15 % of water [85% methane +15% water] :
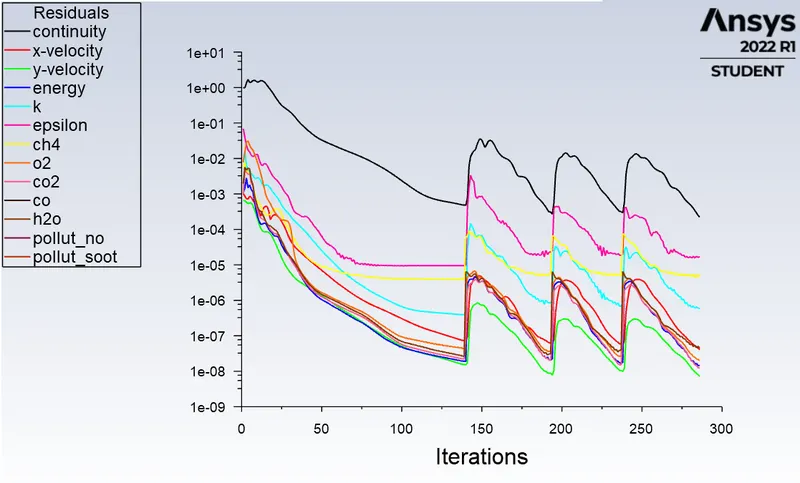
Residual plot:
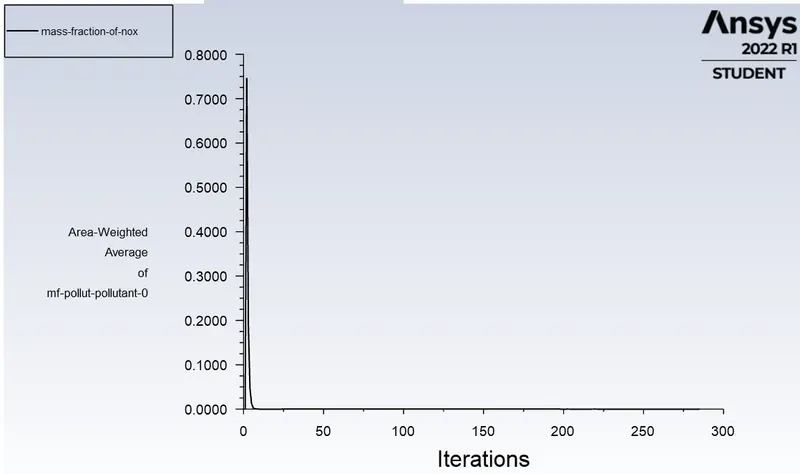
Mass fraction of pollutant No. of NOx plot:
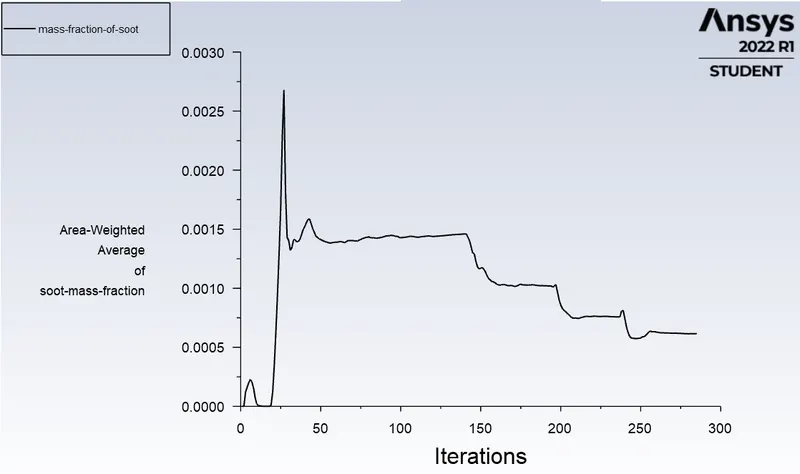
Mass fraction of soot plot :
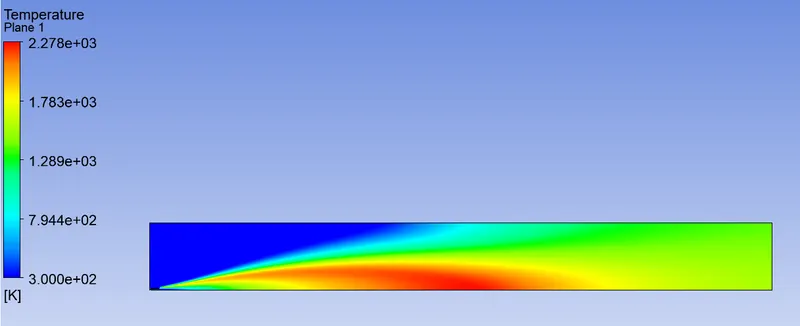
Temperature contour :
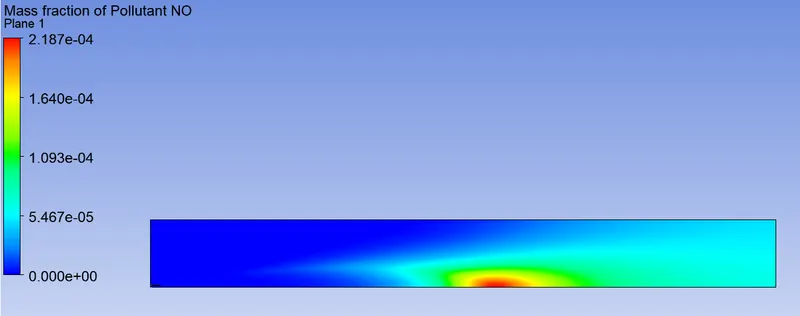
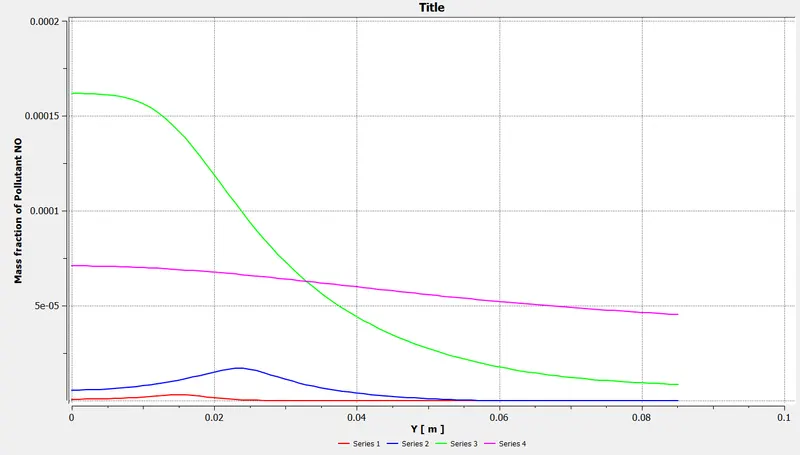
Pollutant NOx mass fraction :
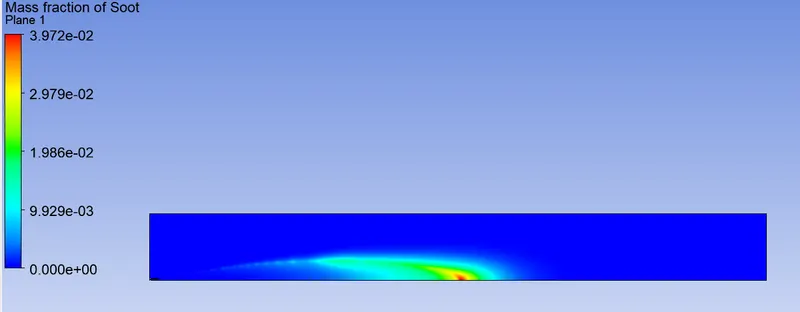
Mass fraction of Soot :
4) Adding 20 % of water [80% methane +20% water] :
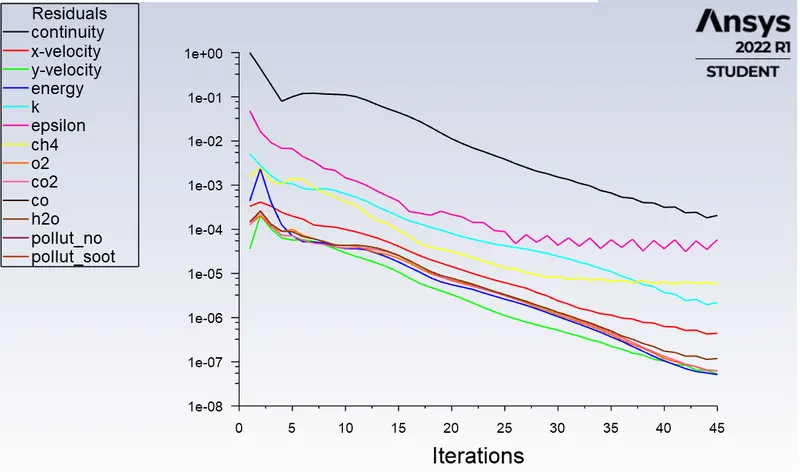
Residual plot:
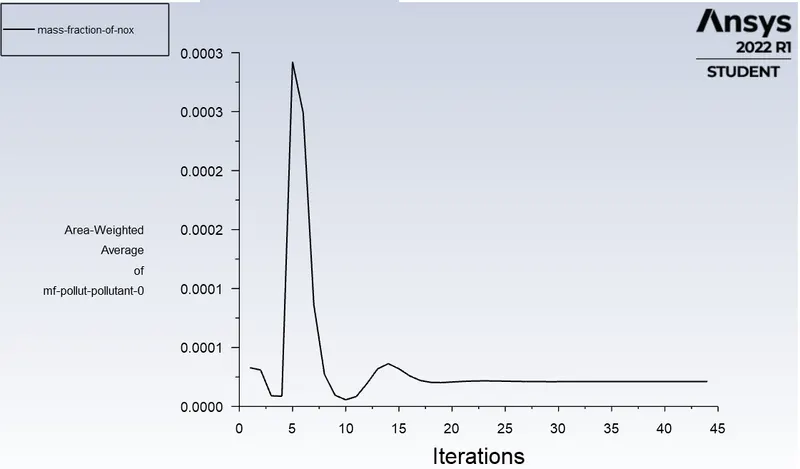
Mass fraction of pollutant No. of NOx plot:
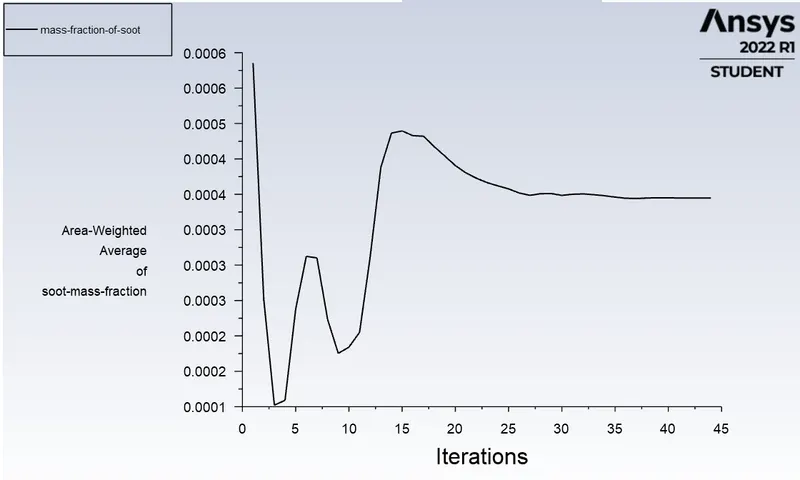
Mass fraction of soot plot:
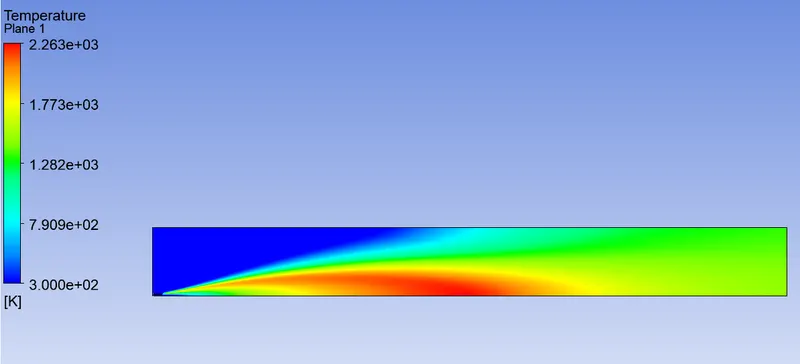
Temperature contour :
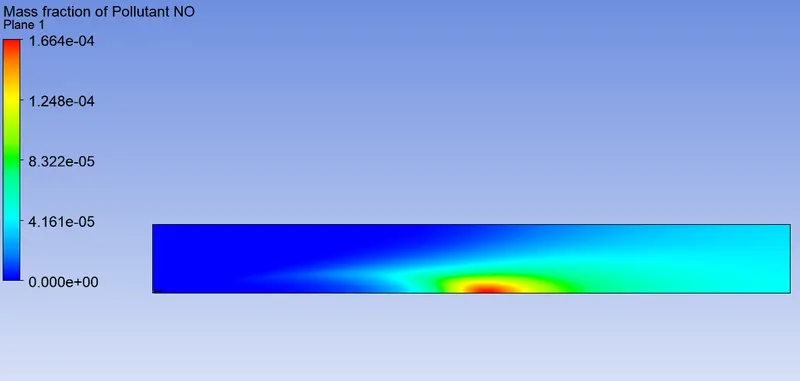
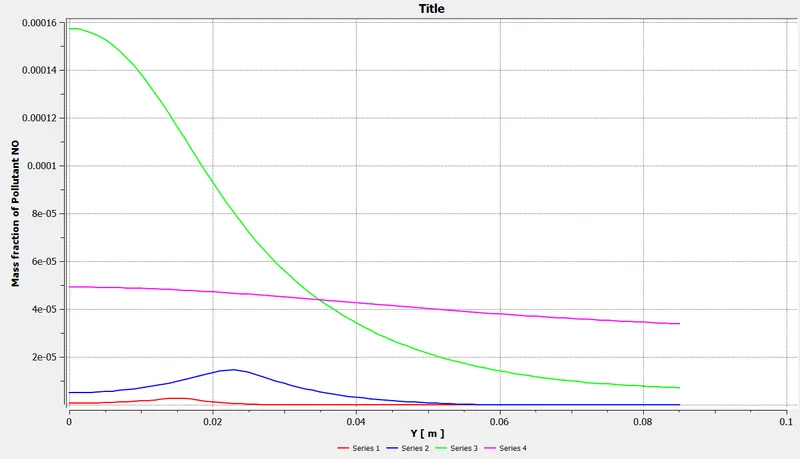
Pollutant NOx mass fraction :
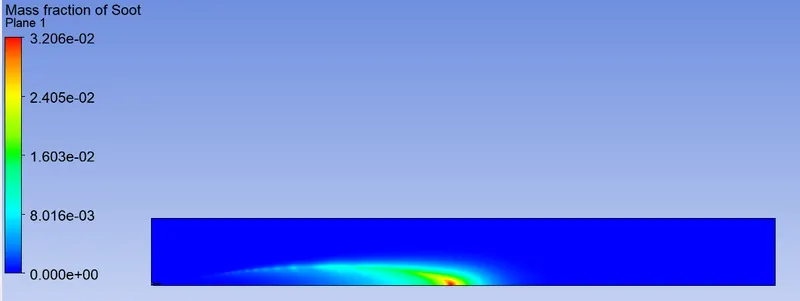
Mass fraction of soot :
5) Adding 25 % of water [75% methane +25% water] :
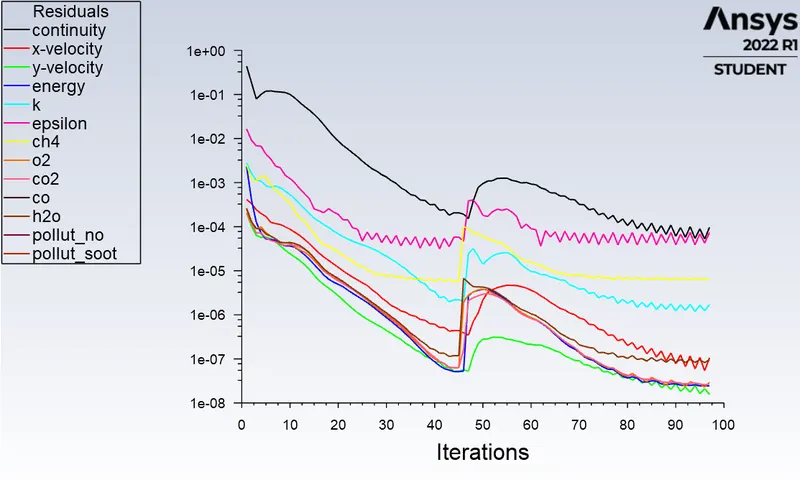
Residual plot :
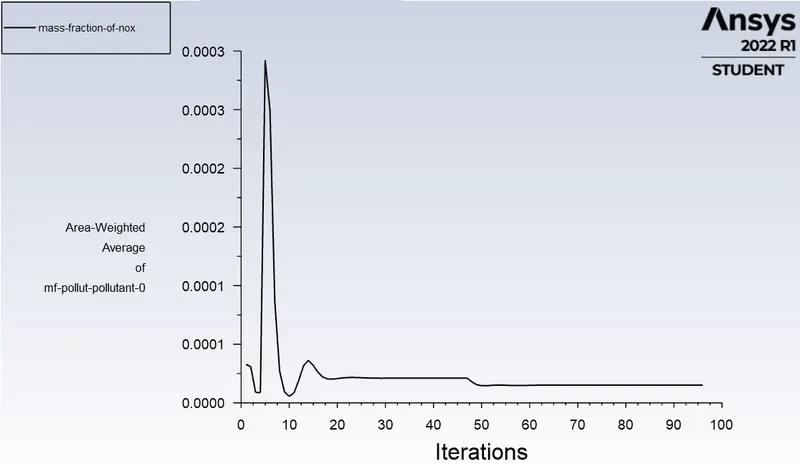
Mass fraction of Nox plot :
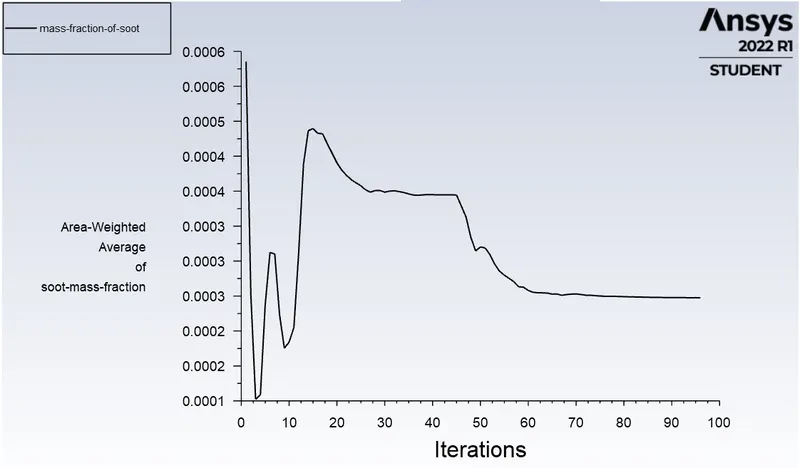
Mass fraction of soot plot :
Temperature contour :
Pollutant NOx mass fraction :
Mass fraction of soot :
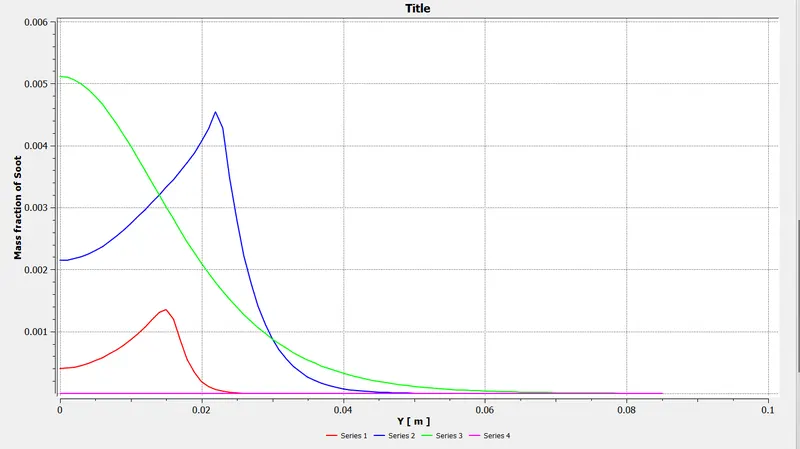
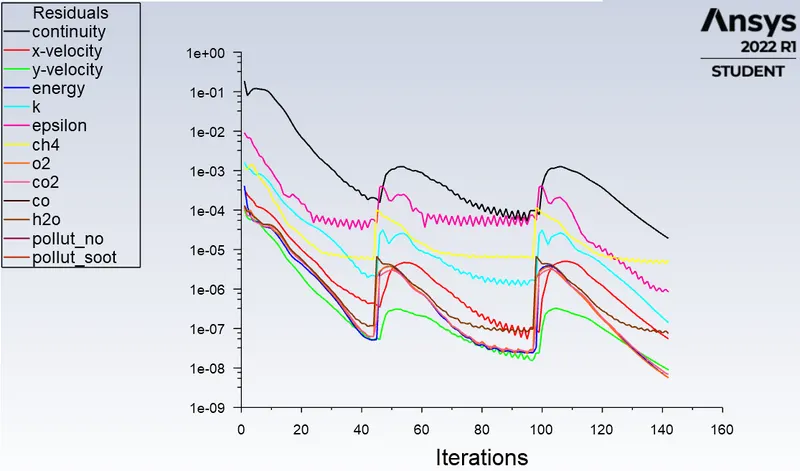
6) Adding 30 % of water [70% methane +30% water] :
Residual plot :
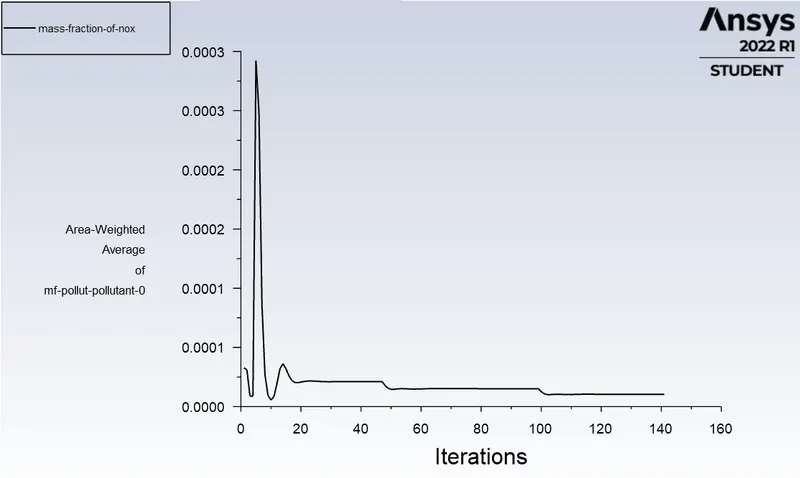
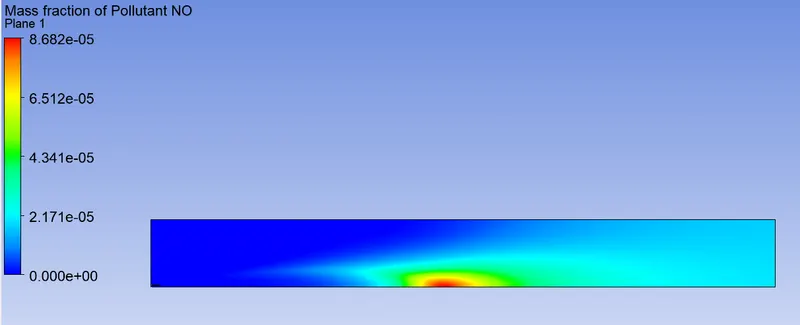
Mass fraction of Nox plot :
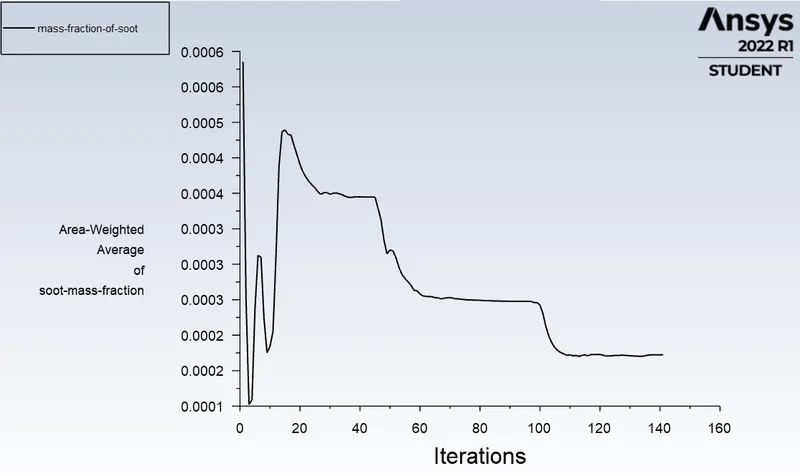
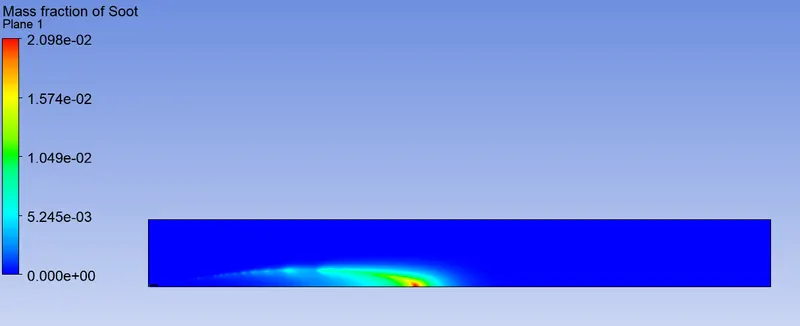
Mass fraction of Soot plot :
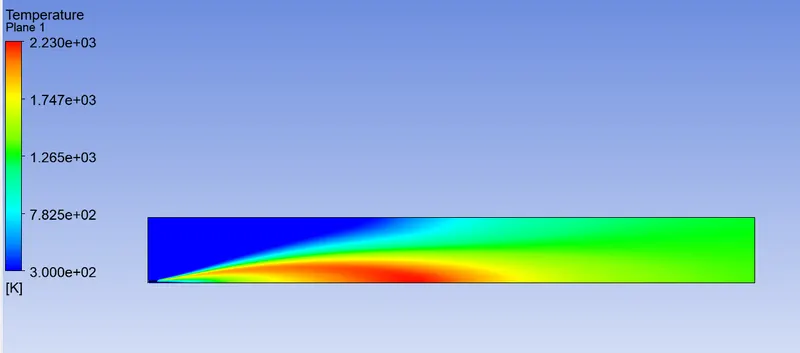
Temperature contour :
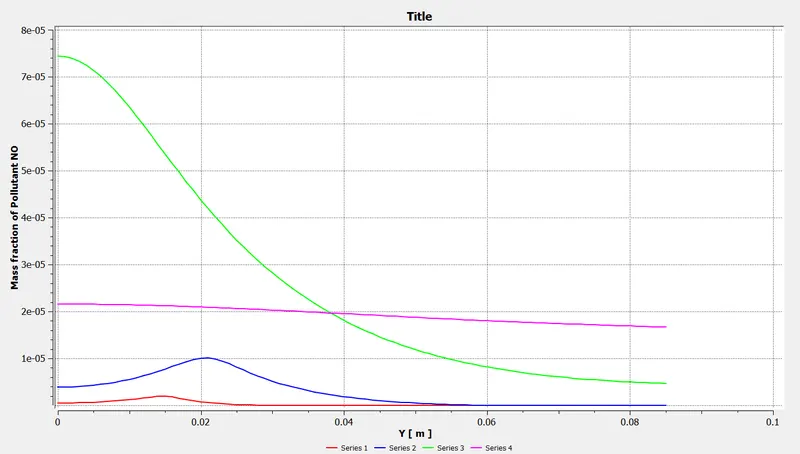
Pollutant NOx mass fraction :
Mass fraction of soot :
Parametric Result Table :
Conclusions :
| Sr No | CH4 Mass fraction | H2O mass fraction | NOx mass fraction | Soot mass fraction |
| 1 | 1 | 0 | 5.8466e−55.8466e-5 | 0.0014603 |
| 2 | 0.95 | 0.05 | 4.6931e−54.6931e-5 | 0.0010199 |
| 3 | 0.9 | 0.1 | 3.7018e−53.7018e-5 | 0.00075718 |
| 4 | 0.85 | 0.15 | 2.8394e−52.8394e-5 | 0.0006155 |
| 5 | 0.8 | 0.2 | 2.11e−52.11e-5 | 0.00039461 |
| 6 | 0.75 | 0.25 | 1.5136e−51.5136e-5 | 0.00024759 |
| 7 | 0.7 | 0.3 | 1.0424e−51.0424e-5 | 0.00017214 |
- The eddy dissipation model help us to simulate combustion process without the presence of ignition source .
- Adding water content in the fuel by 5% to 30% by mole leads to decrease in temperature,NOx emission and soot formation.
- The mass fraction of pollutants like NOx and soot decreases as the water content in the fuel is increased.