Week 10 - Simulating Combustion of Natural Gas.
Aim: To carry out combustion simulation and observe the changes with addition of water in the combustion.
Theory:
- Combustion usually takes place with the ignition of fuel in presence of air. This is global reaction.
- There are intermediate reactions taking place. If we know the rate of forward and reverse reaction of these intermediate reactions, we can find the path taken by these reactions for combustion to take place.
- There are several models proposed for carring out the combustion simulation.
- The Finite Rate Chemistry Model solves bunch of Ordinary Differential Equations to simulate the combustion with high accuracy but with a trade off with time - it takes lot of time to solve the equation with a finer mesh.
- The Eddy Dissipation Model is a faster process to carry out a combustion simulation if one is only interested in the final result and not the intermediary solution.
- It acctuates the combustion when some value of turbulence is achieved and the time scale is calculated according to which the combustion initiates.
- This could go wrong if the values reach before the combustion even starts. (When one needs to calculate the ignition delay - not the right model for ignition delay).
- This is where Finite Rate Eddy Dissipation Model comes into picture. It choses the model according to the combustion properties such as turbulence and ODEs.
Part 1:
Perform a combustion simulation on the combustor model and plot the variation of the mass fraction of the different species’ in the simulation using line probes at different locations of the combustor. You need to plot for CO2, H2O, CH4, N2, O2, NOx emissions & Soot formation.
Part 2:
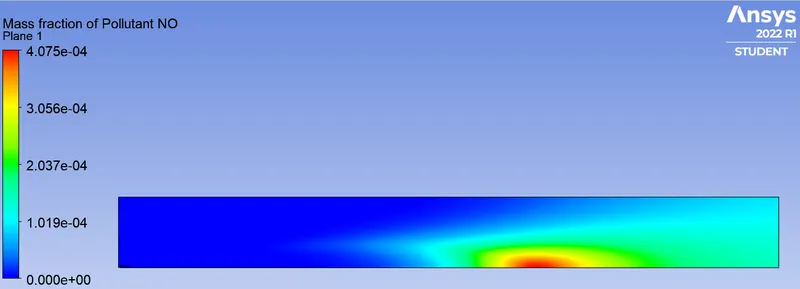
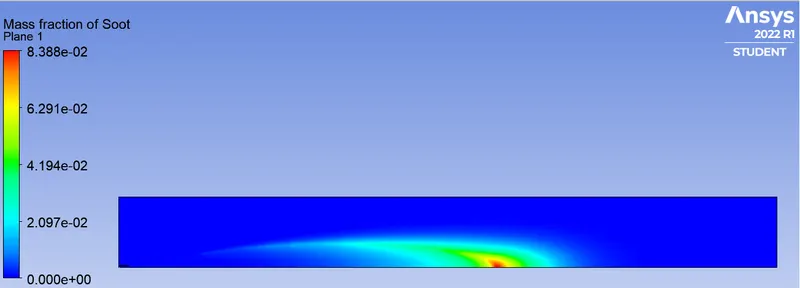
As you must have observed from the above simulation, the Nox and soot is getting formed at the outlet of the combustor. Such formation has harmful effects on the environment and humans. The stringent government norms also demand the least formation of Nox and soot and to satisfy those requirements, you need to check the effect of adding the water in the fuel.
In this part, you need to add the water content in the fuel from 5% to 30% by mole and observe the effect of it on the results. It is necessary to provide line plots and contours to prove your claim.
You can use the parametric study approach if required.
Note:-
1. Use methane-air-2step as a mixture material than methane-air. [It allows to add water in the fuel or air]
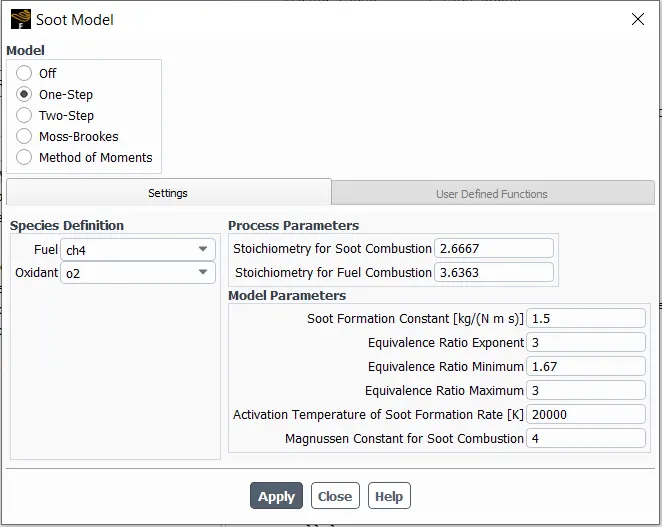
2. Use a one-step soot model to calculate the soot formation.
Procedure:
Part 1:
Geomery Creation:
- Initial geometry:
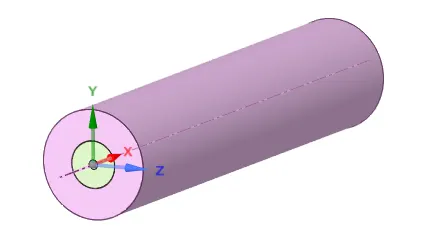
- Select combine option. (Design --> Combine).
- Select all bodies and combine.
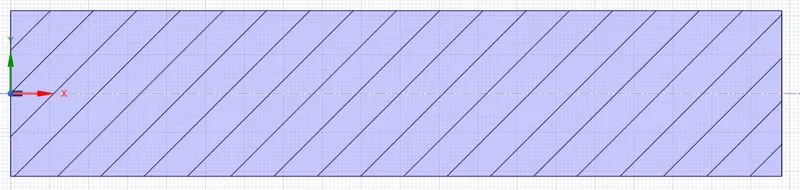
- Select the mid plane (y-normal) and the front plane (z-normal) to split the geometry into quater.
- Then select the z normal face, copy and paste it into a new design workspace. Final output should be a 2D geometry.

- Then give the name selections.
- Geometry creation is same for all the cases.
Meshing:
- Select method sizing and chose method as triangles.
- Keep element size as 1 mm.

- Meshing is same for all the cases.
Setting up the Physics:
- In General tab select Axisymmetric.
- Viscous Model - k-epsilon, Standard, standard wall function,
- Select Species Model. Select Species Transport.
- For mixture-material select Methane-Air.
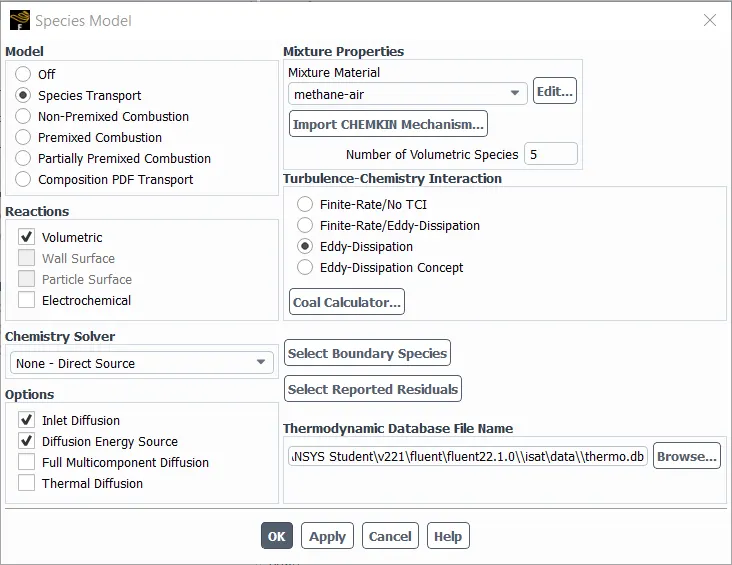
- Select Voumetric, inlet diffusion, diffusion energy source and Eddy Dissipation model.
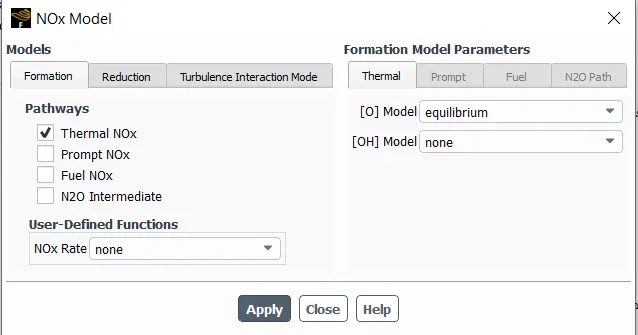
- Hover over to outline view and enable NOx and soot model.
- For NOx,
- For soot,
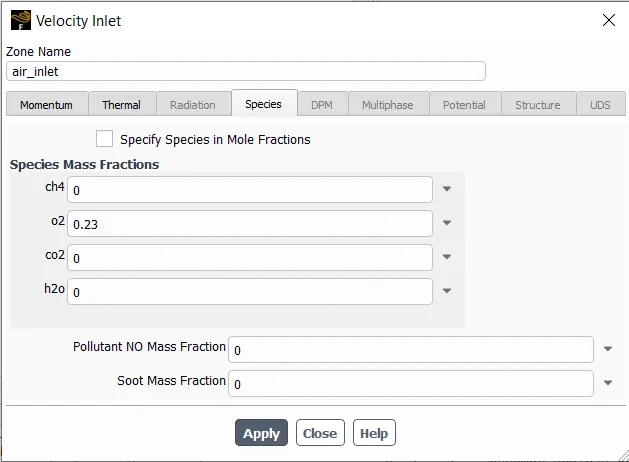
- Go to Boundaries tab and select air_inlet.
- Specify a velocity of 0.5 m/s and in species tab assign a mass fraction value of 0.23 for O2 and rest as 0.
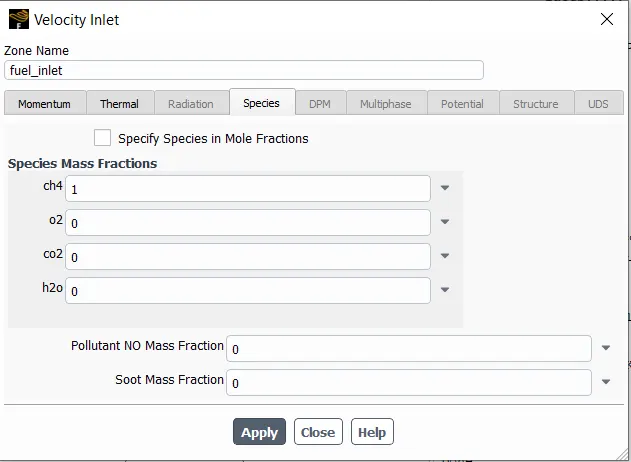
- Select fuel_inlet. Assign velocity value of 80 m/s and for species assign 1 for CH4 and rest as 0.
- Go to solutions and then report defination.
- Generate a Surface Area Weighted Average for NOx and Soot.
- Hybrid Initialize and then run it for 600 iteration.
Part 1:
Results:
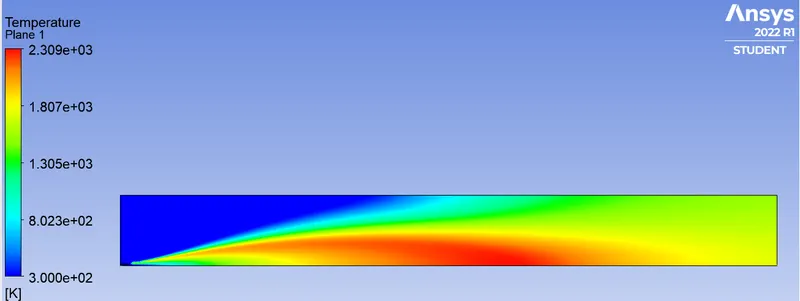
- Temperature Contour:
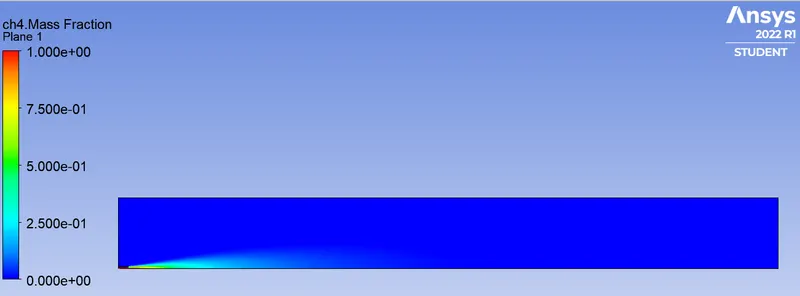
- CH4 Mass Fraction:
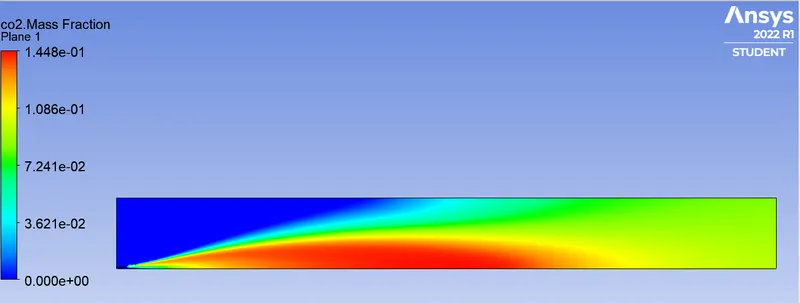
- CO2 Mass Fraction:
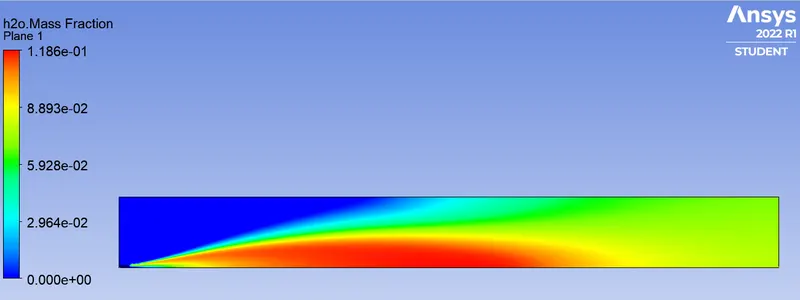
- H2O Mass Fraction:
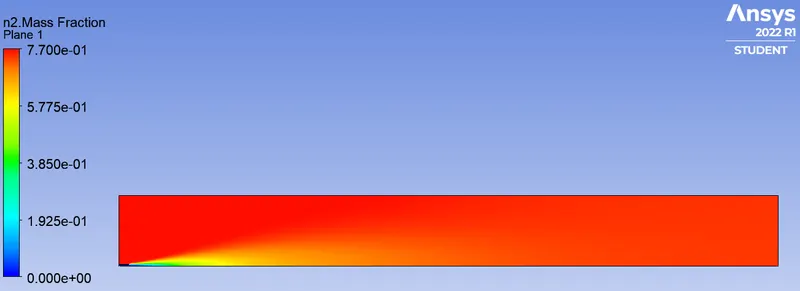
- N2 Mass Fraction:
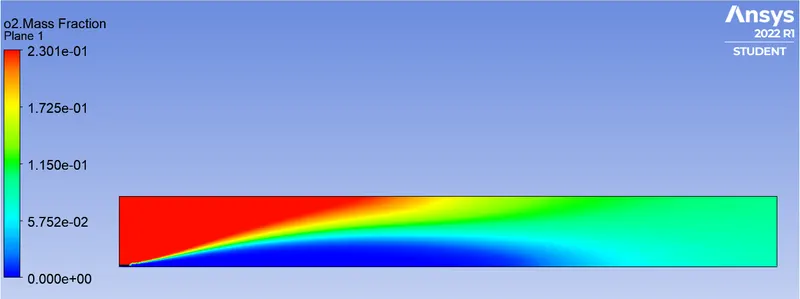
- O2 Mass Fraction:
- NOx Mass Fraction:
- Soot Mass Fraction:
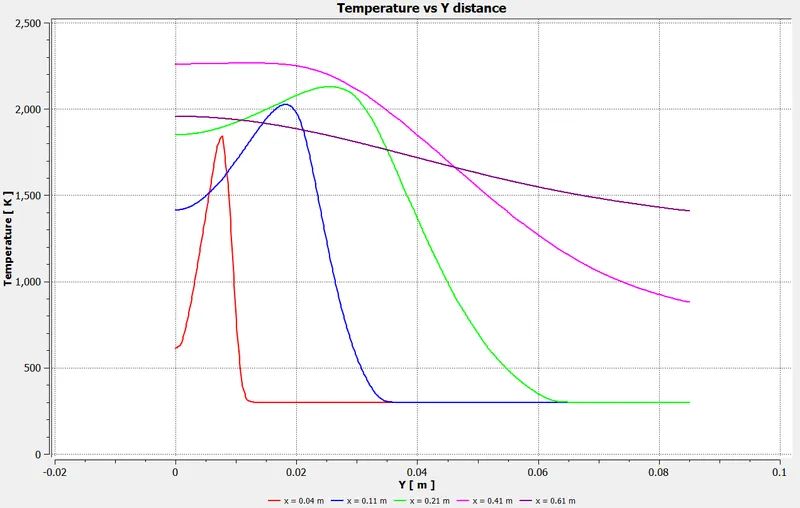
- Temperature vs Y-distance Graph at different X location:
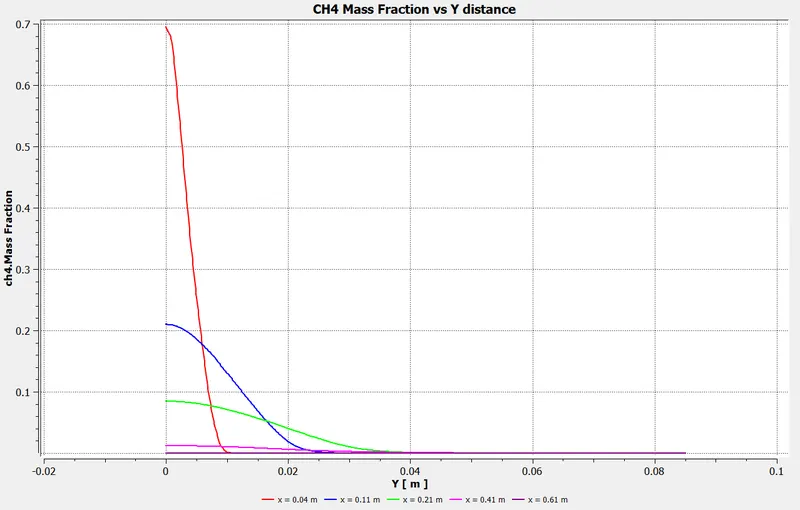
- CH4 Mass Fraction vs Y-distance Graph at different X location:
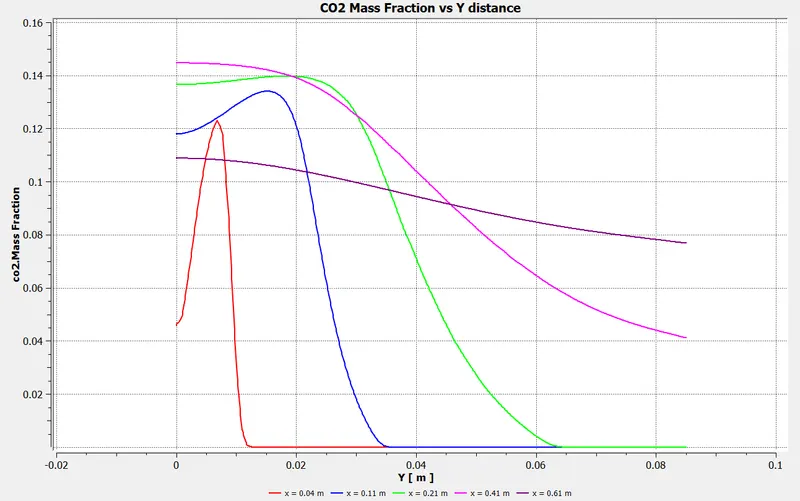
- CO2 Mass Fraction vs Y-distance Graph at different X location:
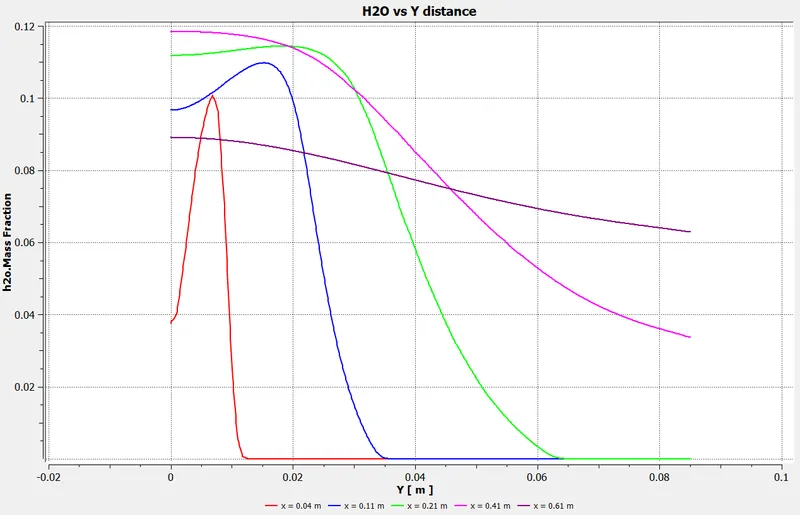
- H2O Mass Fraction vs Y-distance Graph at different X location:
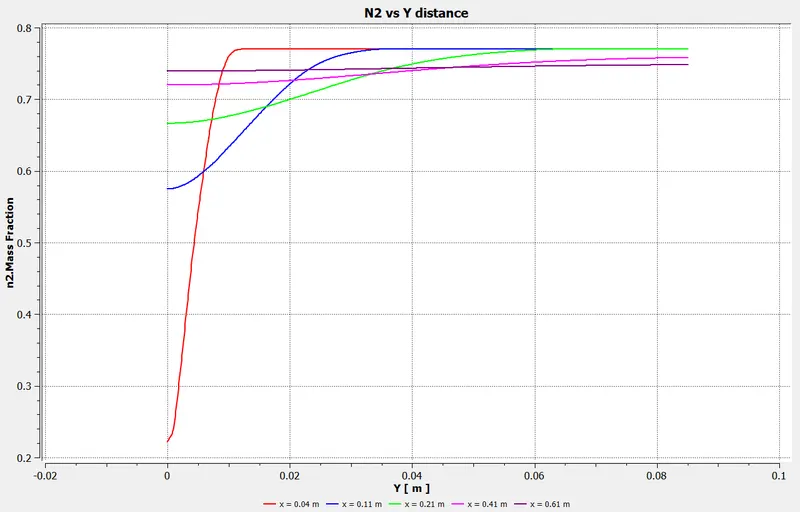
- N2 Mass Fraction vs Y-distance Graph at different X location:
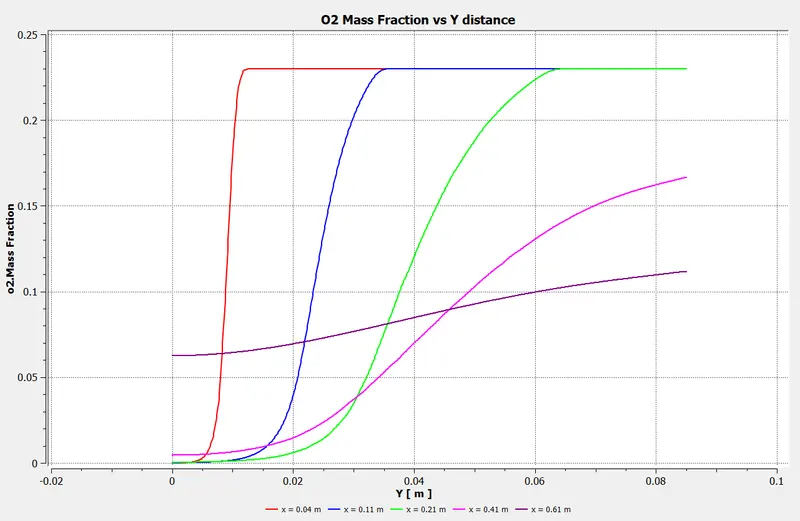
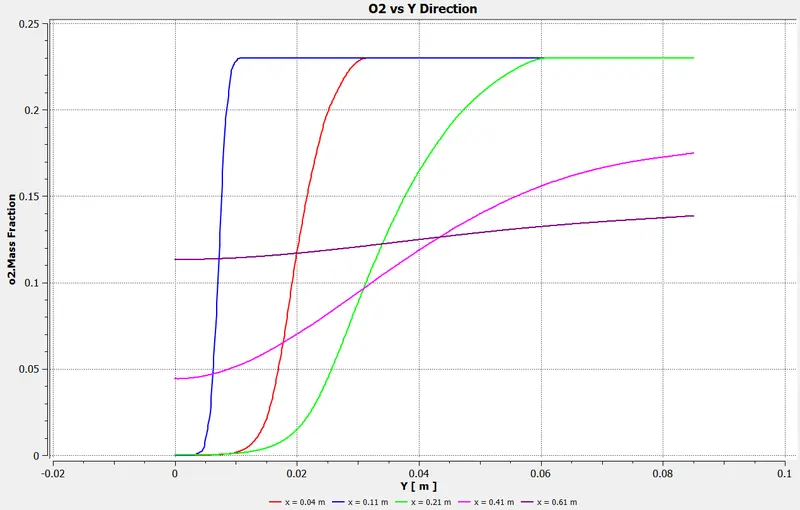
- O2 Mass Fraction vs Y-distance Graph at different X location:
Part 2:
Simulation Procedure:
- Changes are only in the species and boundary condition.
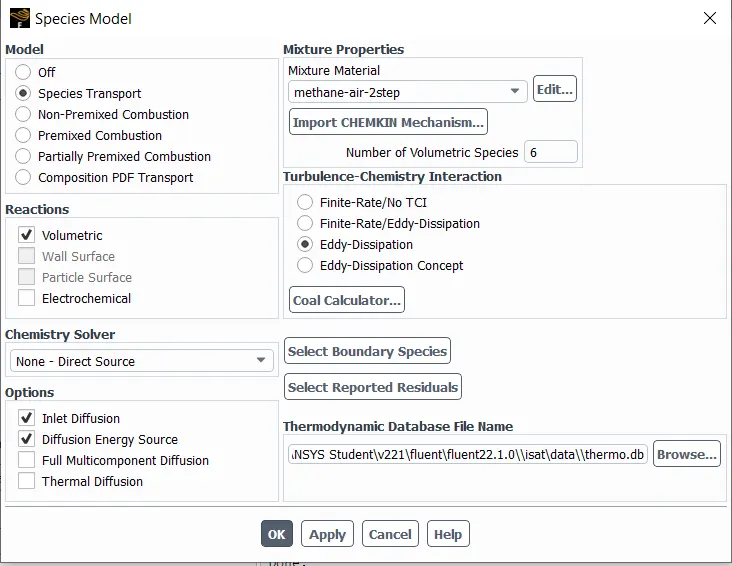
- In species tab change mixture material to methane-air 2-step. Rest is same.
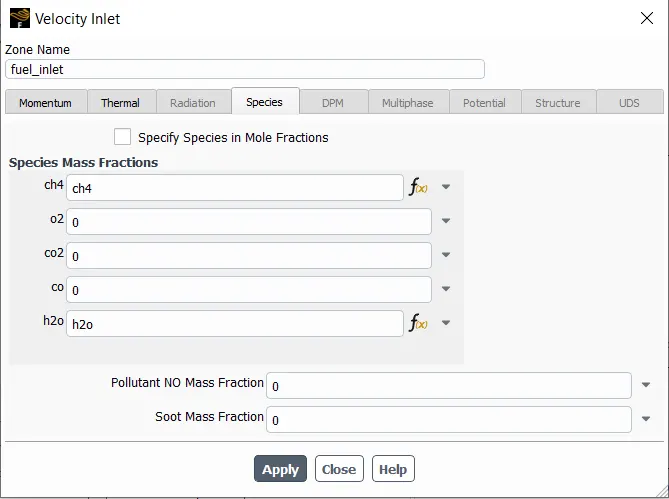
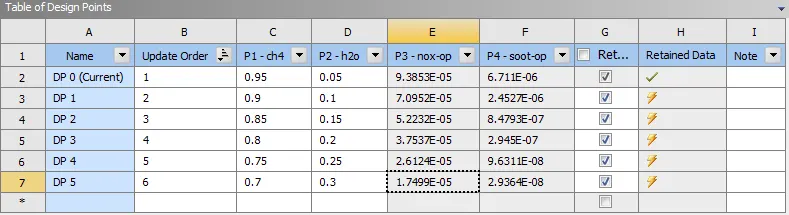
- In boundaries tab, select fuel_inlet and create input parameter for CH4 and H20.
- We will be varying the mass fraction of CH4 and H2O.
- Parametric study is applied.
Part 2:
Results:
Case 1: 5% Water
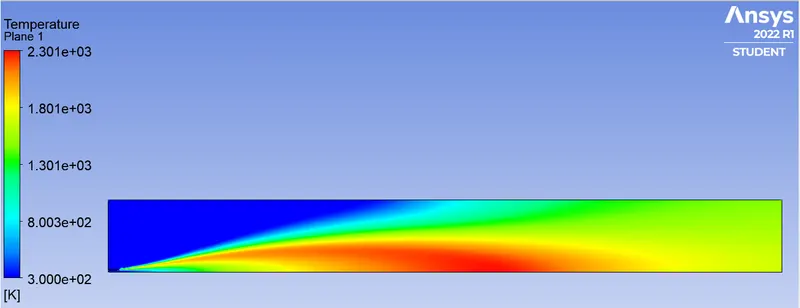
- Temperature Contour:
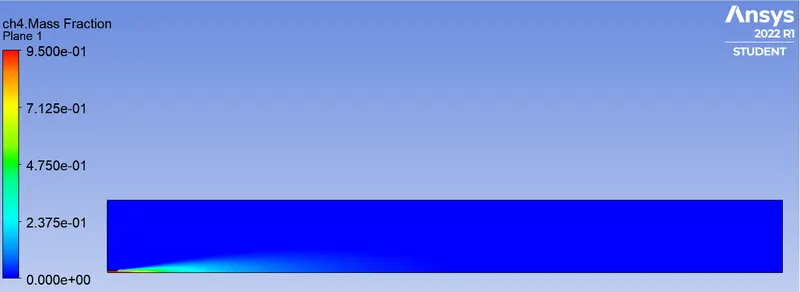
- CH4 Mass Fraction:
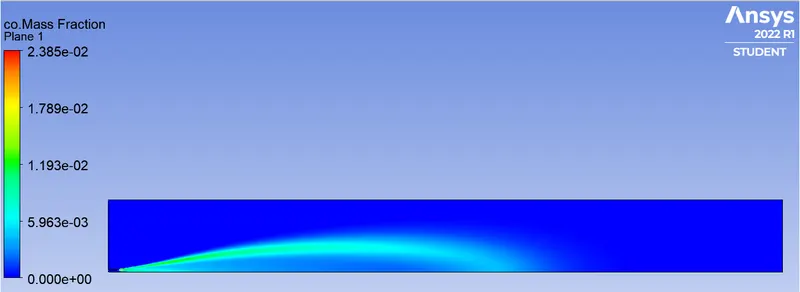
- CO Mass Fraction:
- CO2 Mass Fraction:
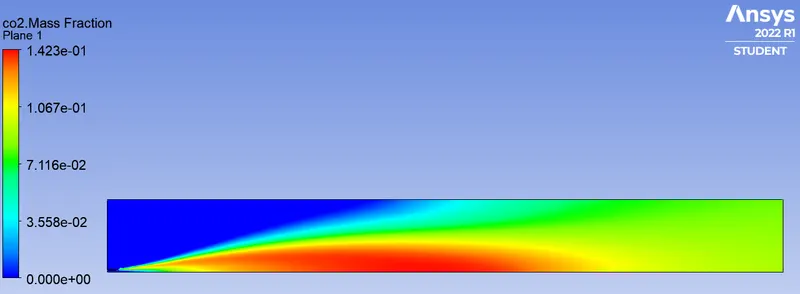
- H2O Mass Fraction:
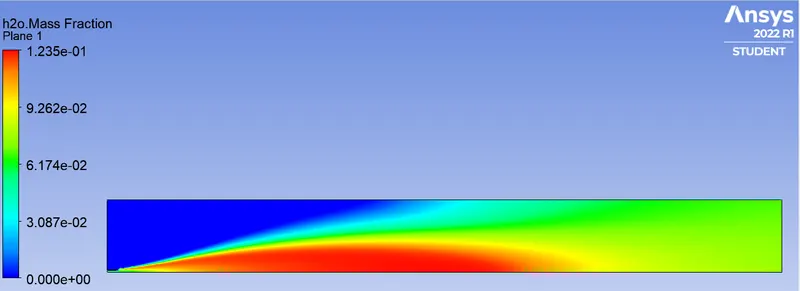
- N2 Mass Fraction:
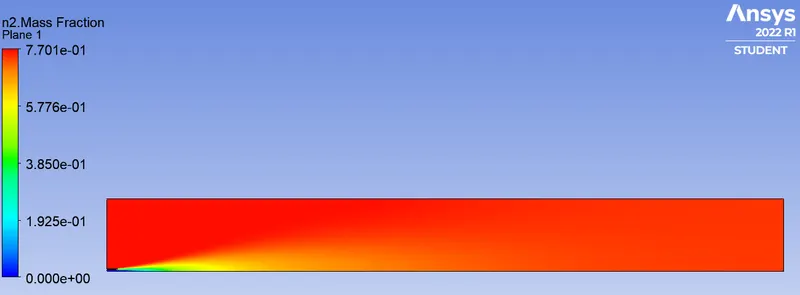
- O2 Mass Fraction:
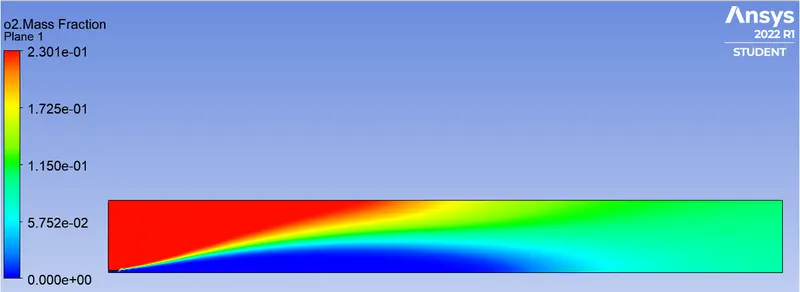
- NOx Mass Fraction:
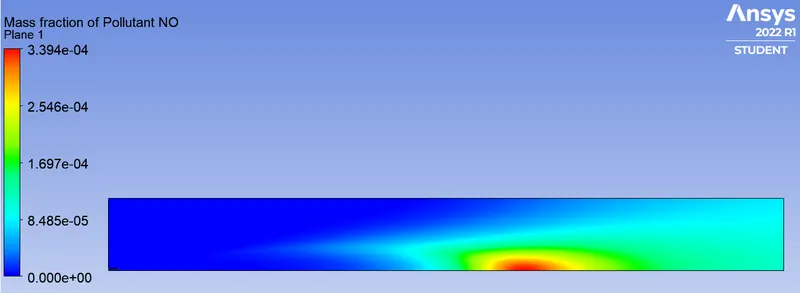
- Soot Mass Fraction:
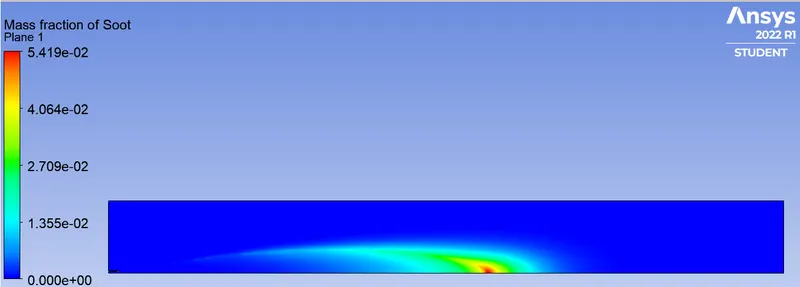
- Temperature vs Y-distance Graph at different X location:
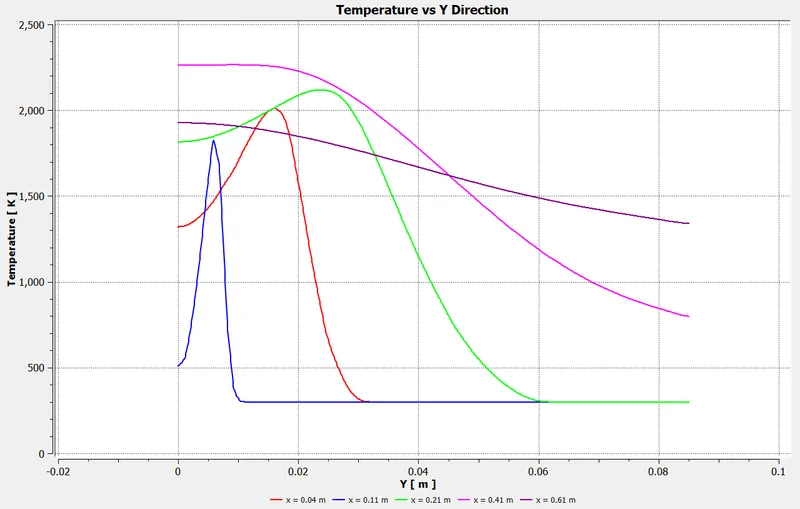
- CH4 Mass Fraction vs Y-distance Graph at different X location:
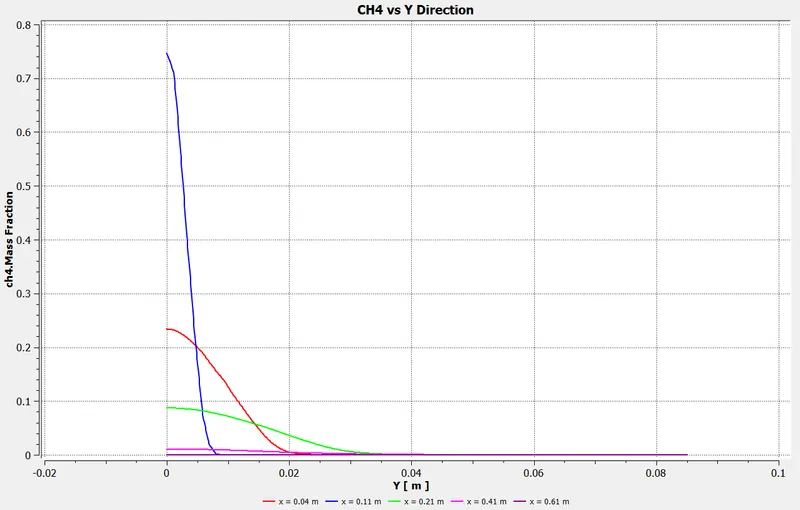
- CO Mass Fraction vs Y-distance Graph at different X location:
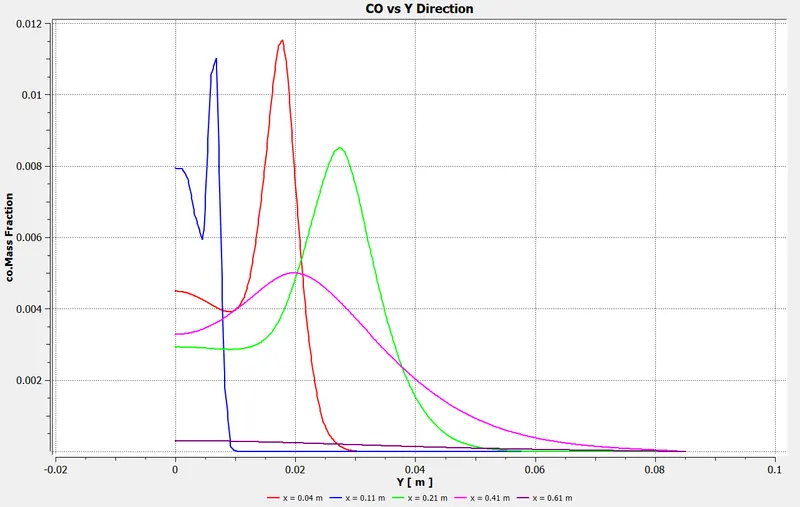
- CO2 Mass Fraction vs Y-distance Graph at different X location:
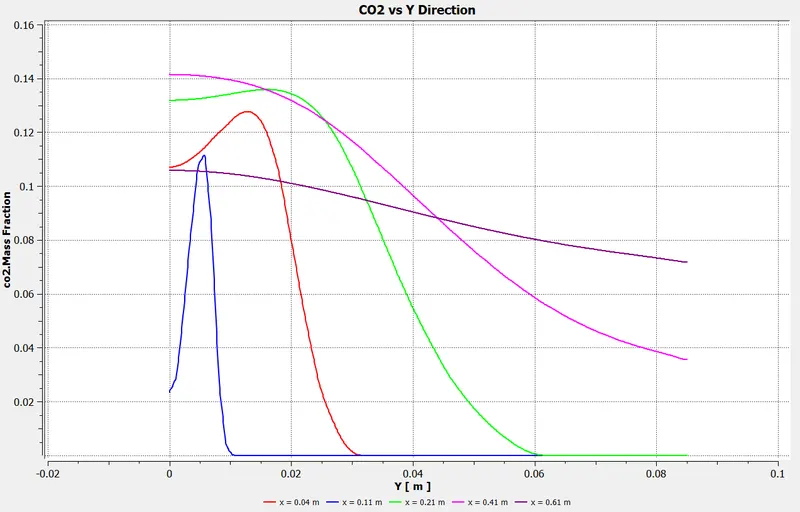
- H2O Mass Fraction vs Y-distance Graph at different X location:
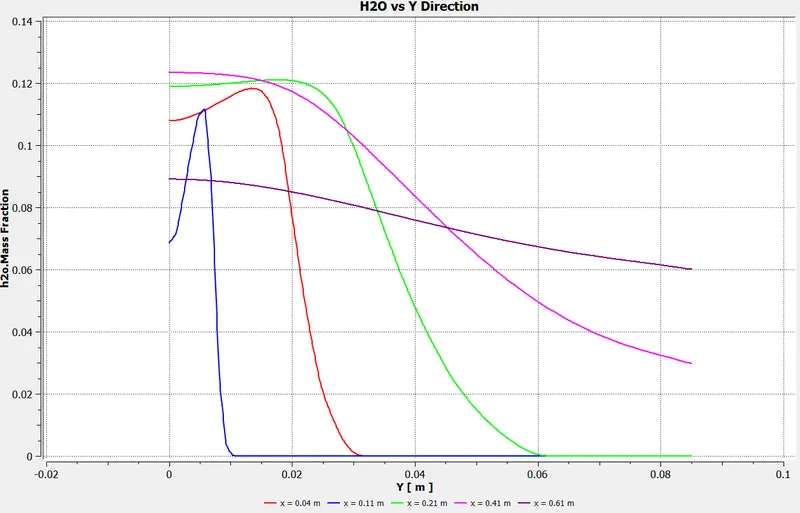
- N2 Mass Fraction vs Y-distance Graph at different X location:
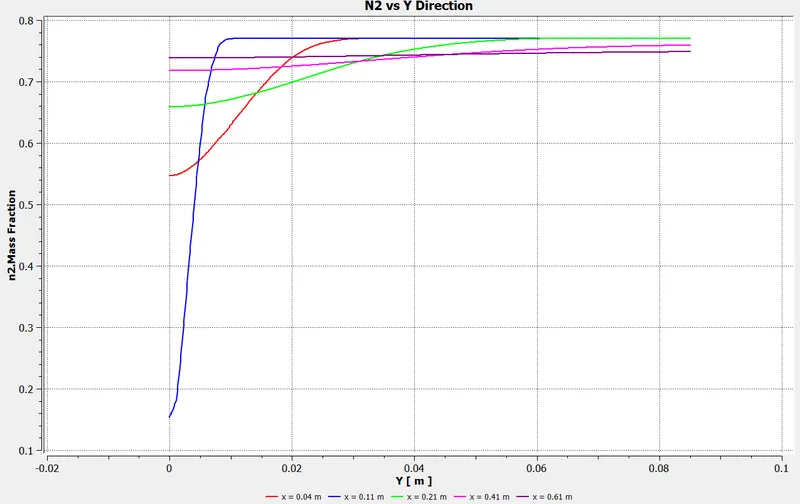
- O2 Mass Fraction vs Y-distance Graph at different X location:
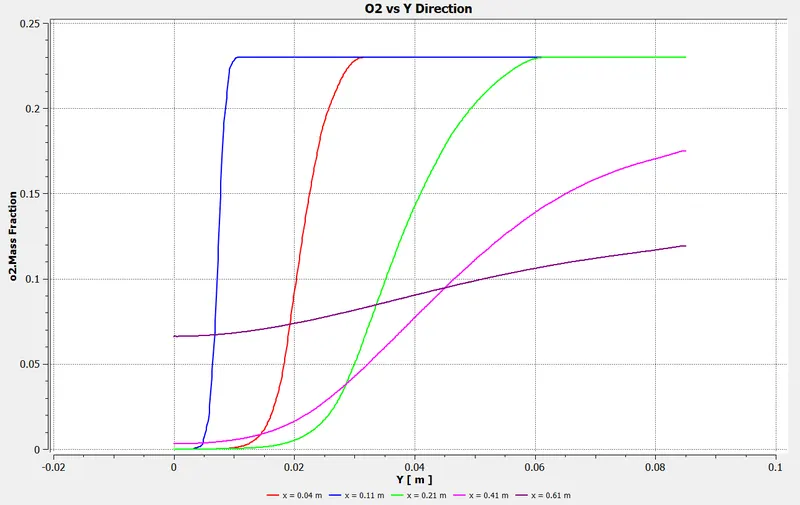
Case 2: 10% Water
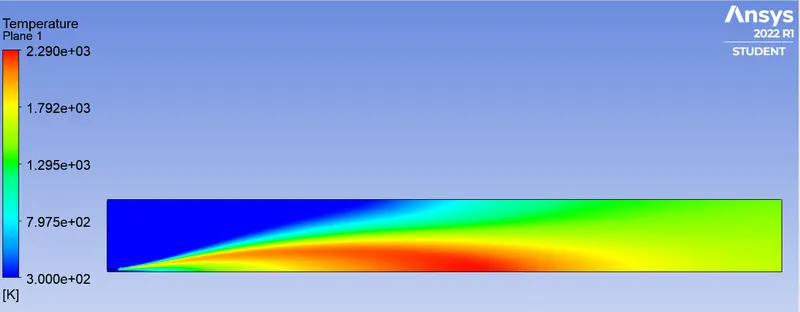
- Temperature Contour:
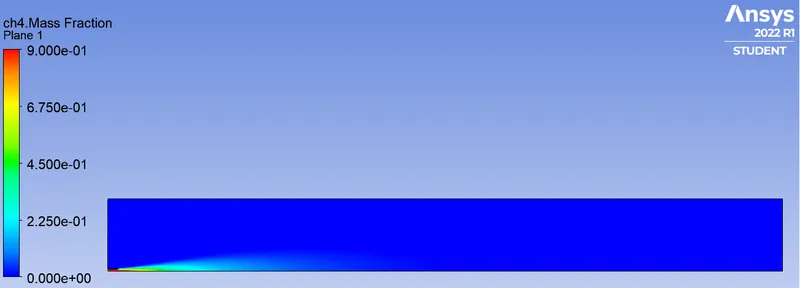
- CH4 Mass Fraction:
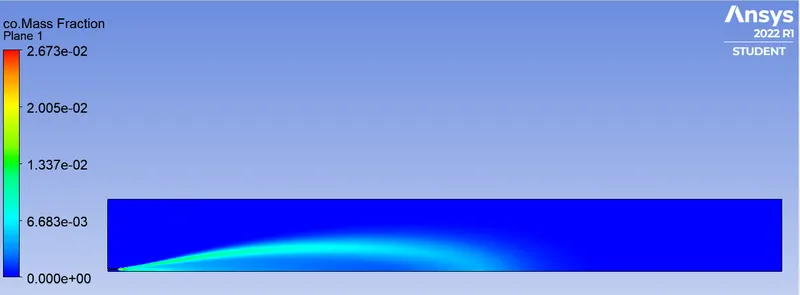
- CO Mass Fraction:
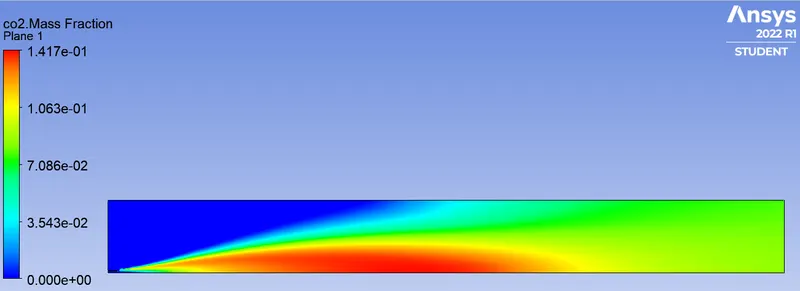
- CO2 Mass Fraction:
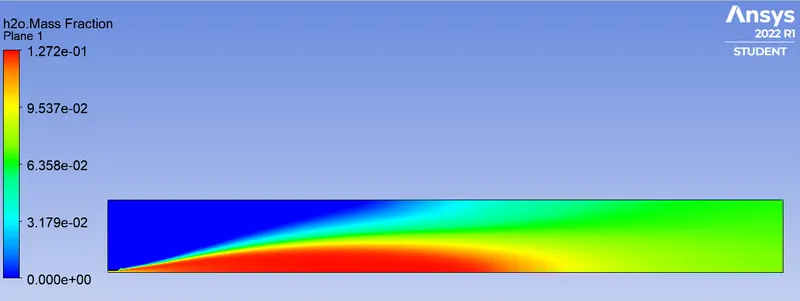
- H2O Mass Fraction:
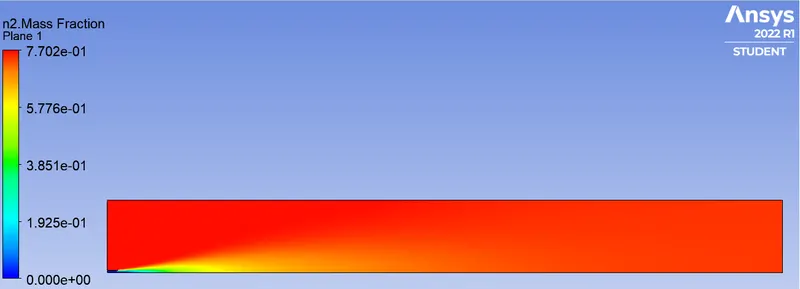
- N2 Mass Fraction:
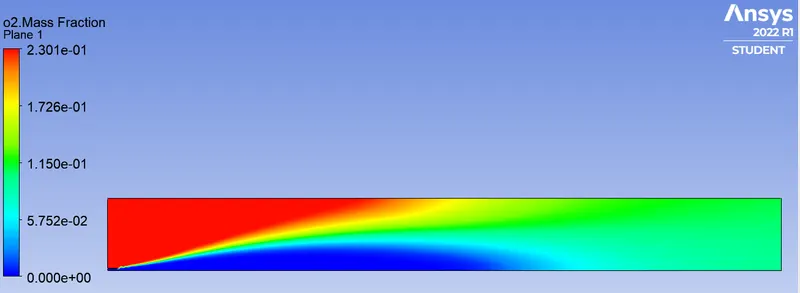
- O2 Mass Fraction:
- NOx Mass Fraction:
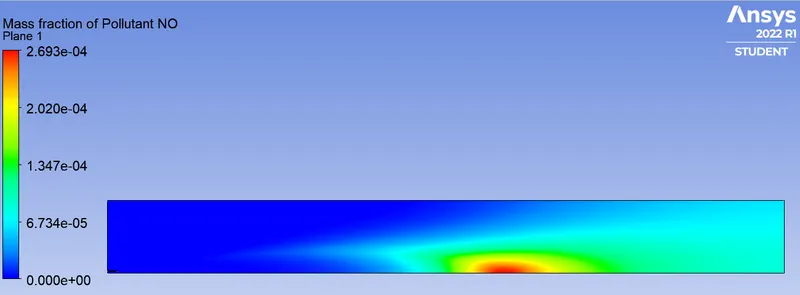
- Soot Mass Fraction:
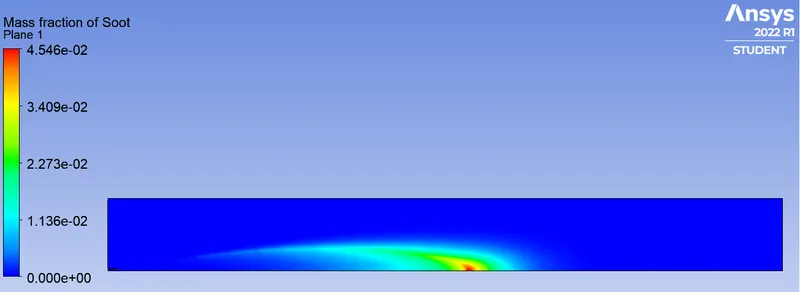
- Temperature vs Y-distance Graph at different X location:
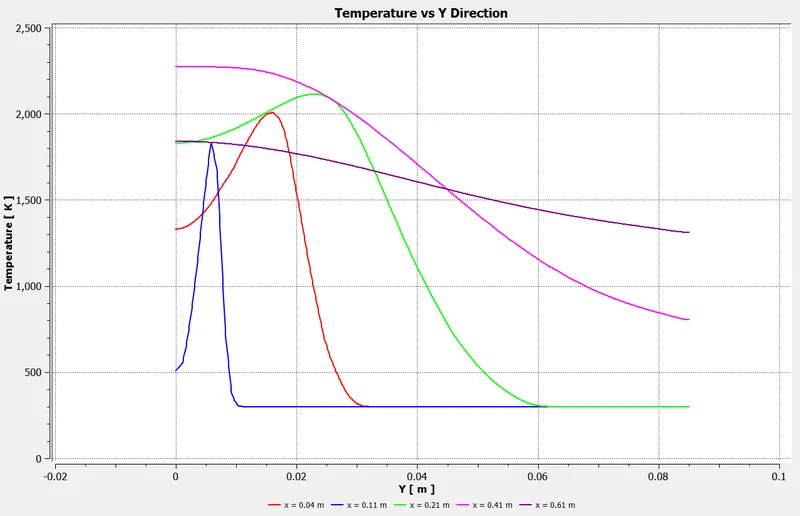
- CH4 Mass Fraction vs Y-distance Graph at different X location:
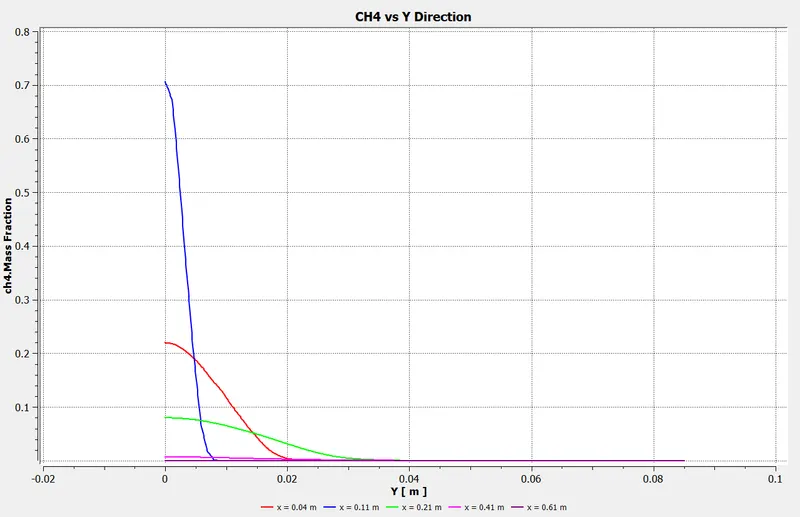
- CO Mass Fraction vs Y-distance Graph at different X location:
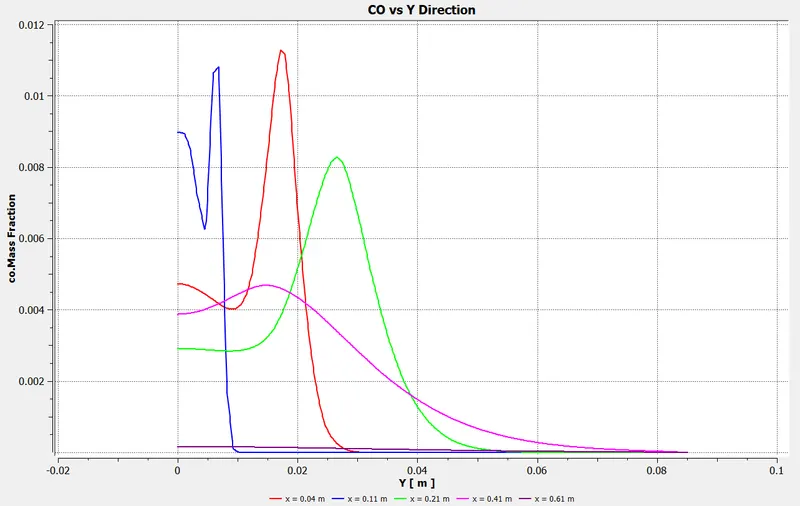
- CO2 Mass Fraction vs Y-distance Graph at different X location:
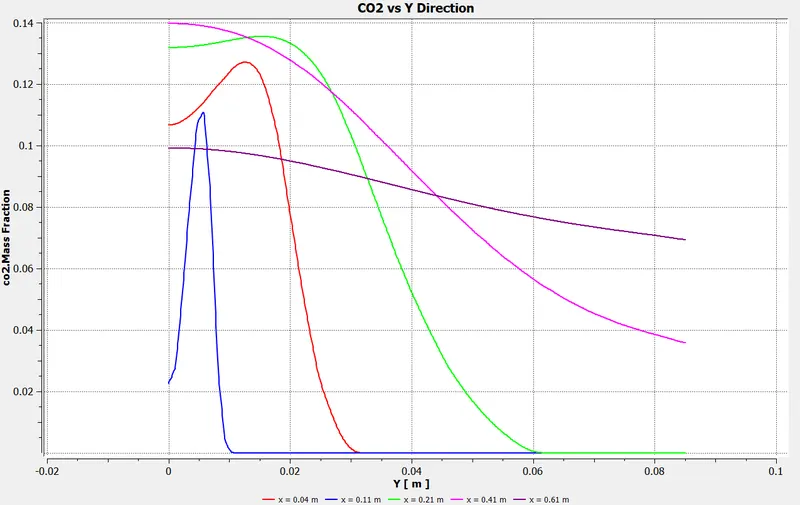
- H2O Mass Fraction vs Y-distance Graph at different X location:
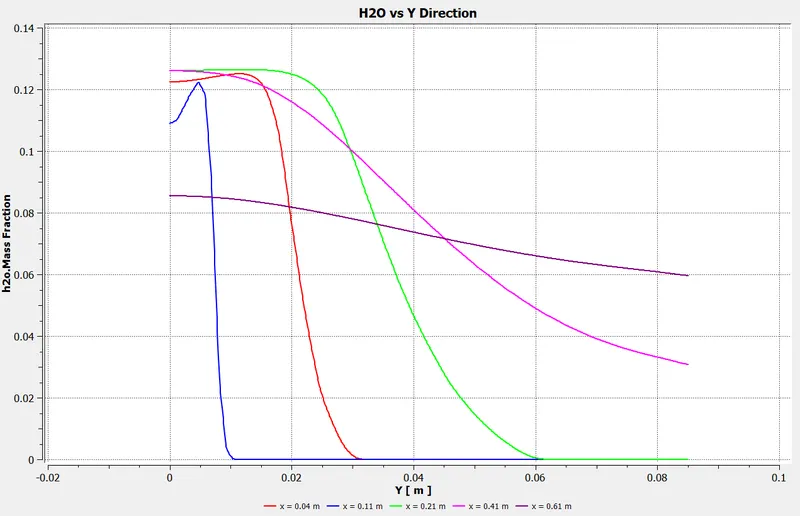
- N2 Mass Fraction vs Y-distance Graph at different X location:
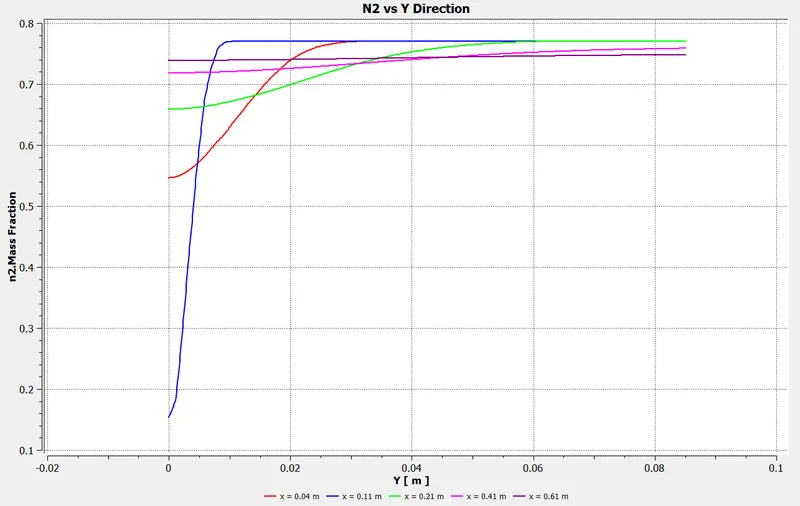
- O2 Mass Fraction vs Y-distance Graph at different X location:
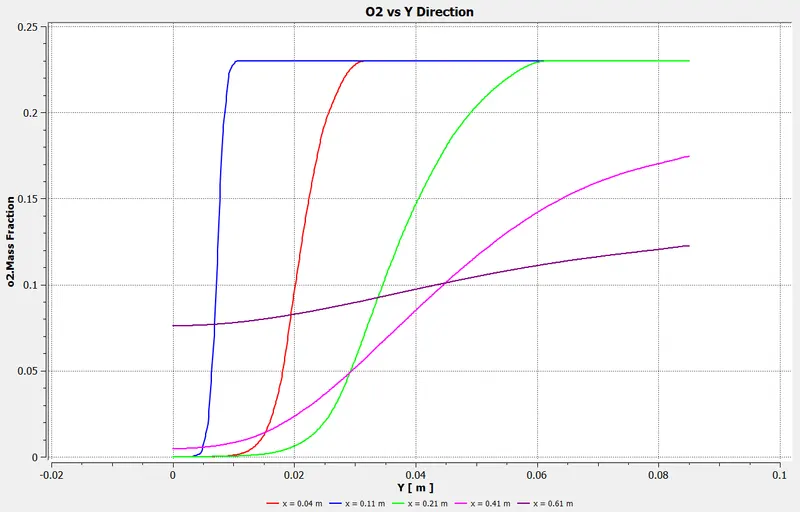
Case 3: 20% Water
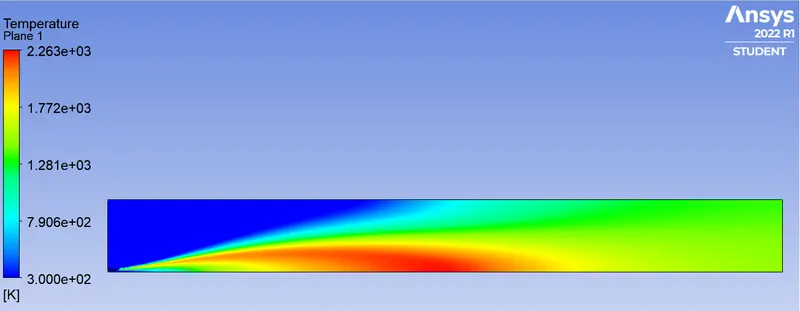
- Temperature Contour:
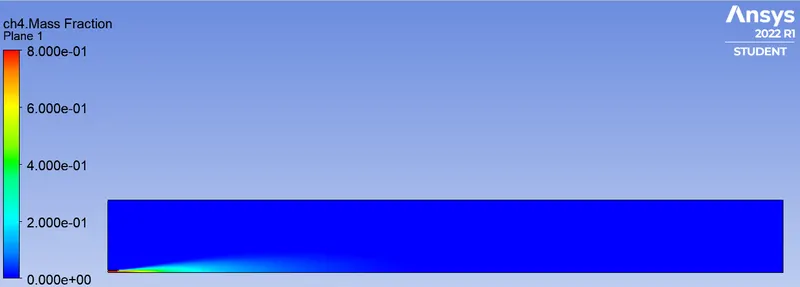
- CH4 Mass Fraction:
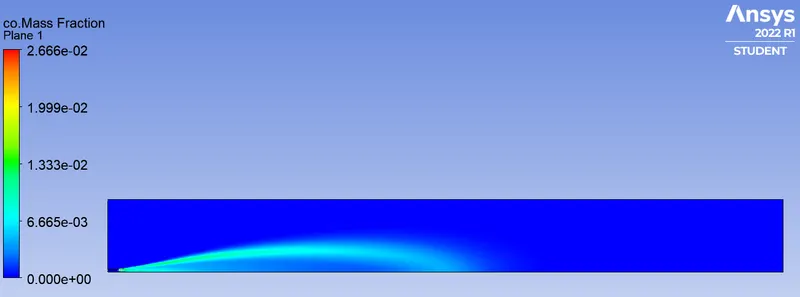
- CO Mass Fraction:
- CO2 Mass Fraction:
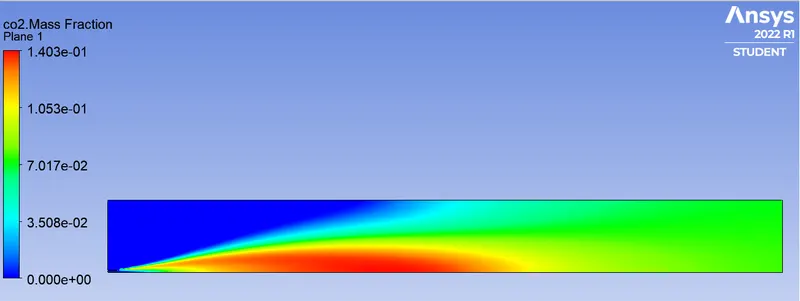
- H2O Mass Fraction:
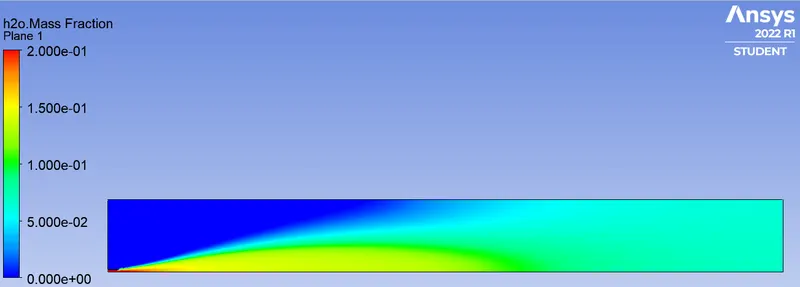
- N2 Mass Fraction:
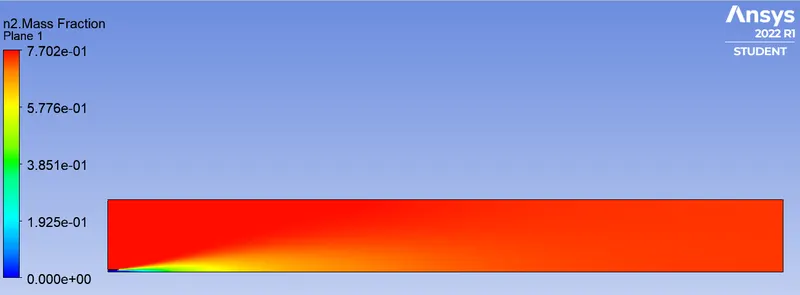
- O2 Mass Fraction:
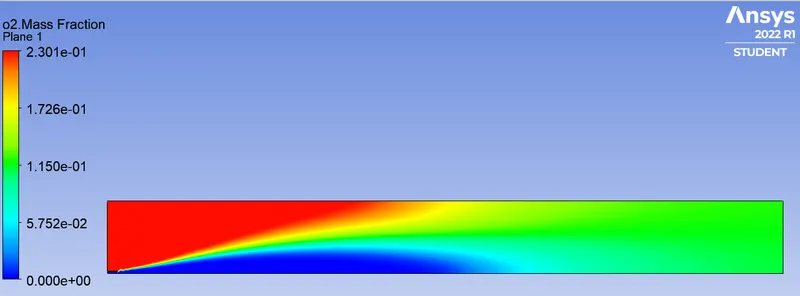
- NOx Mass Fraction:
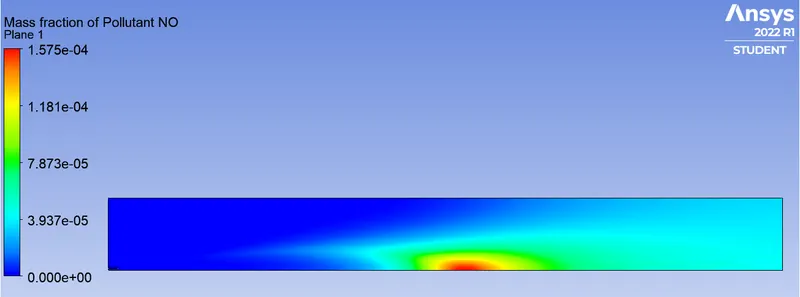
- Soot Mass Fraction:
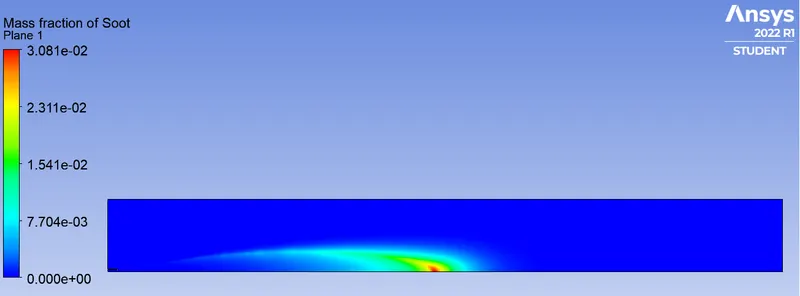
- Temperature vs Y-distance Graph at different X location:
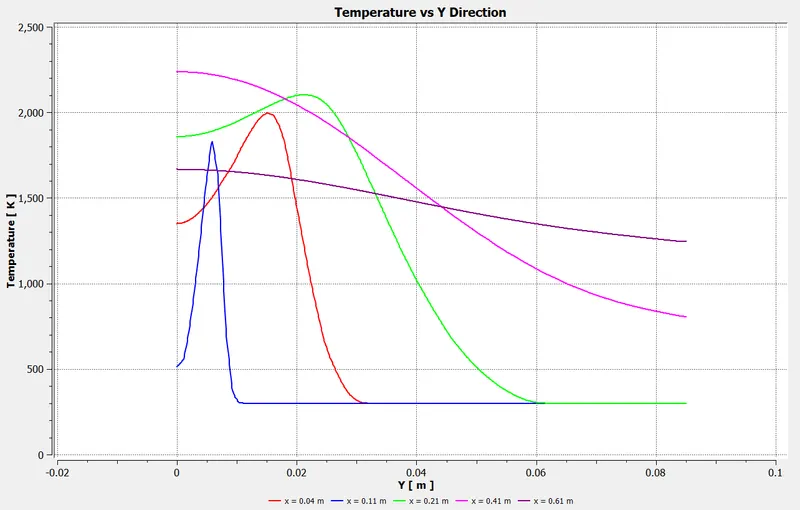
- CH4 Mass Fraction vs Y-distance Graph at different X location:
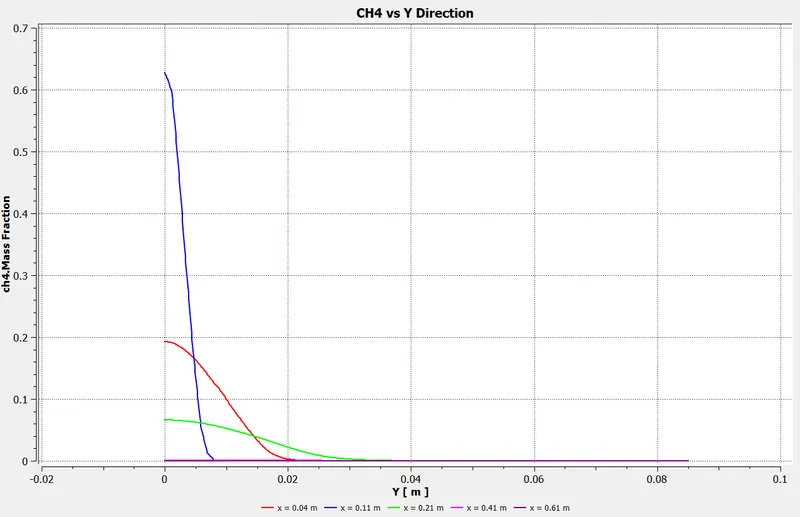
- CO Mass Fraction vs Y-distance Graph at different X location:
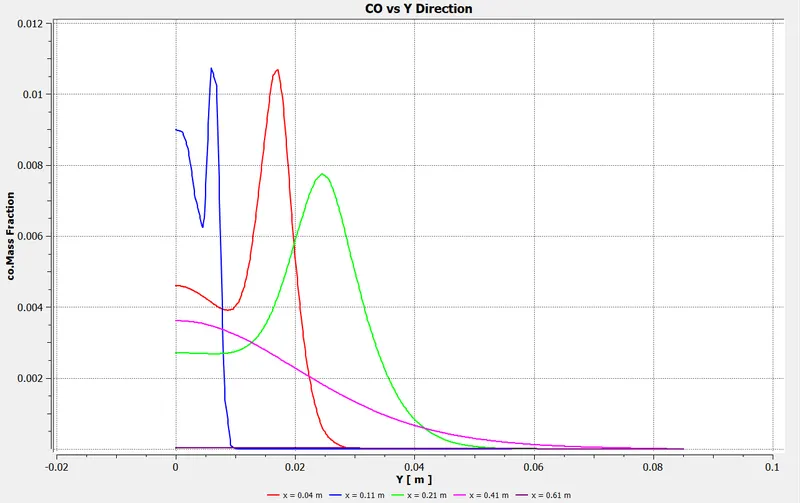
- CO2 Mass Fraction vs Y-distance Graph at different X location:
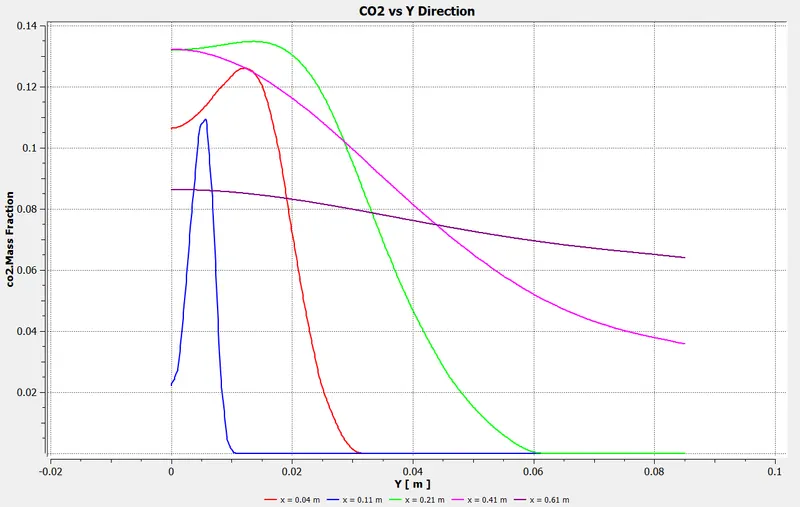
- H2O Mass Fraction vs Y-distance Graph at different X location:
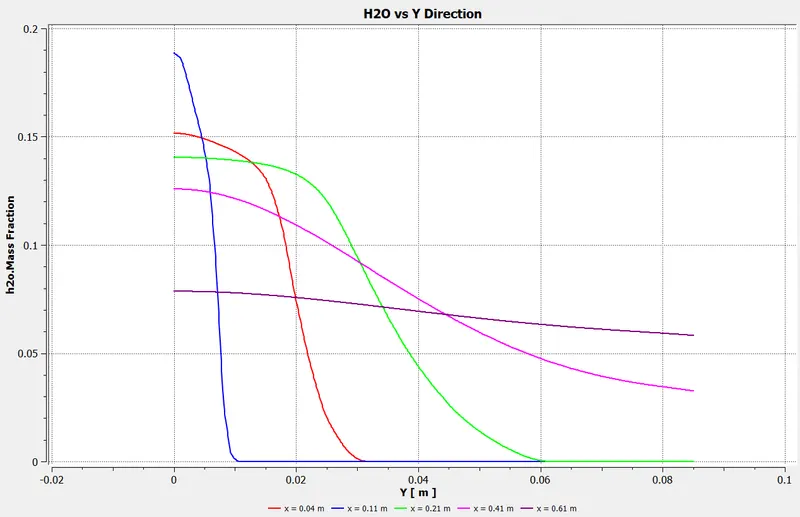
- N2 Mass Fraction vs Y-distance Graph at different X location:
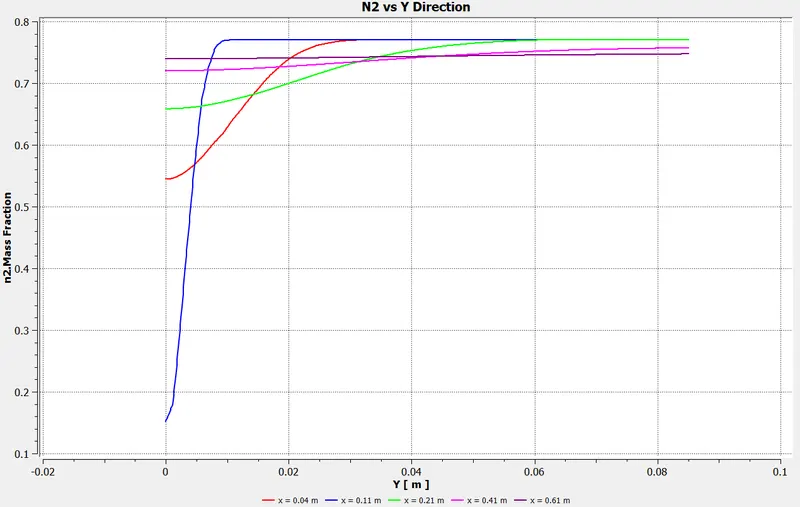
- O2 Mass Fraction vs Y-distance Graph at different X location:
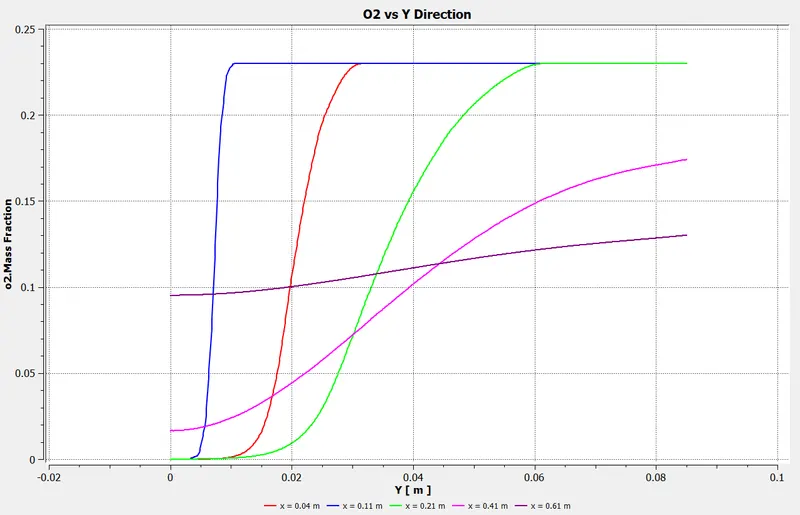
Case 4: 30% Water
- Temperature Contour:
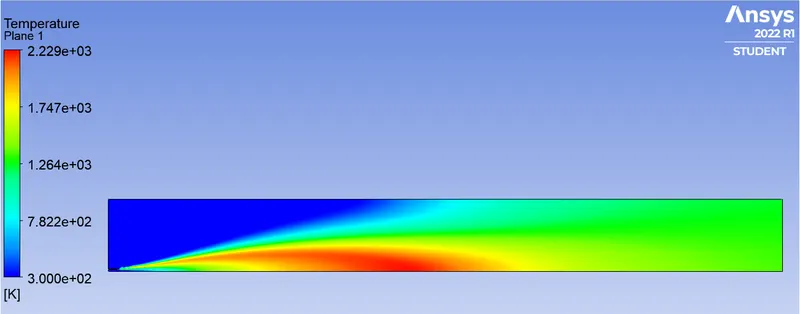
- CH4 Mass Fraction:
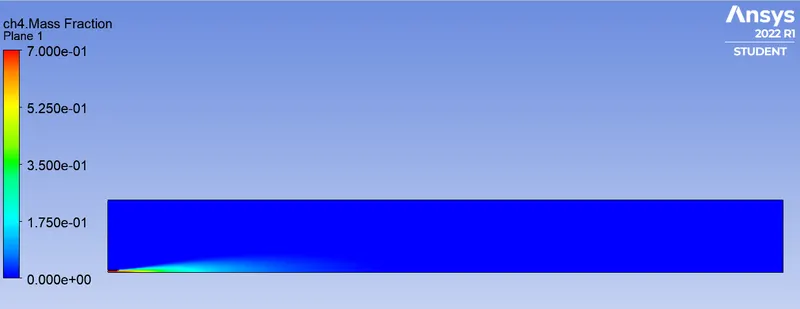
- CO Mass Fraction:
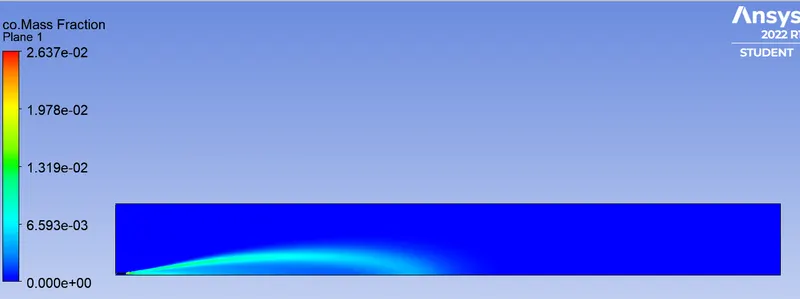
- CO2 Mass Fraction:
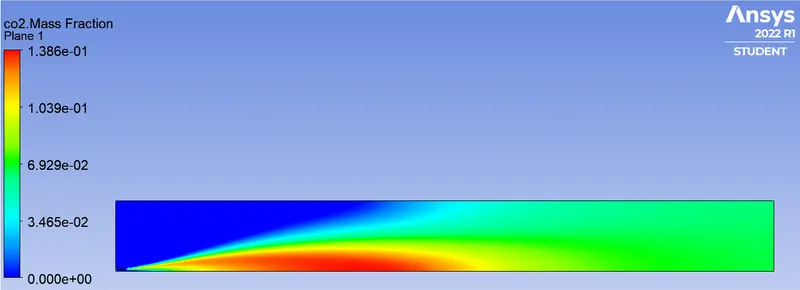
- H2O Mass Fraction:
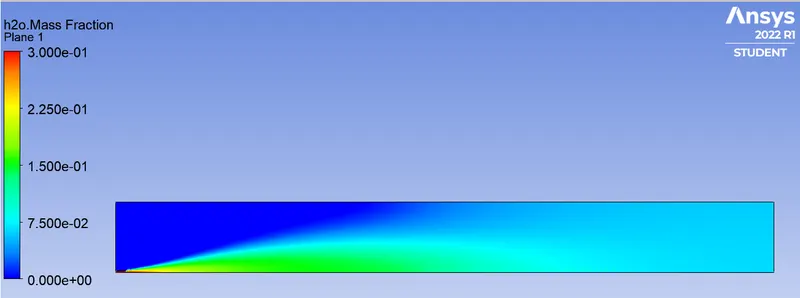
- N2 Mass Fraction:
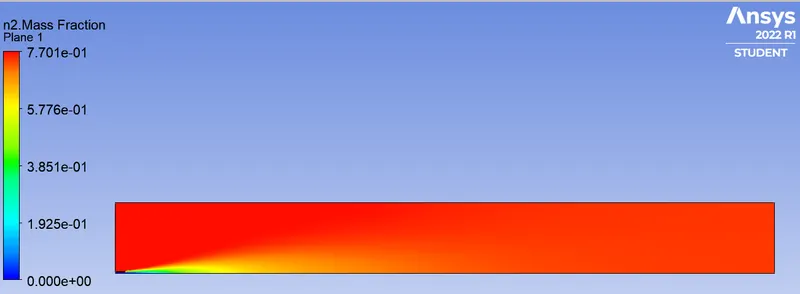
- O2 Mass Fraction:
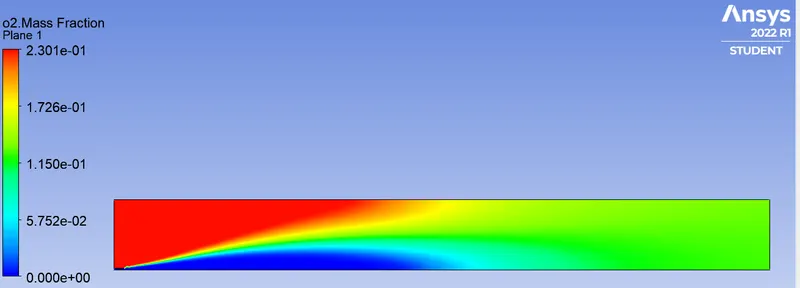
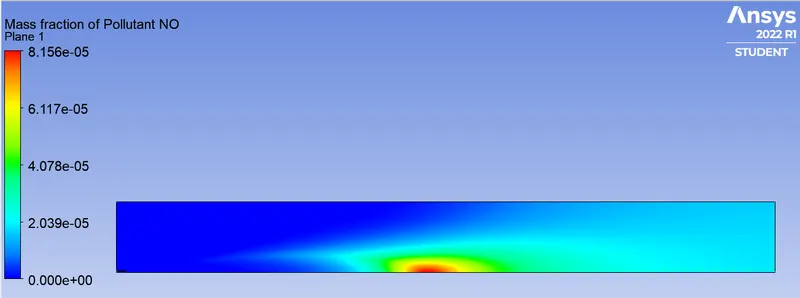
- NOx Mass Fraction:
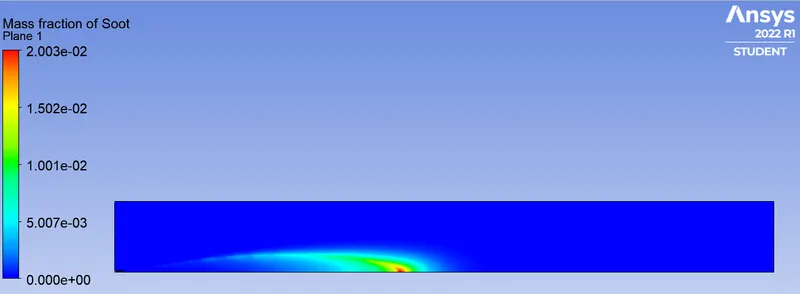
- Soot Mass Fraction:
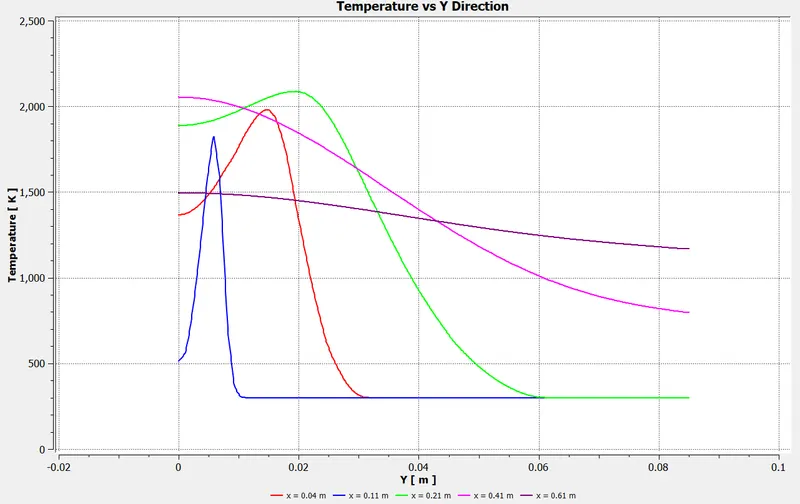
- Temperature vs Y-distance Graph at different X location:
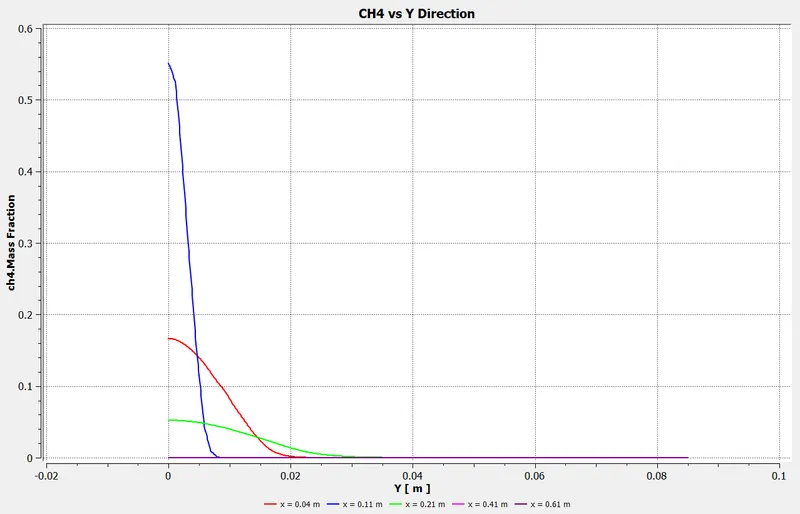
- CH4 Mass Fraction vs Y-distance Graph at different X location:
- CO Mass Fraction vs Y-distance Graph at different X location:
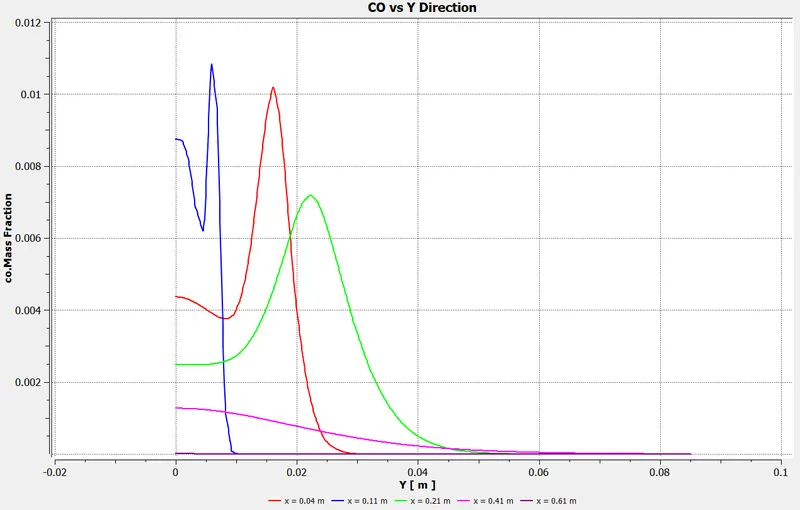
- CO2 Mass Fraction vs Y-distance Graph at different X location:
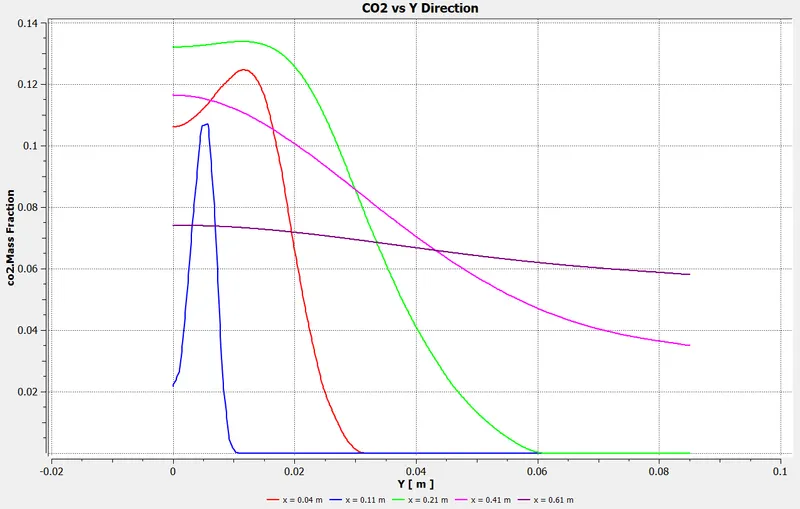
- H2O Mass Fraction vs Y-distance Graph at different X location:
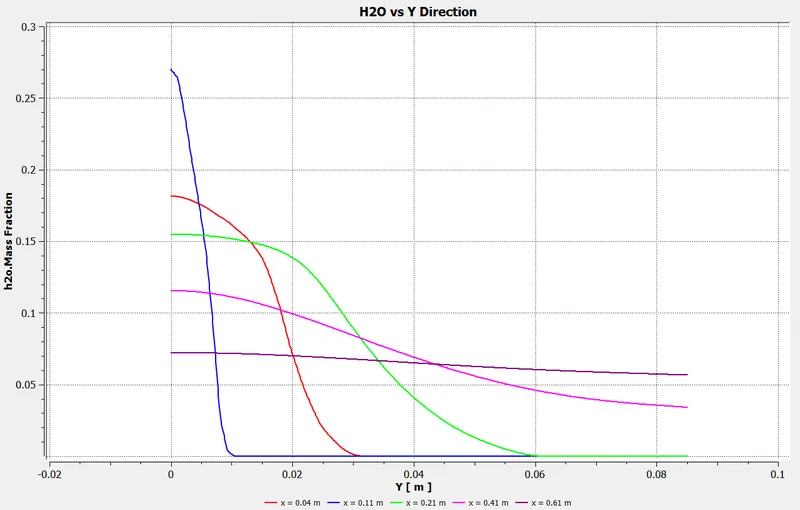
- N2 Mass Fraction vs Y-distance Graph at different X location:
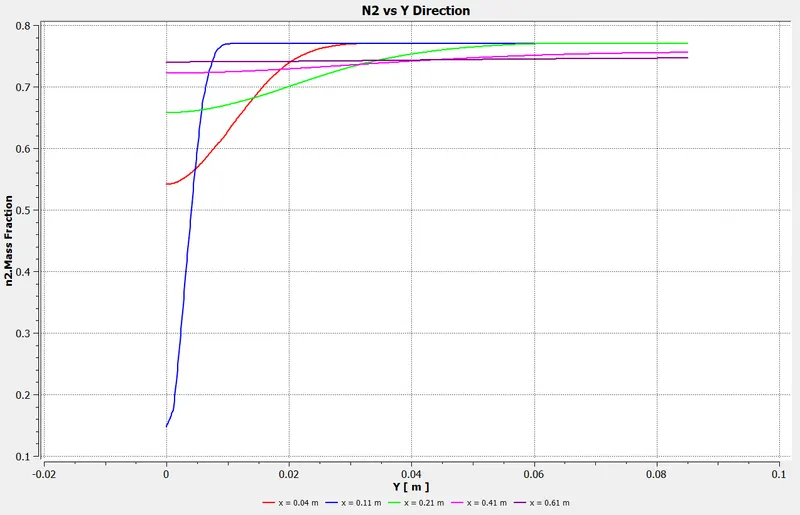
- O2 Mass Fraction vs Y-distance Graph at different X location:
Conclusion:
- With only fuel and and air as combusting substance, the temperature is somewhere around 2309 K.
- With 5% addition to 30% addition of water to fuel, the temperature decreases when compared to no water mixed with fuel.
- The value of NOX and Soot at the oulet drops with increase in addition of water with fuel (methane). Which is what is desired according to the norms.
Summary Table:
| NOx | Soot | |
| No water mixed | 1.11E-04 | 2.26E-05 |
| 5% water | 9.38E-05 | 6.71E-06 |
| 10% water | 7.09E-05 | 2.45E-06 |
| 20% water | 3.75E-05 | 2.94E-07 |
| 30% water | 1.74E-05 | 2.93E-08 |