Project 1 - Parsing NASA thermodynamic data
Aim : To write the Matlab code for parsing the NASA thermodynamics data file and extract 14 coeffients of thermodynamics properties like specific heat, enthalpy and entropy for all the species in the given data file.
And also to find the molecular mass of each species and finally to plot the graph of specific heat, enthalpy and entropy with respect to temperature.
Theory :
Function Code for specific heat(Cp) :
% Calculating specific heat for higher and lower temperature

function Cp = Specific_heat(a1,a2,a3,a4,a5,a8,a9,a10,a11,a12,T,R,midtemp)

if (T<=midtemp)
    Cp = R.*(a8+a9.*T+a10.*T.^2+a11.*T.^3+a12.*T.^4);
else
    Cp = R.*(a1+a2.*T+a3.*T.^2+a4.*T.^3+a5.*T.^4);
end
end
Function Code for Enthalpy(H) :
% calculating Enthalphy for higher and lower temperatures

function H = Enthalpy(a1,a2,a3,a4,a5,a6,a8,a9,a10,a11,a12,a13,T,R,midtemp)
if (T<=midtemp)
    H = R.*(a8.*T+(a9.*T.^2)./2+(a10.*T.^3)./3+(a11.*T.^4)./4+(a12.*T.^5)./5+a13);
else
    H = R.*(a1.*T+(a2.*T.^2)./2+(a3.*T.^3)./3+(a4.*T.^4)./4+(a5.*T.^5)./5+a6);
end
end
Function Code for Entropy(S) :
% calculating Entropy for higher and lower temperatures

function S = Entropy(a1,a2,a3,a4,a5,a7,a8,a9,a10,a11,a12,a14,T,R,midtemp)

if(T<=midtemp)
    S = R.*(a8.*log(T)+a9.*T+a10.*(T.^2)./2+a11.*(T.^3)./3+a12.*(T.^4)./4);
else
    S = R.*(a1.*log(T)+a2.*T+a3.*(T.^2)./2+a4.*(T.^3)./3+a5.*(T.^4)./5+a7);
end
end
In this molecular weight is calculating using function command here atomic name and atomic weight are given as inputs to the species. A loop is created for calculating molecular weights of species.
% calculating the molecular weight

function Molecular_weight = wt(species_name)

Elements = ['H','C','O','N','A','S'];
Atomic_weight = [1 12 16 14 40 32];
species = upper(species_name);

Molecular_weight = 0;

for i = 1:length(species)
    for j = 1:length(Elements)
        if strcmp(species(i),Elements(j))
            Molecular_weight = Molecular_weight + Atomic_weight(j);
            k = j;
        else
            n = str2double(species(i));
            if(n>1)
                Molecular_weight = Molecular_weight + Atomic_weight(k)*(n-1);
                break
            end
        end
    end
end
Main Program :
- We use THERMO.dat command to open the file.
- R is called as Universal gas Constant.
- T is called temperature.
- Firstly to read the date file fopen command is used and to get the information fgetl is used.
- using strsplit we get the global temperatures and then using fgetl command we skip the lines which are not requried.
- Loop command is created to get the values of all the temperatures and cofficients present in the file.
- To get the temperatures and coeffients values we use strfind to specify them accurately.
- There are 53 species are present in the data file.
- So the data is in string formate in order to convert it into a numbers str2double command is used.
- To make a folder mkdir command is used by specifing directory.
- By using the plot command to plot O2, N2 and CO2.
- Then the molecular weight is calculated bu calling the molecular weight calculated function.
- We use 'cd' to change or to store all plots in the same folder of the species.
- 'fprintf' command is used to getting the outputs of the molecular weights.
MAIN CODE :
% Parsing NASA Thermodynamics Data

clear all
close all
clc

% R = universal gas constant
R = 8.314;

% to open file
f1 = fopen('THERMO.dat','r');

% to read lines
line1 = fgetl(f1);
line2 = fgetl(f1);

value = strsplit(line2,' ');

% to get global temperature
global_low_temp = str2num(value{2});
global_mid_temp = str2num(value{3});
global_high_temp = str2num(value{4});

% temperature range
T = linspace(global_low_temp,global_high_temp,1000);

% these lines are not recognised
line3 = fgetl(f1);
line4 = fgetl(f1);
line5 = fgetl(f1);

% Reading species,calculating specific heat,enthalphy,entropy and plotting
for i = 1:53
    tline = fgetl(f1);
    A = strsplit(tline,' ');
    name_of_species = (A{1});
    lowtemp = str2num(A{end-3});
    midtemp = str2num(A{end-1});
    hightemp = str2num(A{end-2});

    % finding 7 higher coefficients and 7 lower coeffients

    tline1 = fgetl(f1);
    a = findstr(tline1,'E');

    a1 = tline1(1:a(1)+3);
    a1 = str2num(a1);
    a2 = tline1(a(1)+4:a(2)+3);
    a2 = str2num(a2);
    a3 = tline1(a(2)+4:a(3)+3);
    a3 = str2num(a3);
    a4 = tline1(a(3)+4:a(4)+3);
    a4 = str2num(a4);
    a5 = tline1(a(4)+4:a(5)+3);
    a5 = str2num(a5);

    tline2 = fgetl(f1);
    a = findstr(tline2,'E');

    a6 = tline2(1:a(1)+3);
    a6 = str2num(a6);
    a7 = tline2(a(1)+4:a(2)+3);
    a7 = str2num(a7);
    a8 = tline2(a(2)+4:a(3)+3);
    a8 = str2num(a8);
    a9 = tline2(a(3)+4:a(4)+3);
    a9 = str2num(a9);
    a10 = tline2(a(4)+4:a(5)+3);
    a10 = str2num(a10);

    tline3 = fgetl(f1);
    a = findstr(tline3,'E');

    a11 = tline3(1:a(1)+3);
    a11 = str2num(a11);
    a12 = tline3(a(1)+4:a(2)+3);
    a12 = str2num(a12);
    a13 = tline3(a(2)+4:a(3)+3);
    a13 = str2num(a13);
    a14 = tline3(a(3)+4:a(4)+3);
    a14 = str2num(a14);

    % calculating the specific heat(cp), enthalpy(H) ,etropy(S)
    Cp = Specific_heat(a1,a2,a3,a4,a5,a8,a9,a10,a11,a12,T,R,midtemp);
    H = Enthalpy(a1,a2,a3,a4,a5,a6,a8,a9,a10,a11,a12,a13,T,R,midtemp);
    S = Entropy(a1,a2,a3,a4,a5,a8,a9,a10,a11,a12,a13,a14,T,R,midtemp);

    % calculating molecular weight and printing of it
    Molecular_weight = wt(name_of_species);
    fprintf('molecular weight of %s = %f \n',name_of_species,Molecular_weight);

    % creating folder
    mkdir(name_of_species)
    cd(name_of_species)

    %plotting T vs cp

    figure(1)
    plot(T,Cp,'linewidth',3,'Color','g')

    xlabel('temperature(T)')
    ylabel('Specific heat(cp)')
    grid on
    title(name_of_species)
    saveas(figure(1),'specific heat.jpg');

    % plotting T vs H
    figure(2)
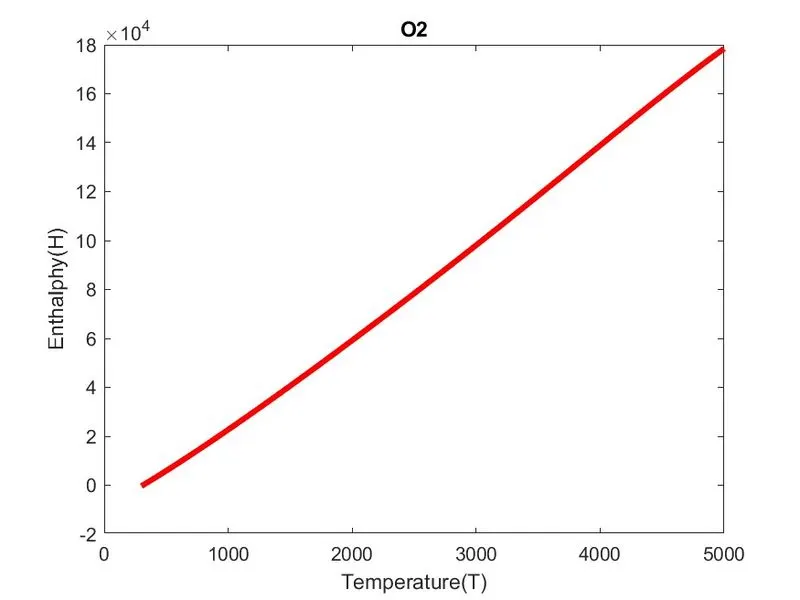
    plot(T,H,'LineWidth',3,'Color','r')

    xlabel('Temperature(T)')
    ylabel('Enthalphy(H)')
    title(name_of_species)
    saveas(figure(2),'enthalphy.jpg');

    % plotting T vs s
    figure(3)
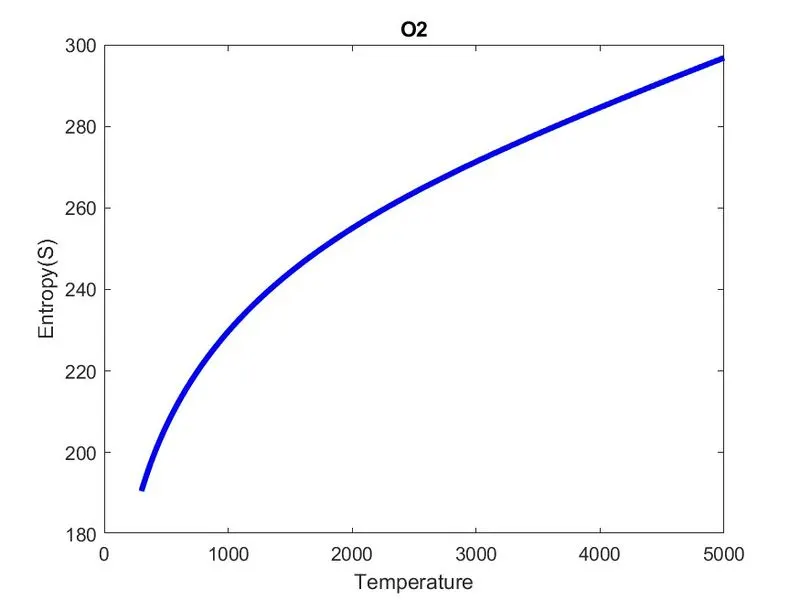
    plot(T,S,'LineWidth',3,'Color','b')

    xlabel('Temperature')
    ylabel('Entropy(S)')
    title(name_of_species)
    saveas(figure(3),'Entropy.jpg');
    cd ..
end
Plot for O2 :
Species folders :