Week 10 - Simulating Combustion of Natural Gas.
Objective
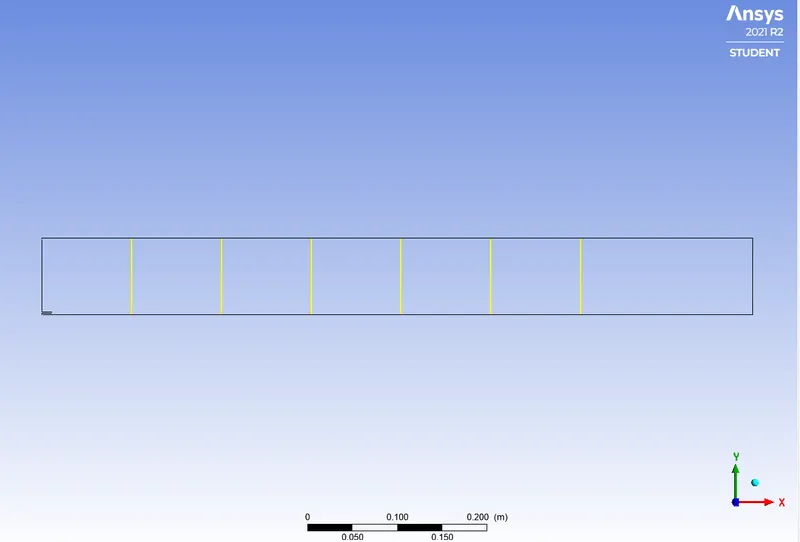
To perform a combustion simulation on the combustor model and plot the variation of the mass fraction of the different species’ in the simulation using line probes at different locations of the combustor as shown in Fig. You need to plot for CO2, H2O, CH4, N2, O2, NOx emissions & Soot formation.
Geometry Preparation
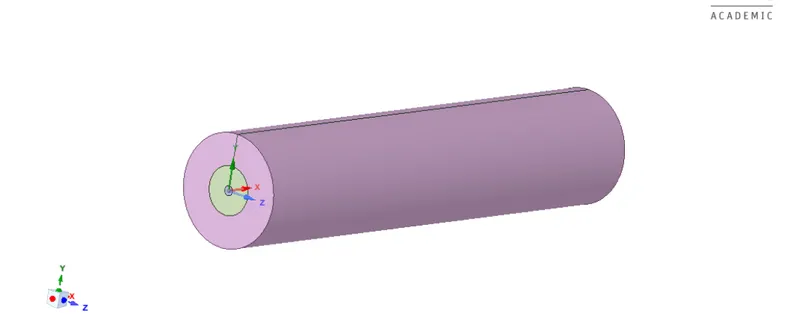
This is the 3D geometry of a combustion chamber that we need to deal with, but for this combustion simulation to reduce the simulation cost we are using only a 2-D face of this geometry.
The 2-D geometry of the above 3-D geometry is as follow
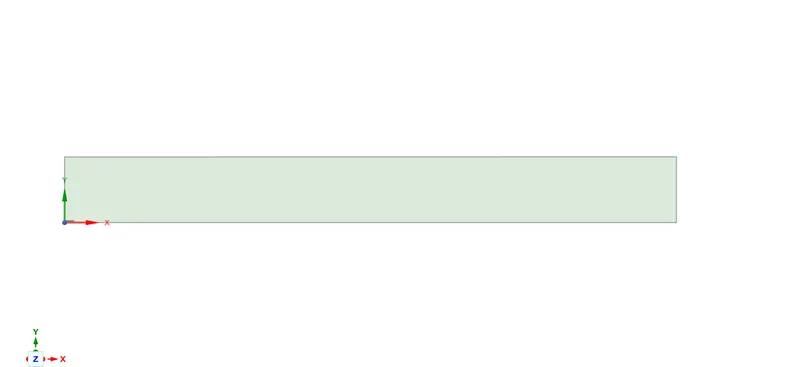
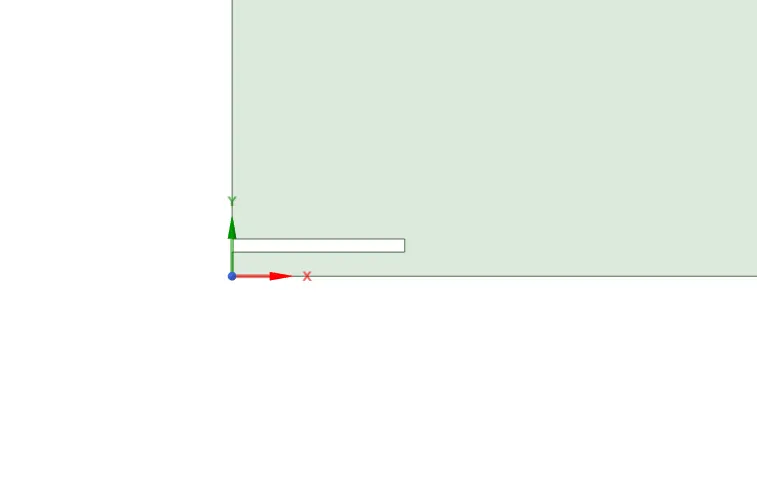
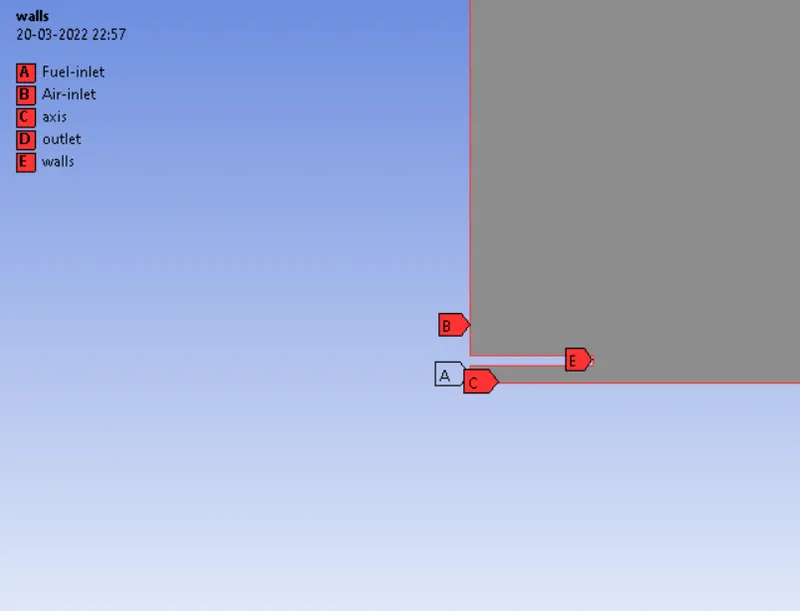
Now, we need to Create Named Selection in the Meshing and named each face as Fuel_inlet, Air_inlet, Axis, Outlet, Walls
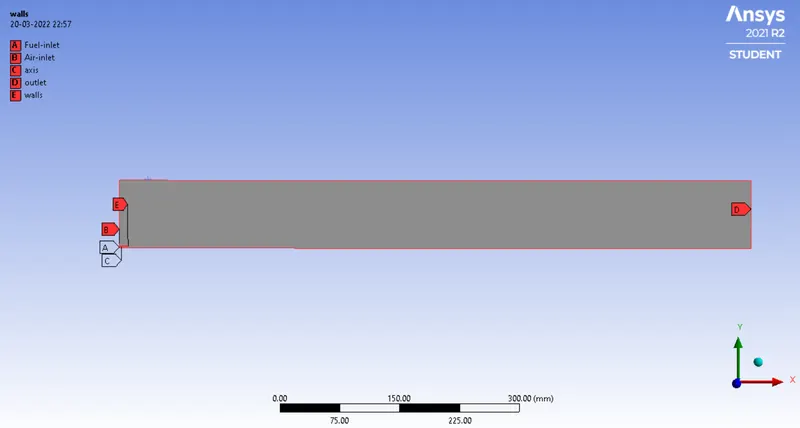
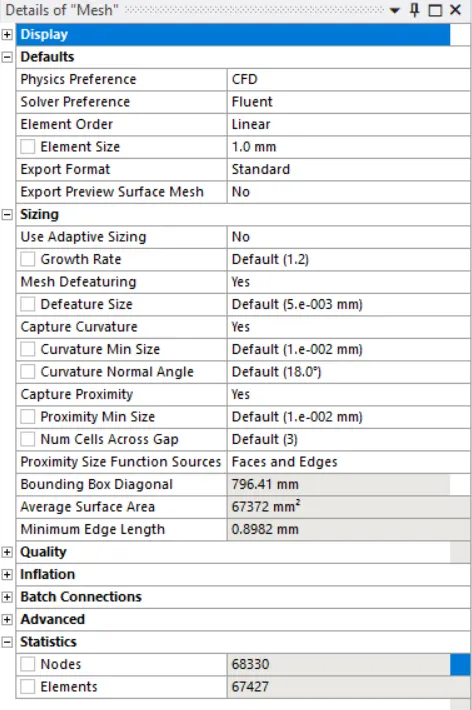
Now, we need to mesh the geometry for 1 mm Element size
and Turn on the capture proximity.
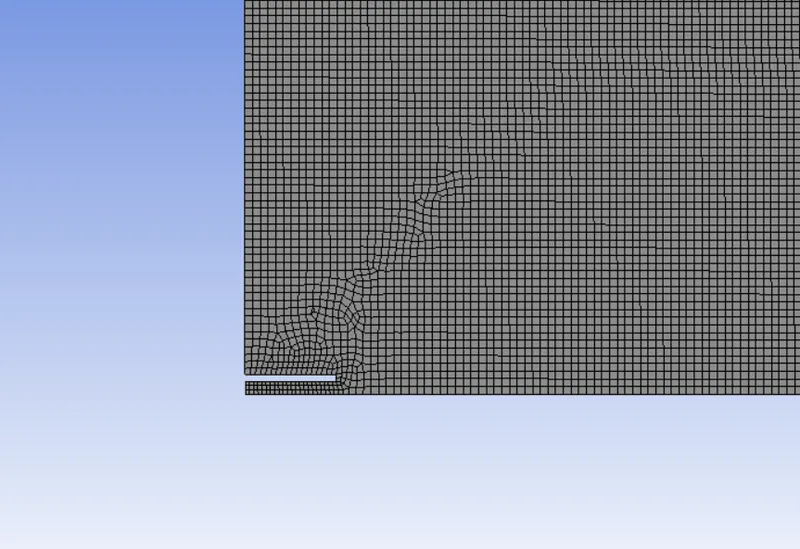
The Mesh thus obtained is
Now we open Fluent for further operations.
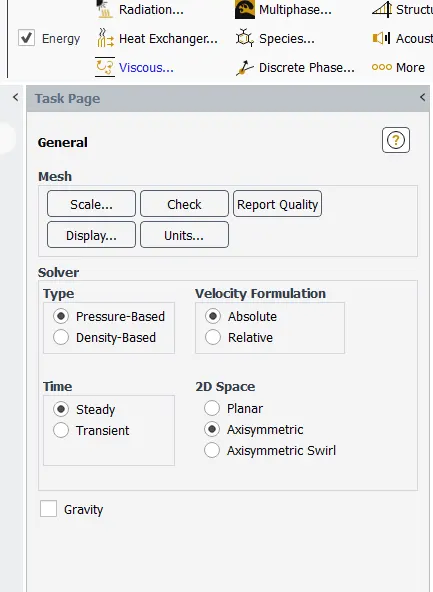
We use the
Type as Pressure based
Absolute Velocity Formulation
Steady- Time
2D Space -Axissymmetric
Enable Energy Equation
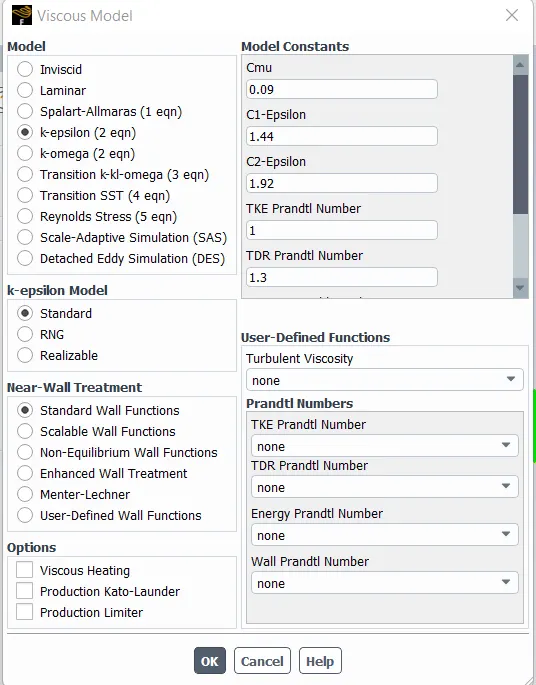
Viscous Model as K-Epsilon
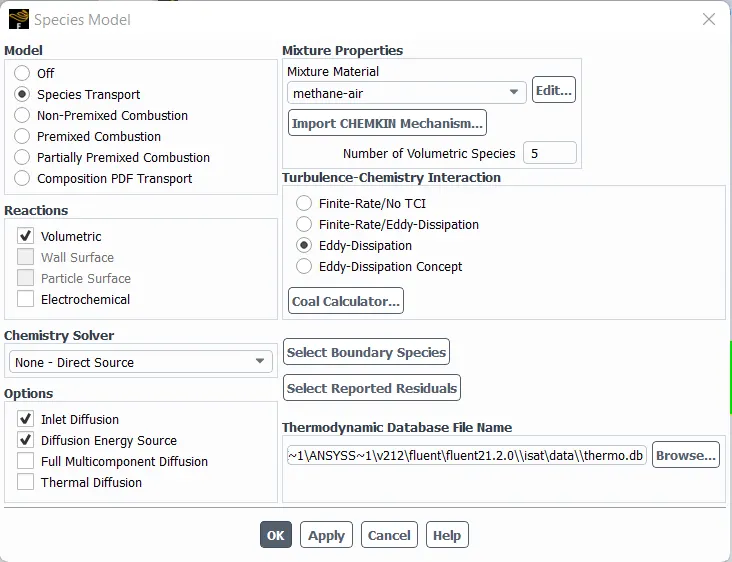
The Species Model is edited as follows
Model- Species Transport
Reaction- Volumetric
Options- Inlet Diffusions, Diffusions Energy Source
Mixture Material - Methane-air
Turbulence - Eddy- Dissipation
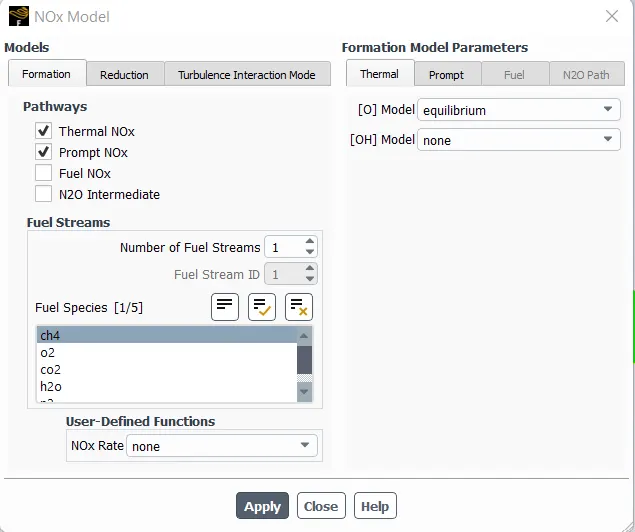
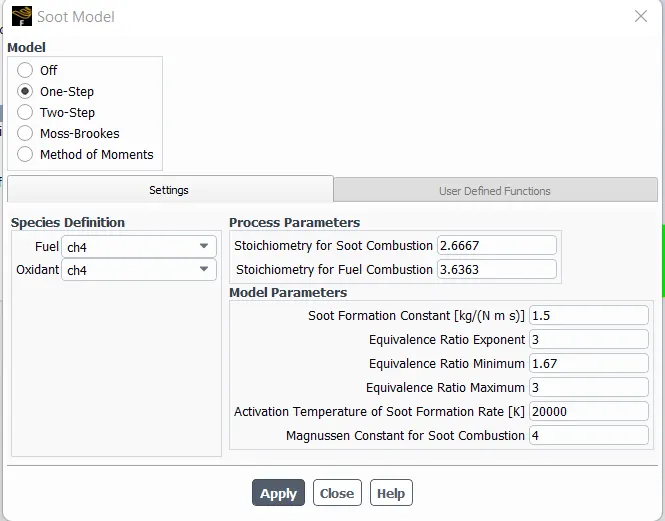
Now, we need to turn on the Nox model and Soot Model
Now the boundary condition is to be set.
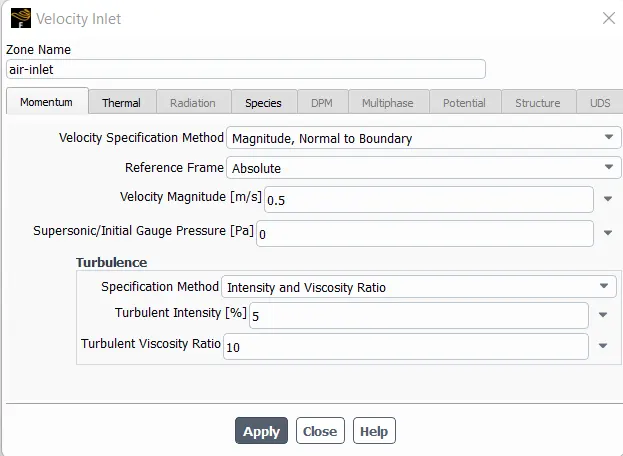
Air-Inlet
Velocty- 0.5 m/s
Temperature - 300k
Species - O2 - 0.23
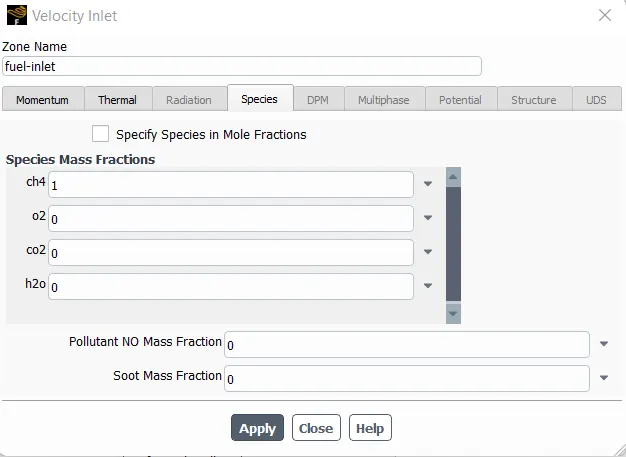
Fuel- Inlet
velocity - 80m/s
Species
Ch4 -1
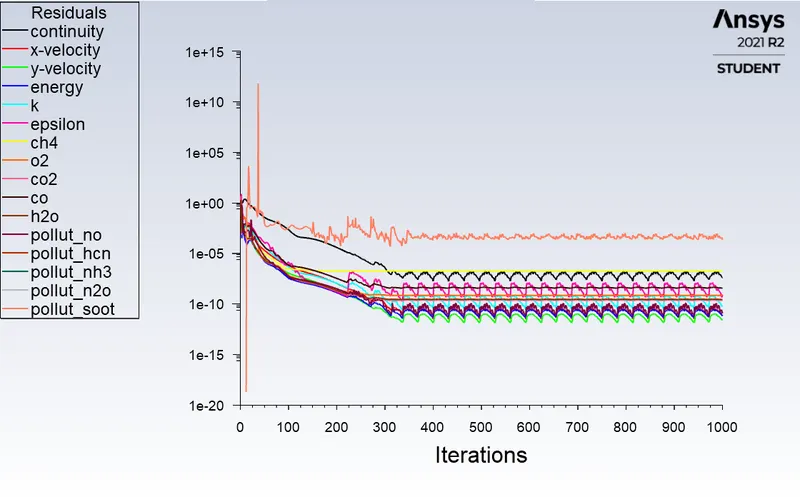
And Finally, we simulated for 1000 Iterations,
Results Obtained...
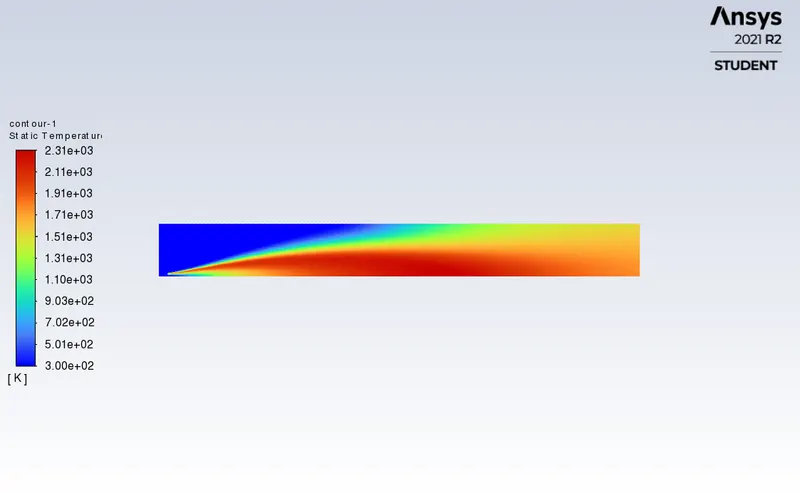
The Static Temperature Contour is
Residual Plot
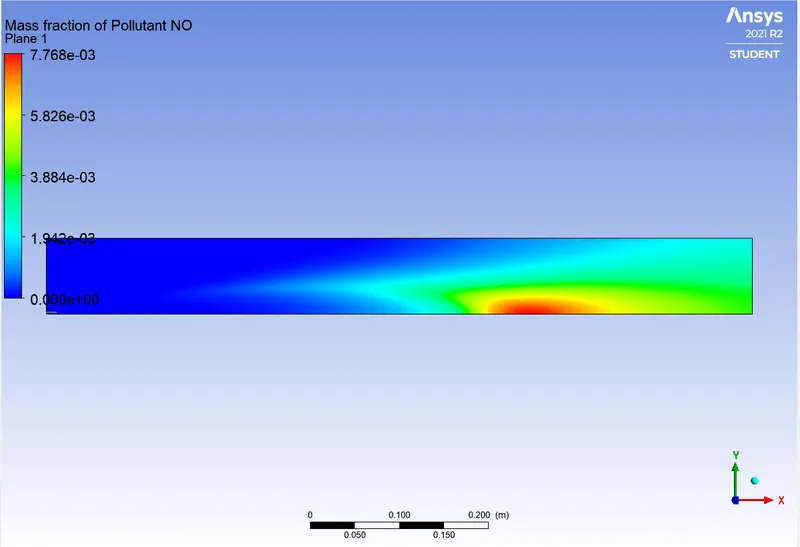
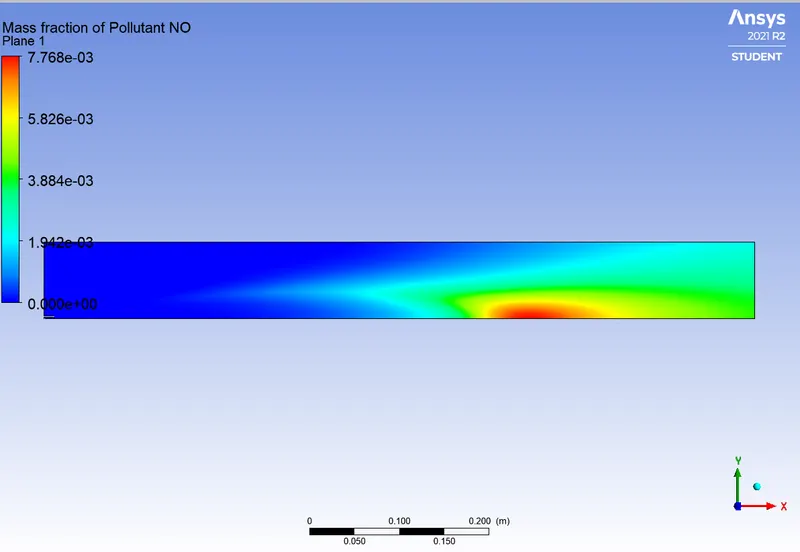
Mass fraction of Pollutant NO
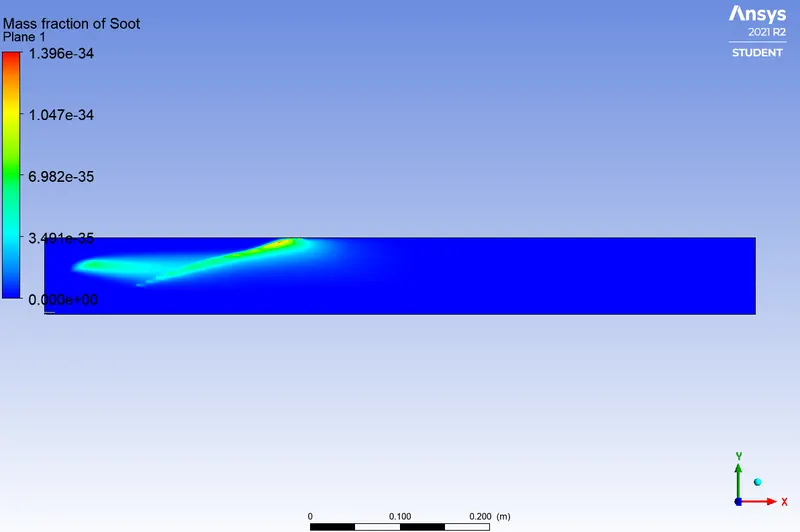
Mass Fraction of Soot
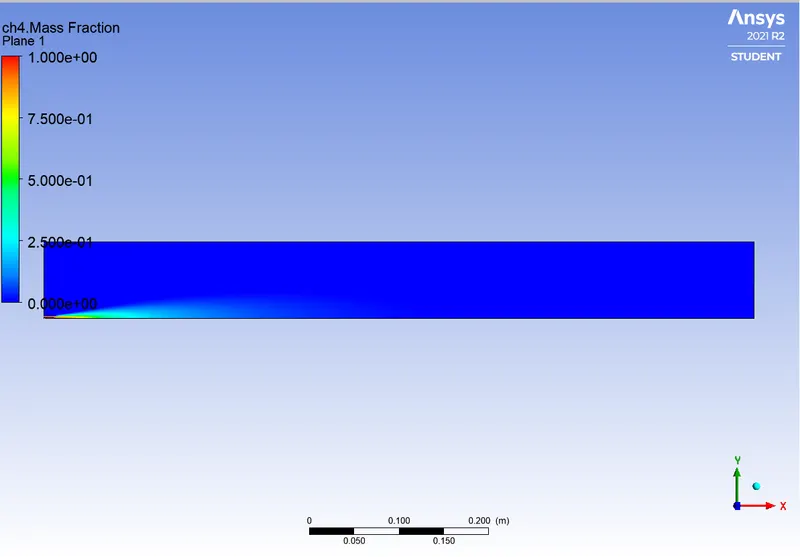
Methane Mass fraction
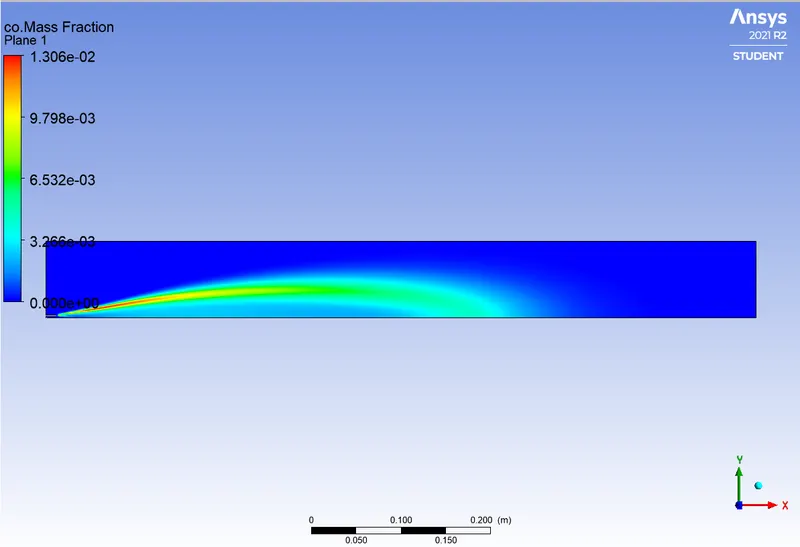
CO Mass fraction
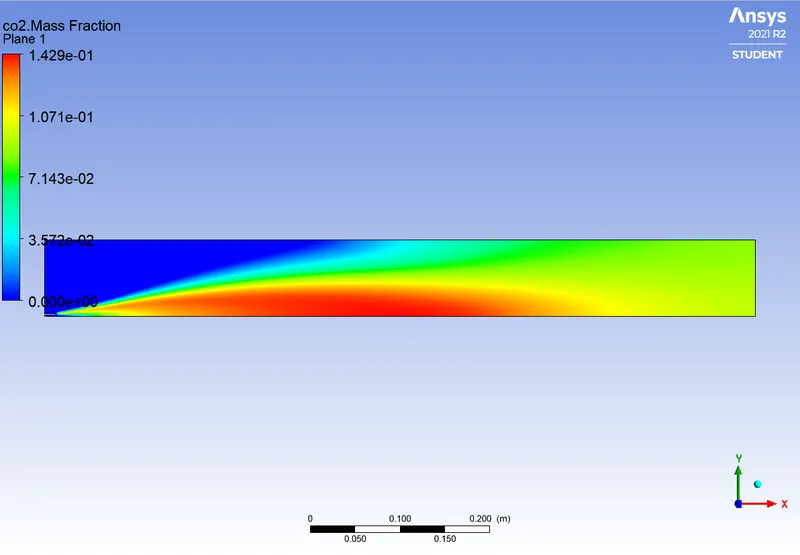
CO2 Mass Fraction
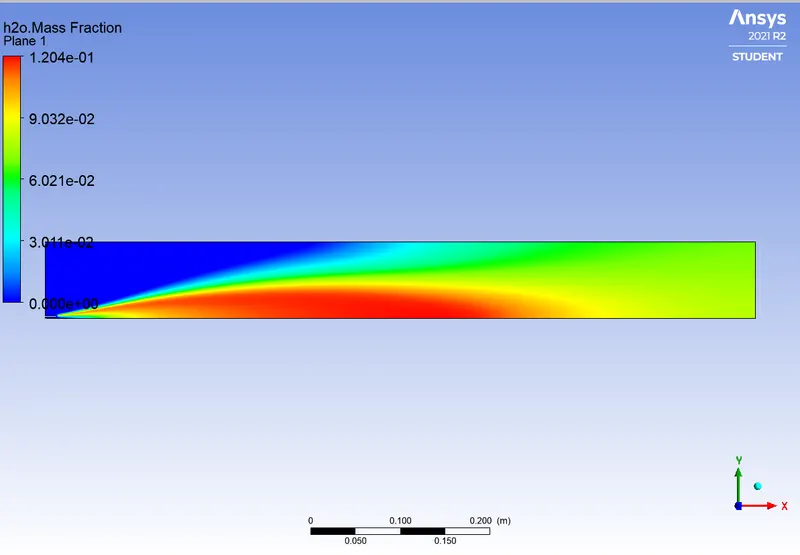
H2O Mass fraction
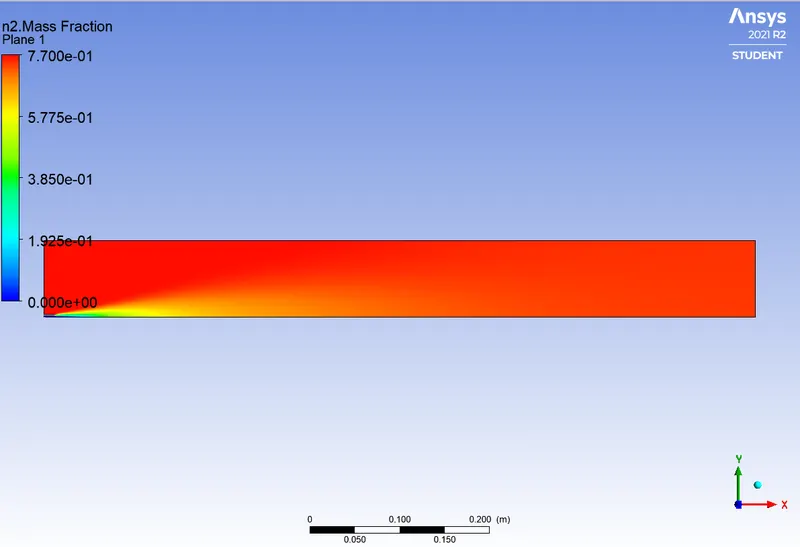
N2 Mass Fraction
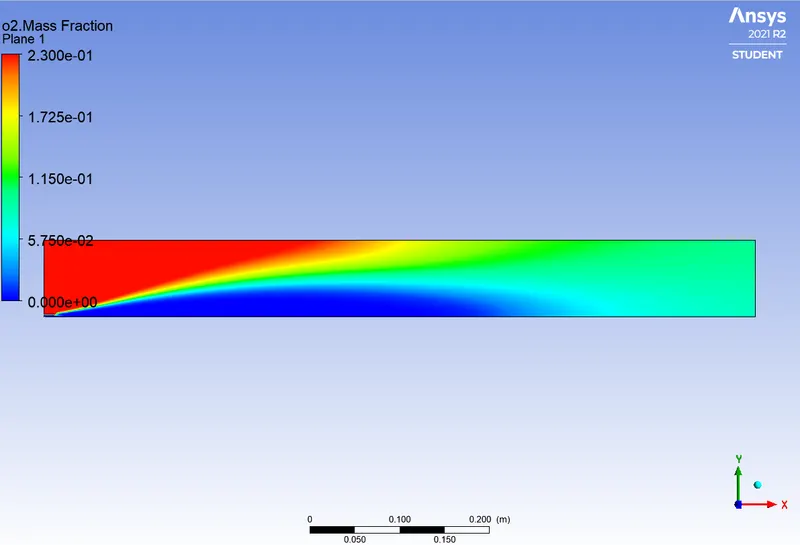
O2 Mass fraction
Mass fraction of pollutants NO
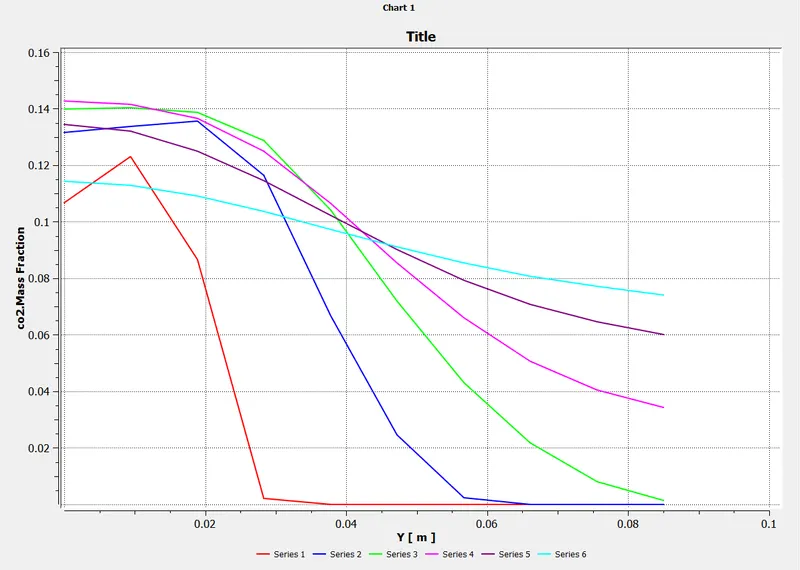
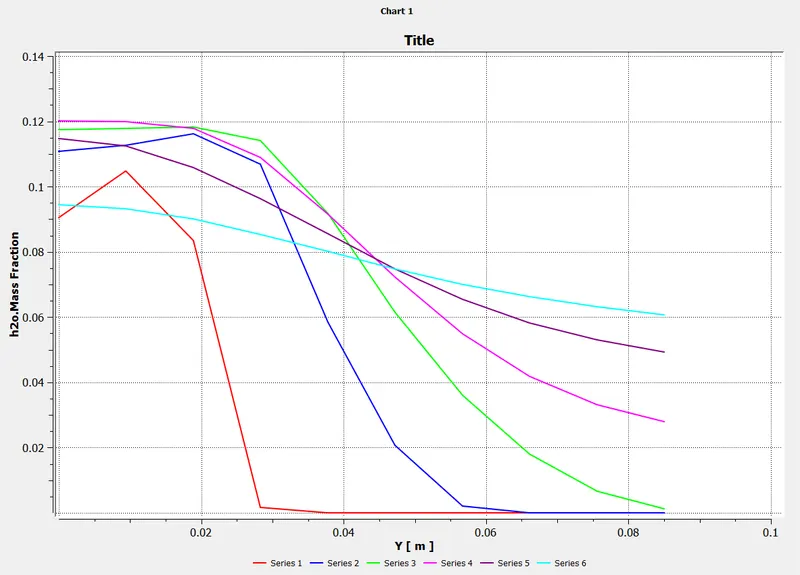
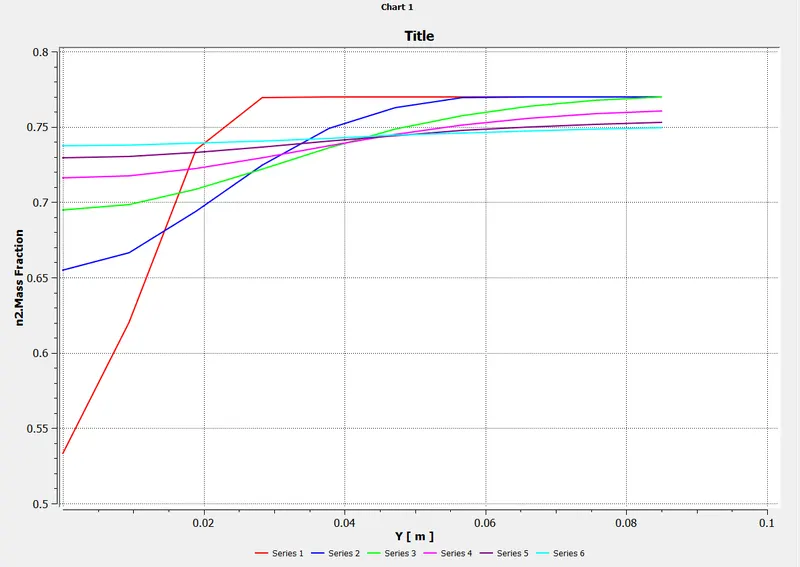
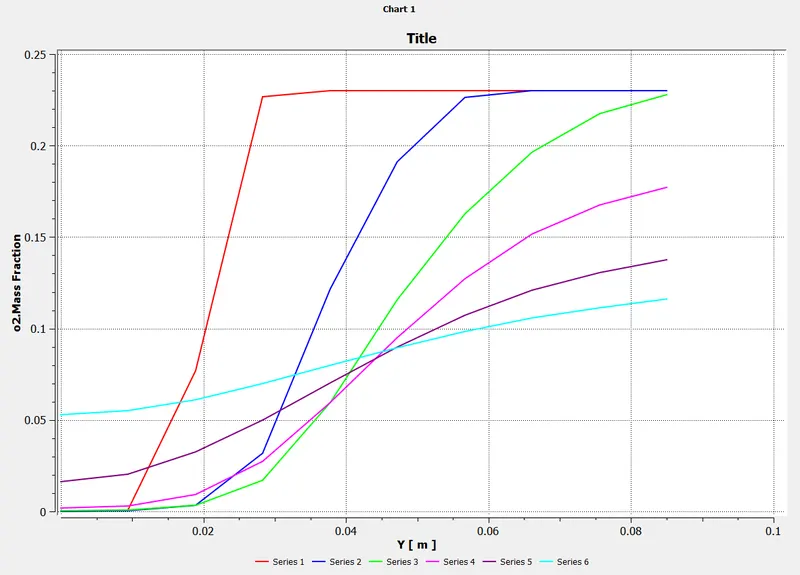
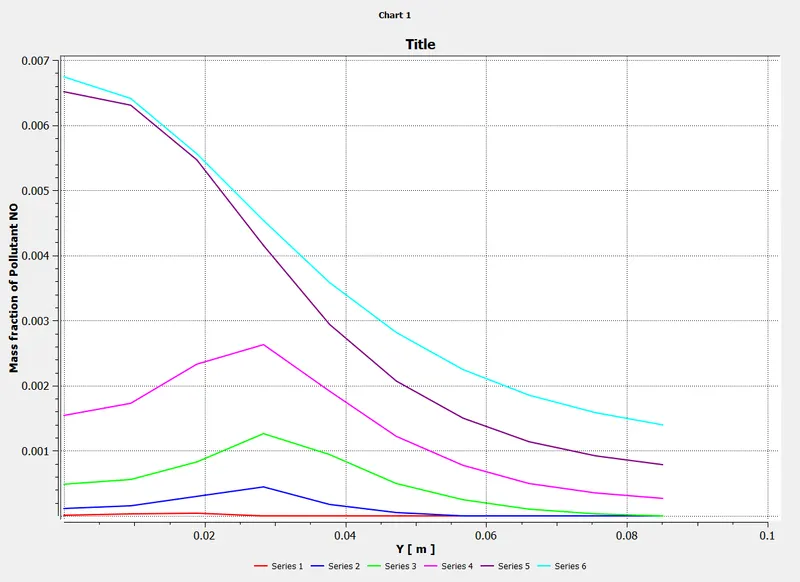
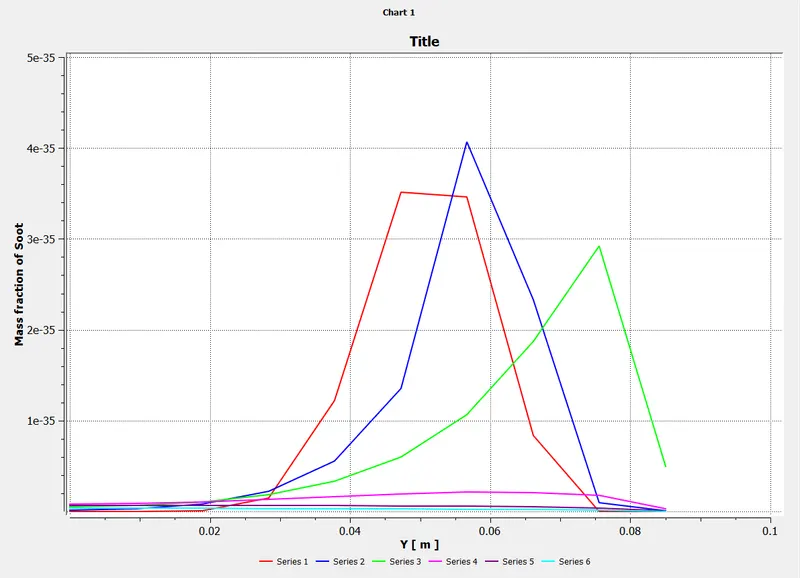
Now, for plotting the results at various locations, we have inserted lines on different locations, at 1mm 2mm 3mm 4mm 5mm, and 6mm.
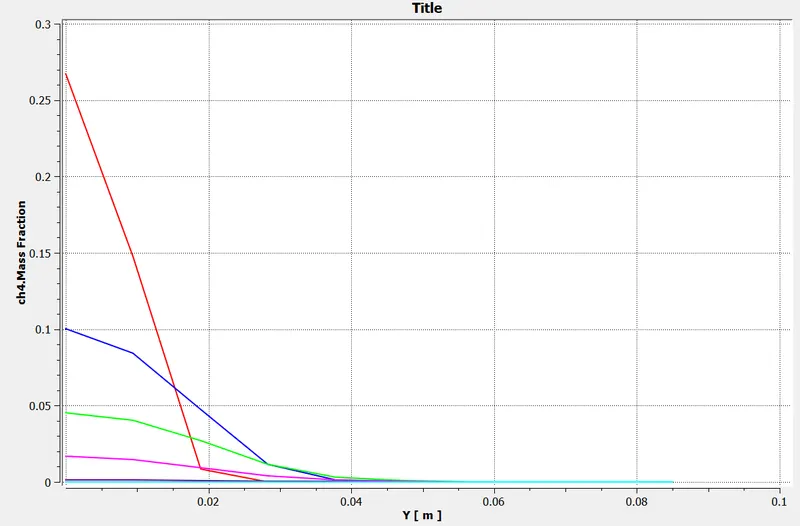
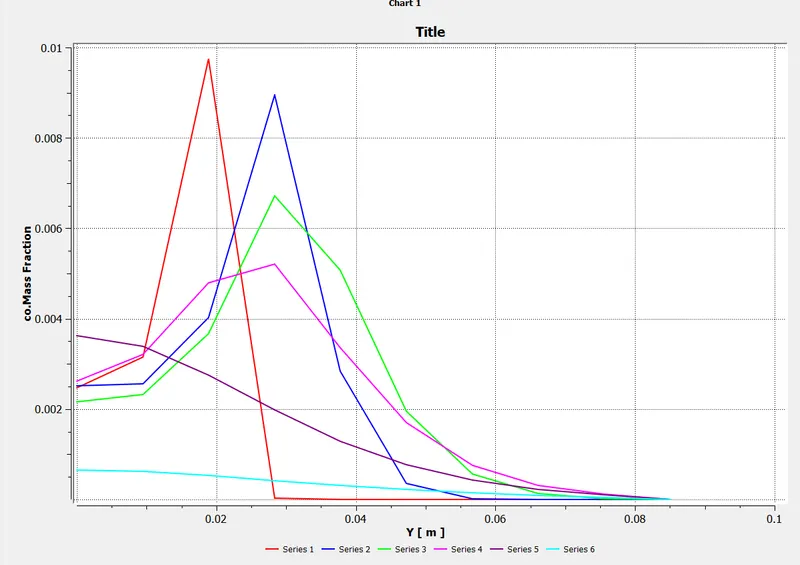
The Graph of Results at 6 different locations of the chamber as follows
Ch4 Mass fraction
CO Mass Fraction
CO2 Mass fraction
H2O Mass fraction
N2 Mass fraction
O2 Mass Fraction
Mass fraction of Pollutant NO
Mass fraction of Soot
************************************** PART-2********************************************
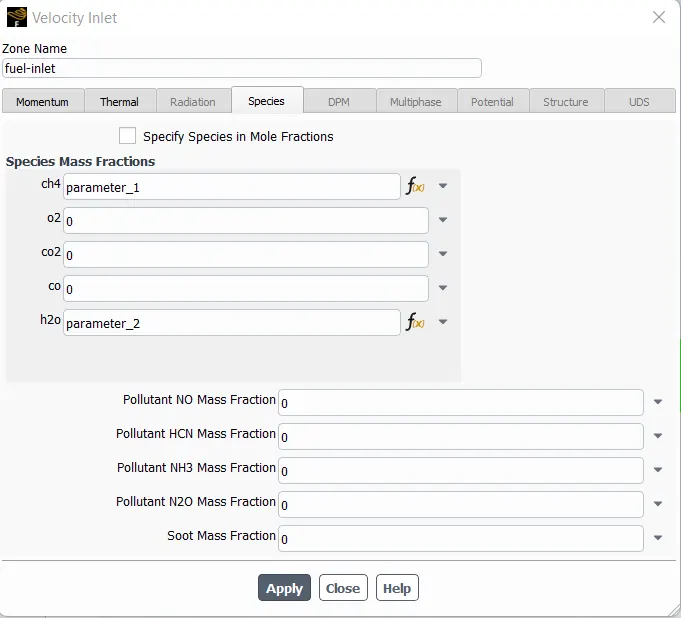
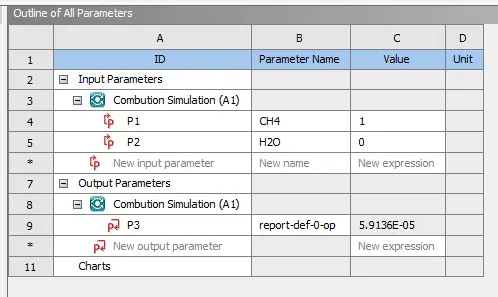
A parametric study is performed to analyze the effect of water addition (5% to 30% of mole fraction) to the fuel inlet.
Mixture Material - Methane-air-2-step
Boundary Conditions
Fuel Inlet
Velocity - 80 m/s
Inlet Temp - 300K

RESULTS
DP0
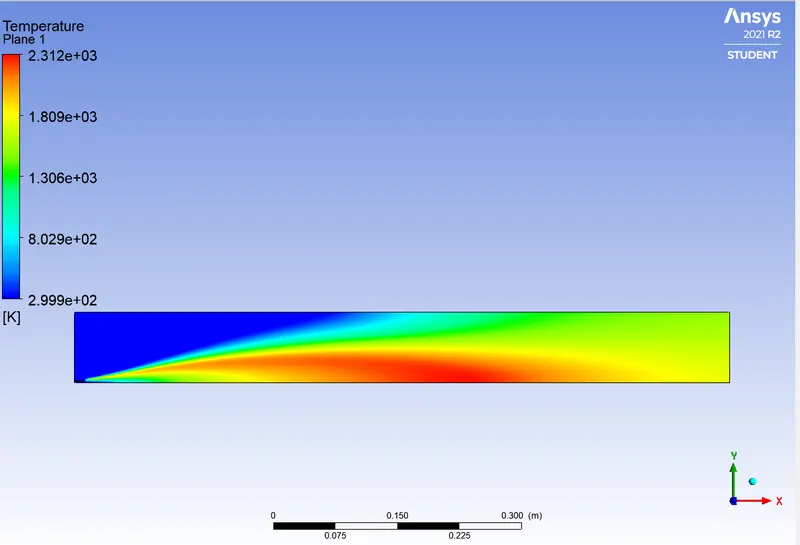
Temperature Contour
Maximum temperature - 2312 K
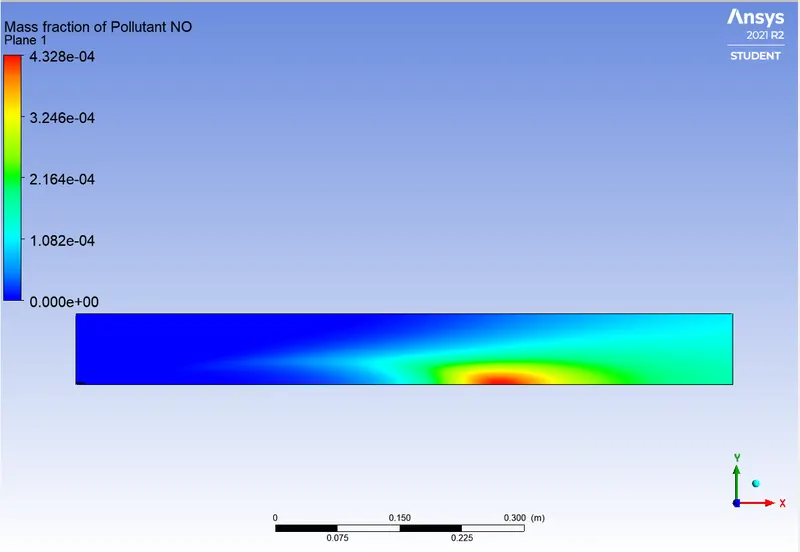
Mass fraction of NO
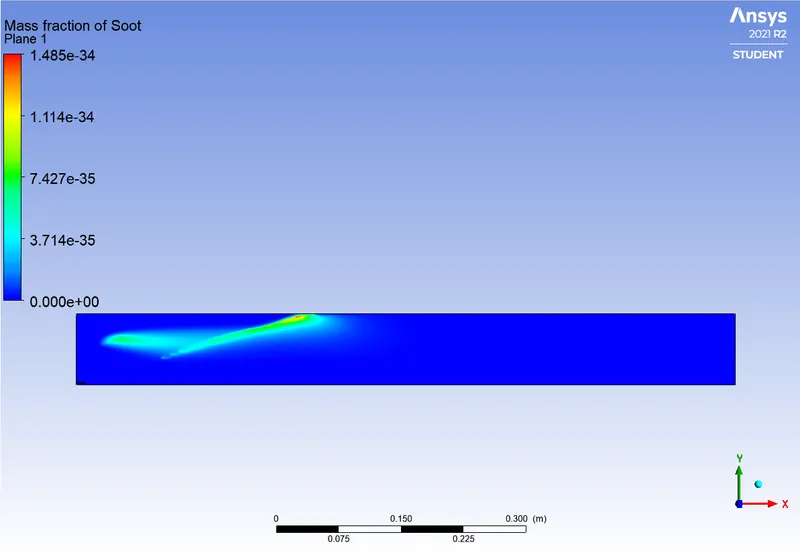
Mass Fraction of Soot
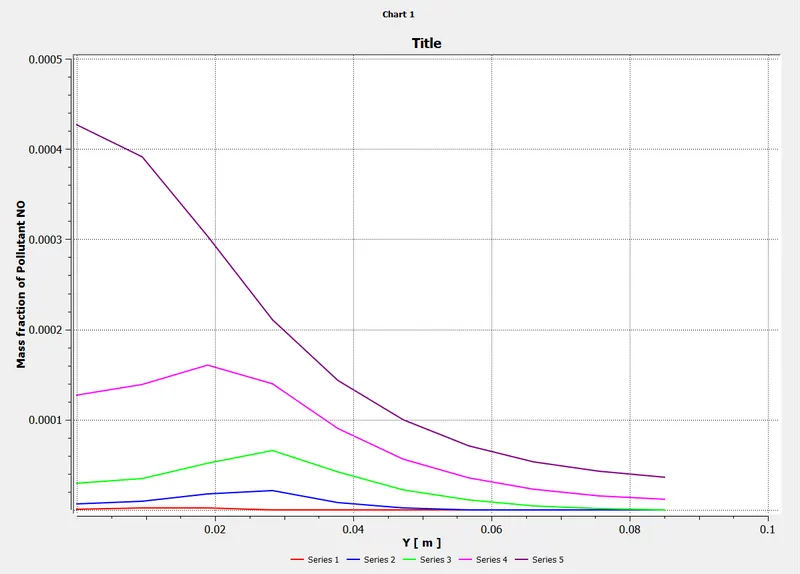
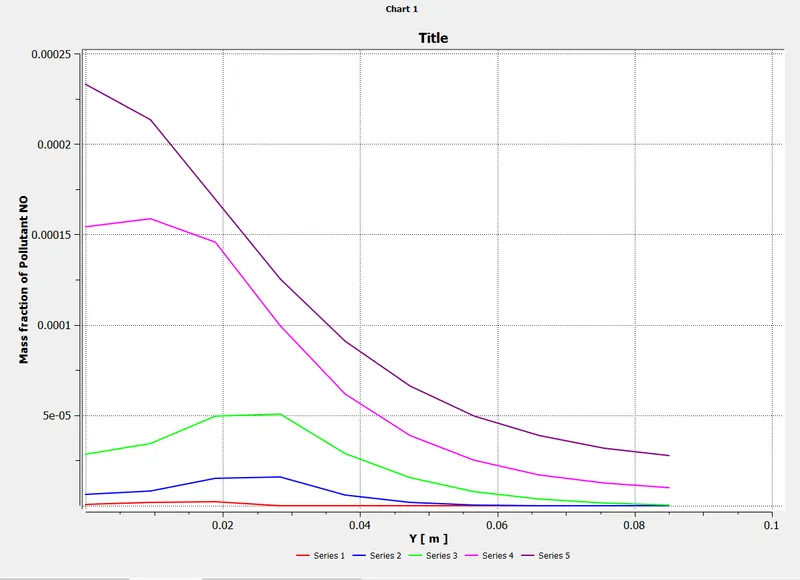
Mass fraction chart of pollutant NO
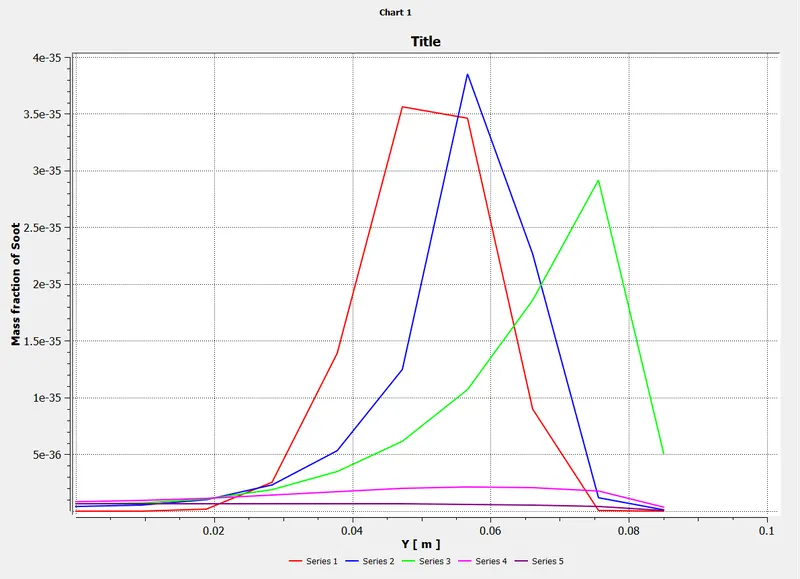
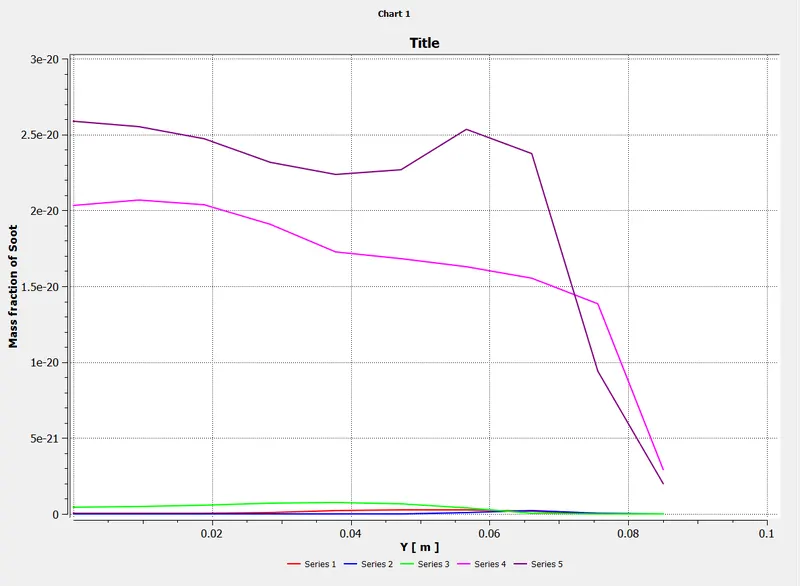
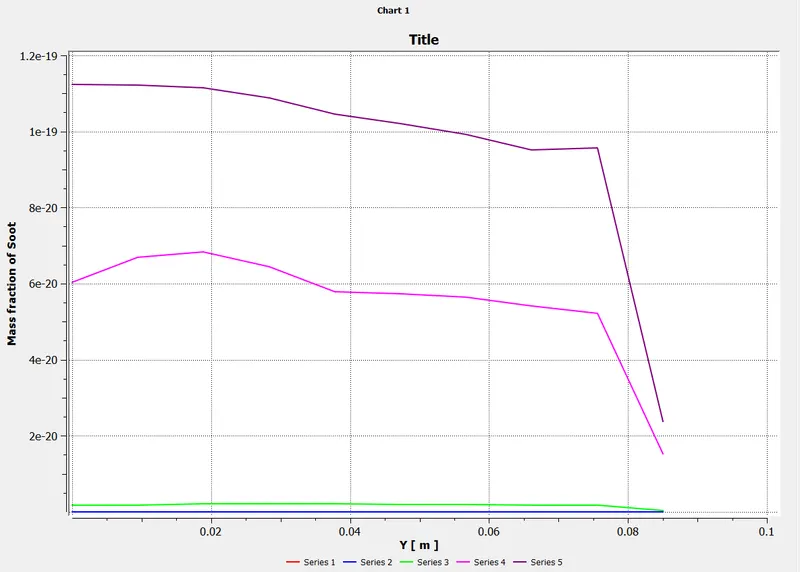
Mass Fraction chart of soot
DP1
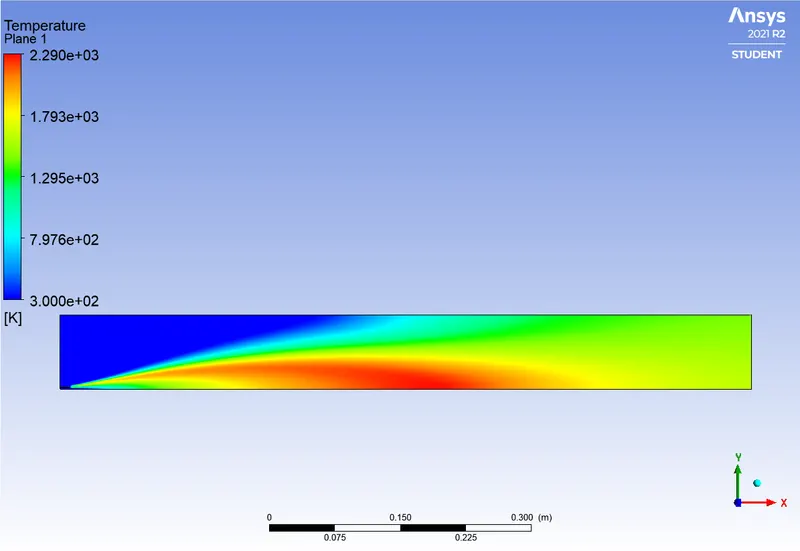
Temperature Contour
Maximum Temperature - 2290 K
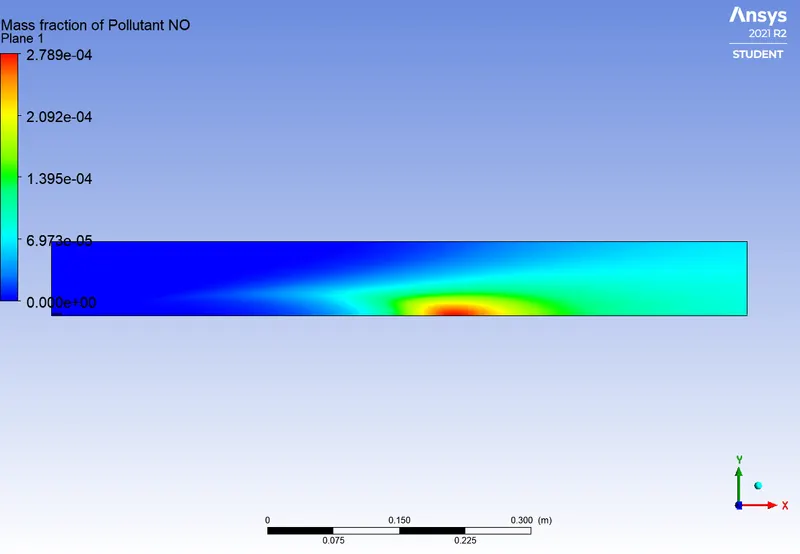
Mass fraction of NO
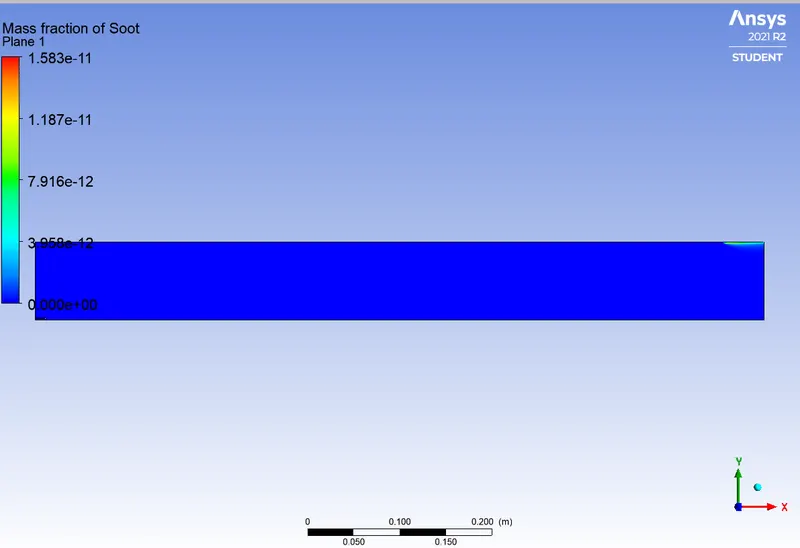
Mass fraction of soot formation
Mass fraction Chart of NO
Mass Fraction Chart of Soot Formation
DP2
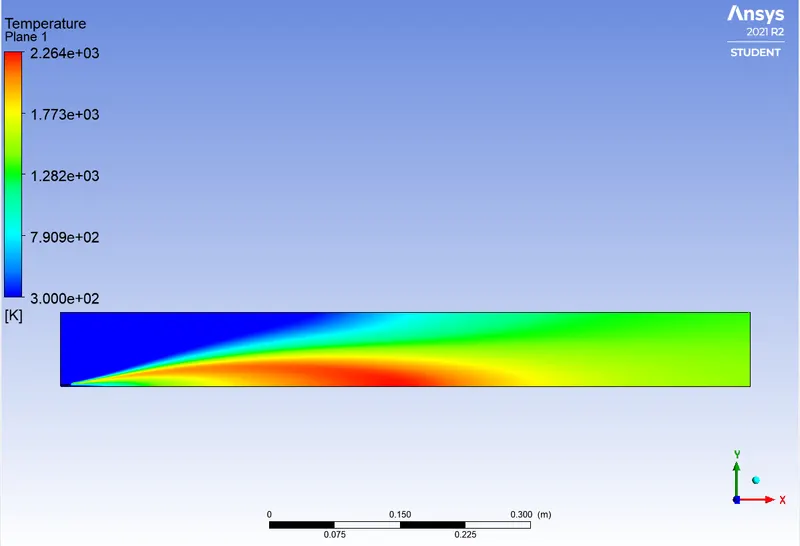
Temperature contour
Maximum Temperature - 2264K
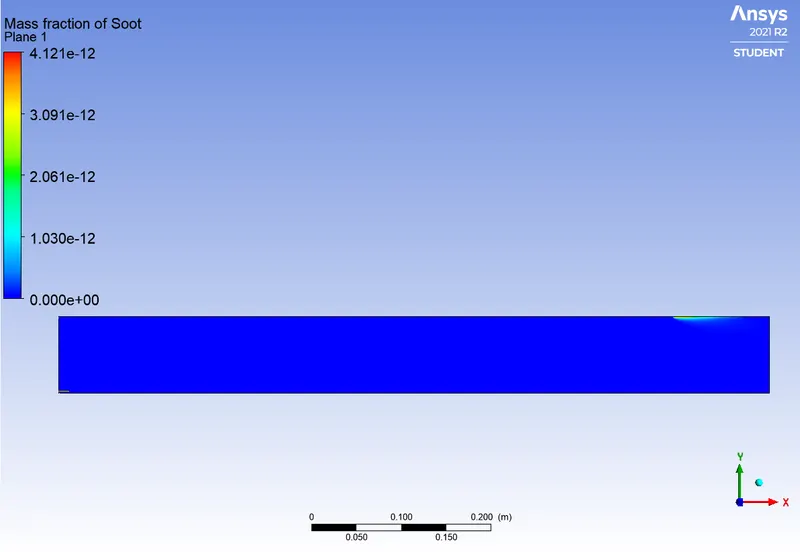
Mass fraction of Soot
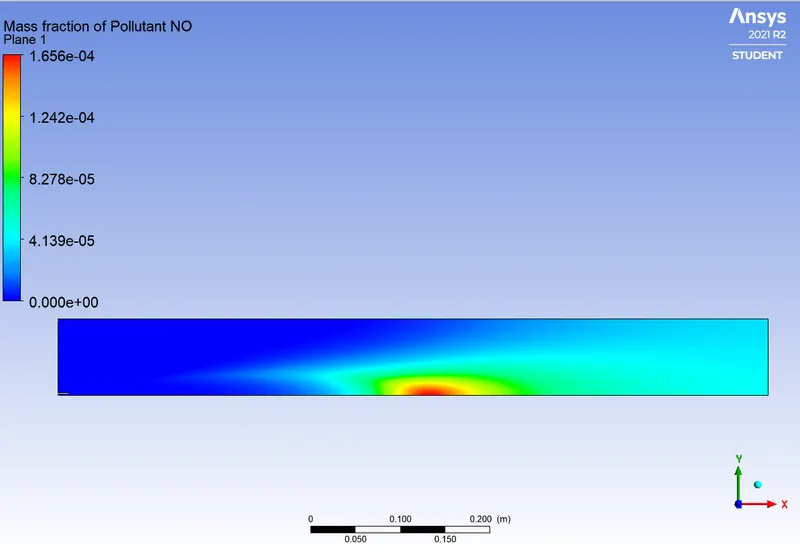
Mass fraction of Soot formation
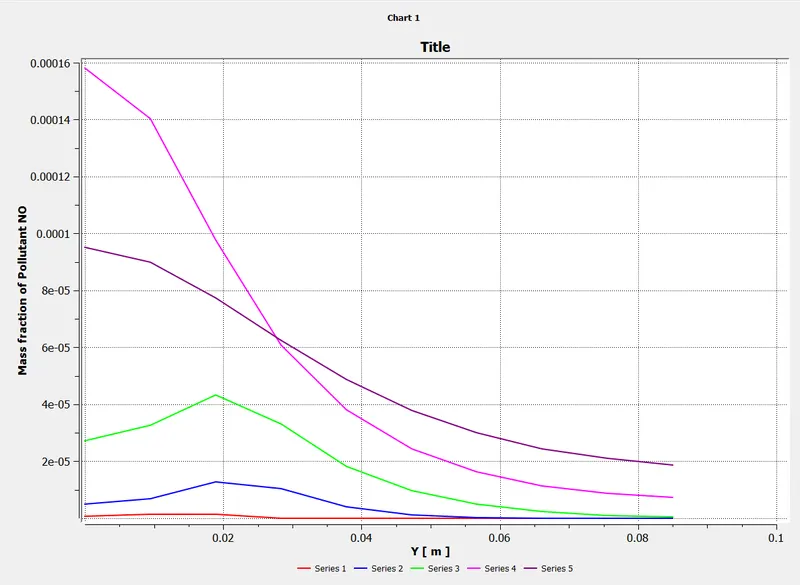
Mass fraction chart of NO
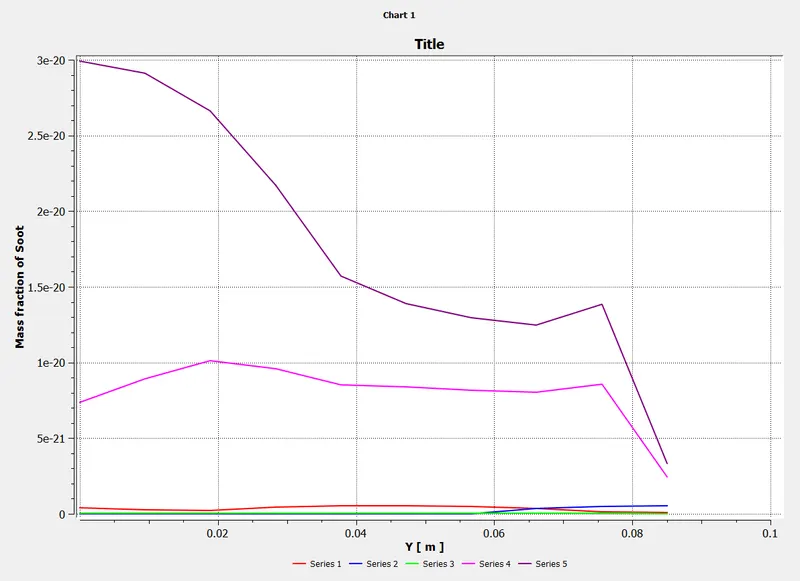
Mass Fraction chart of soot formation
DP3
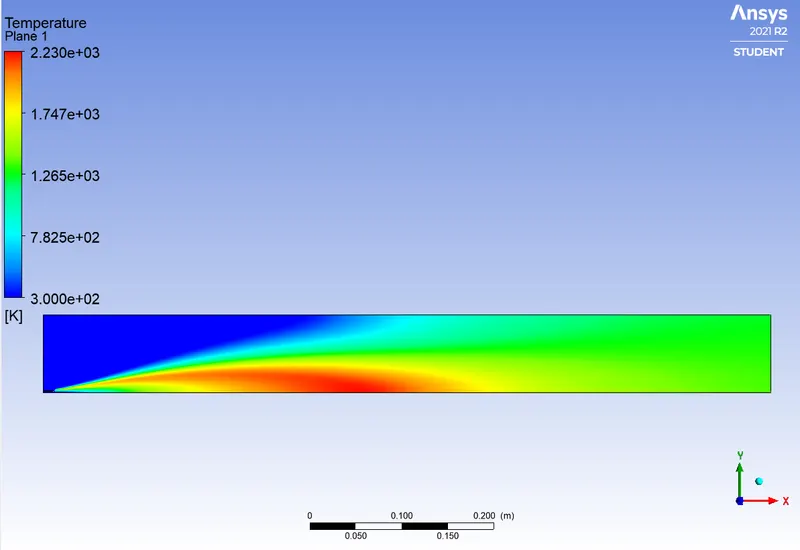
Temperature Contour
Maximum Temperature - 2230K
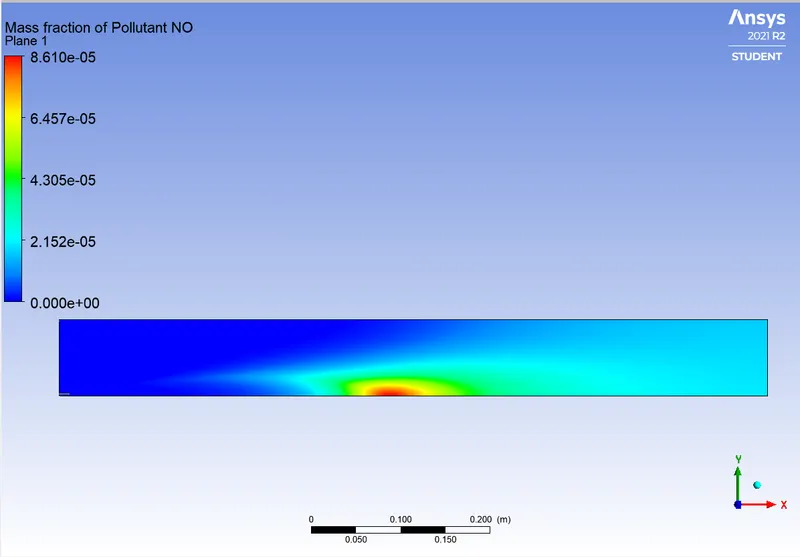
Mass fraction of NO
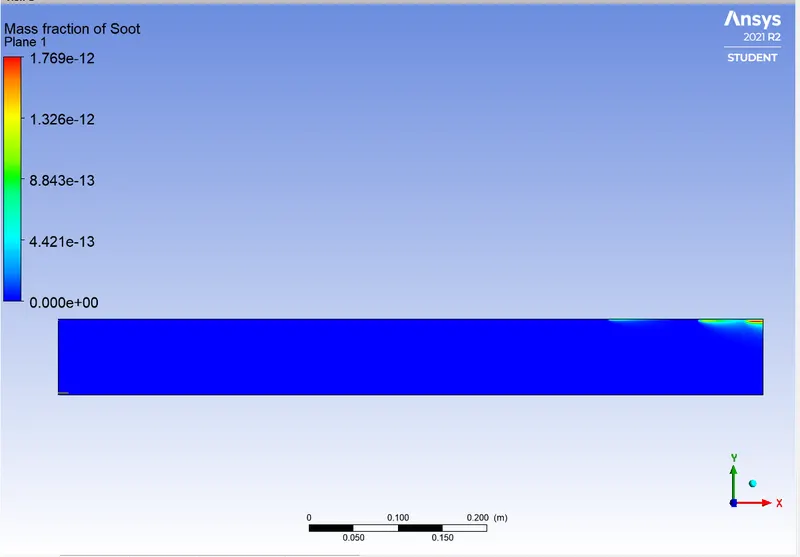
Mass fraction of Soot formation
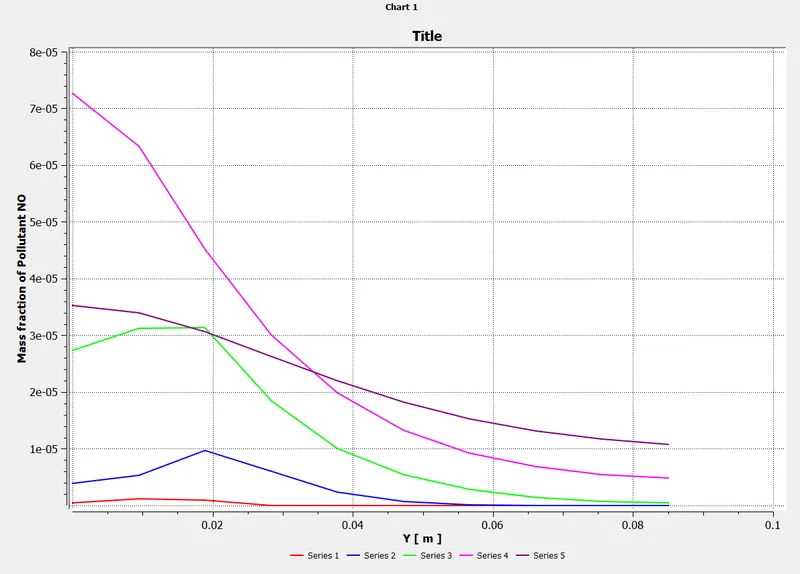
Mass fraction chart of pollutant
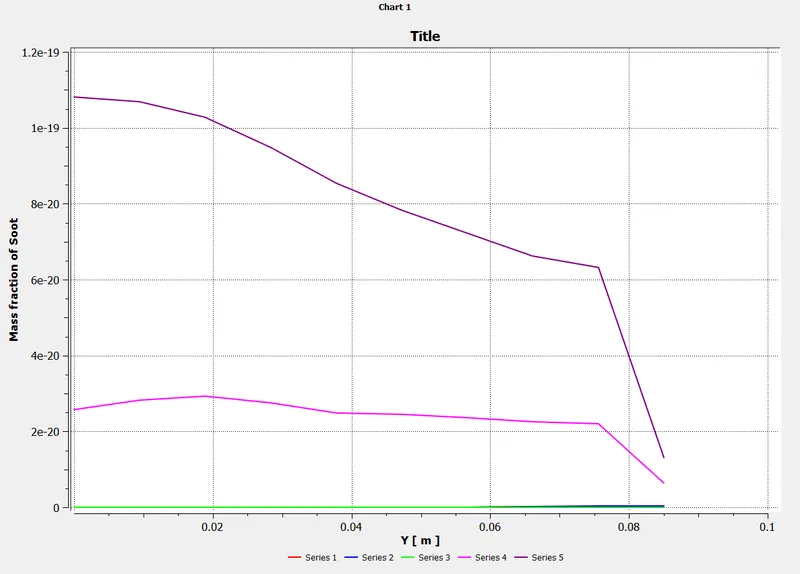
Mass fraction chart of soot formation
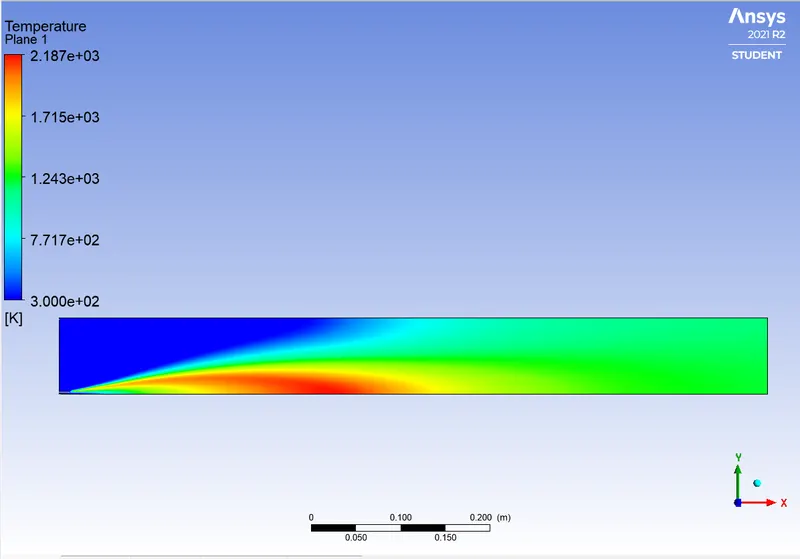
DP4
Temperature Contour
Maximum Temperature - 2187K
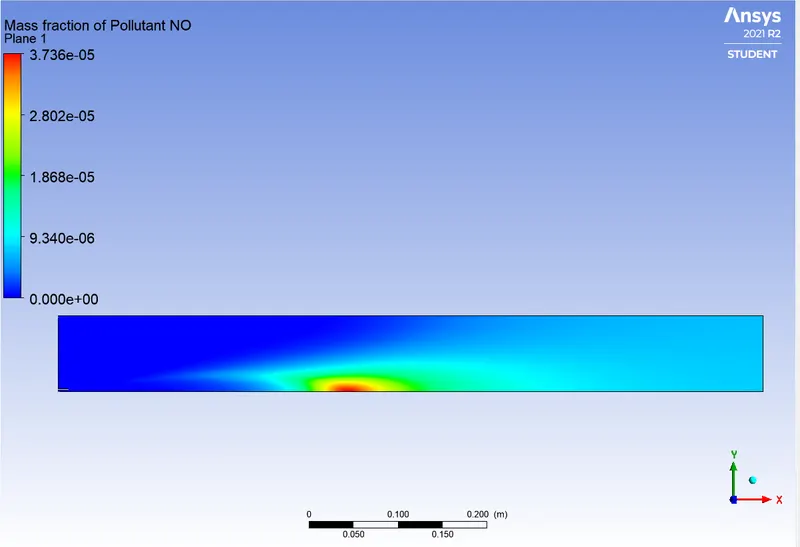
Mass fraction of NO
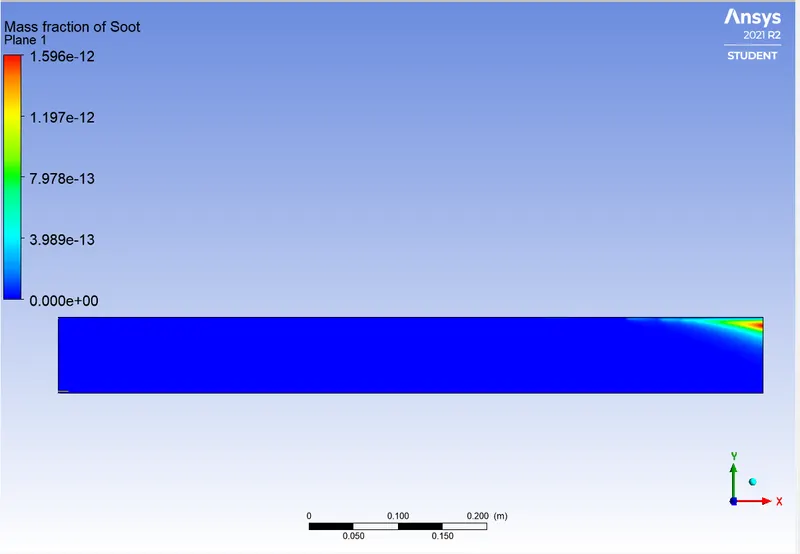
Mass Fraction of Soot formation
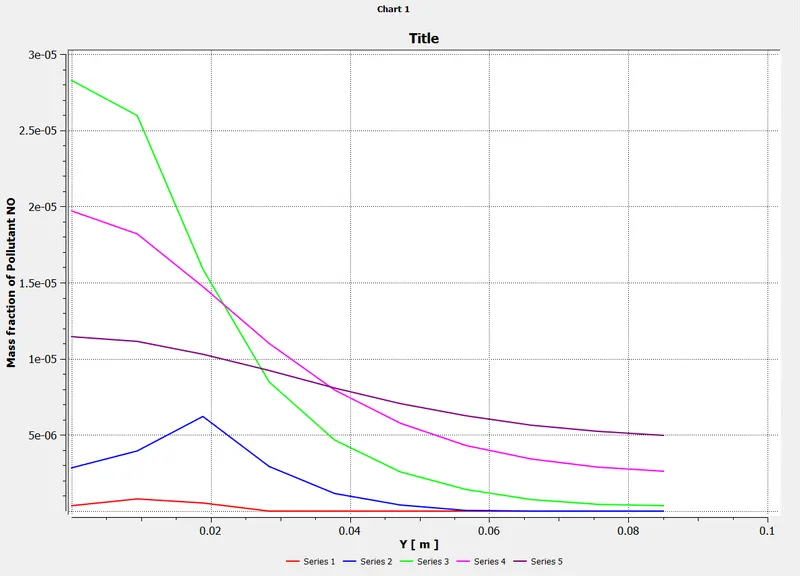
Mass Fraction Chart of NO
Mass fraction Chart of SOOT formation
DP 5
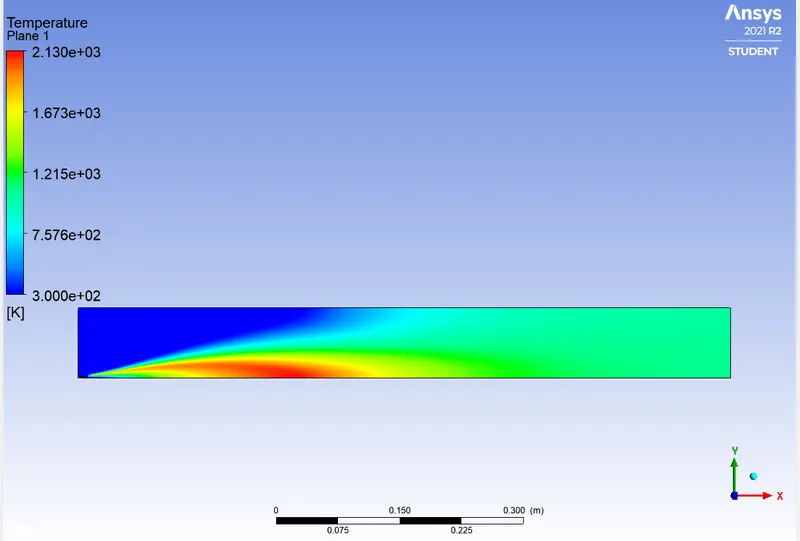
Temperature Contour
Maximum Temperature - 2130 K
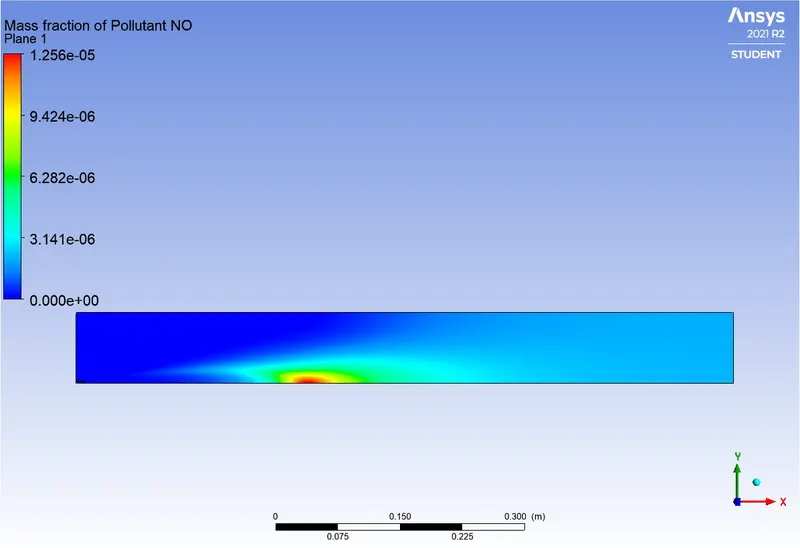
Mass fraction of NO
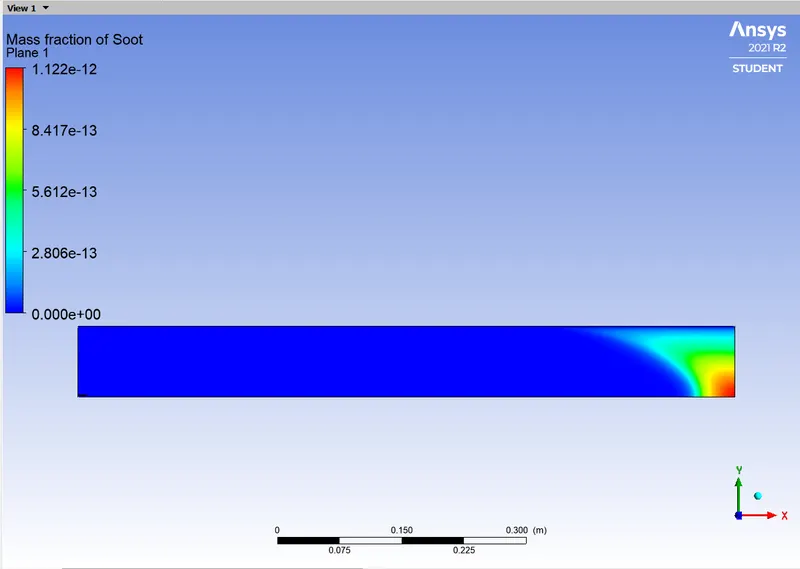
Mass fraction of Soot Formation
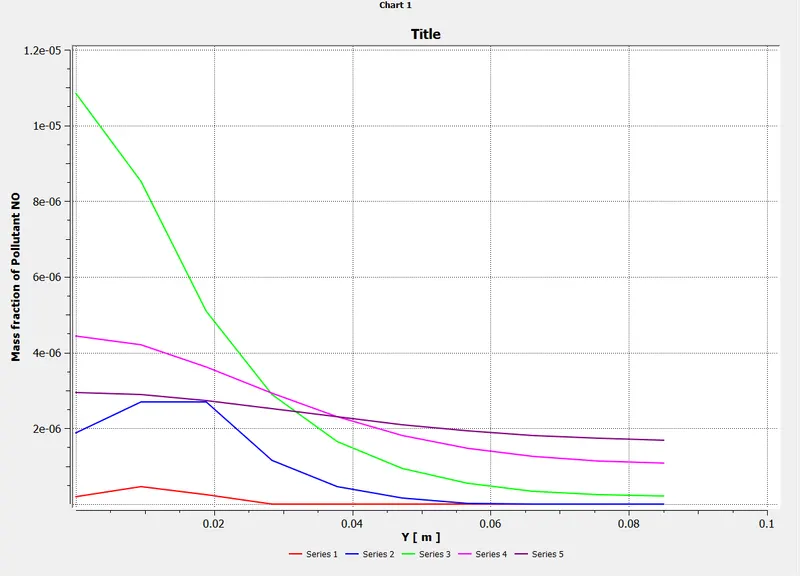
Mass fraction chart of NO
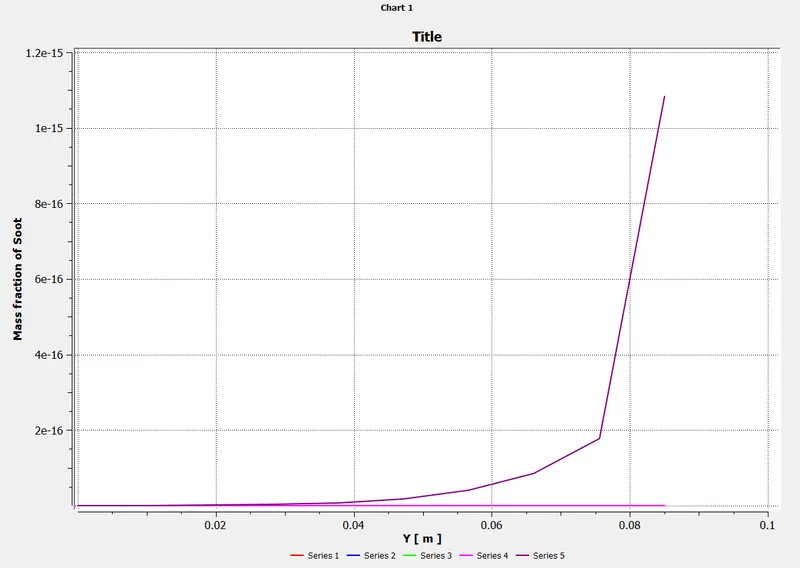
Mass fraction chart of soot formation
Conclusion
With the addition of water, the temperature of the gases at the outlet is decreased with the increase in the % of water. The maximum temperature observed is 2312k and the minimum temperature is 2179 K.
Latent heat absorption of water particles during the combustion will lower the temperature resulting in the reduction of pollutants NO. so pollutant NO emission decrease with an increase in the addition of water.
The temperature of CO2, H2O have similar contours, which means the species mass fraction depends on the effective combustion.
An Oscillatory decrease is observed in the formation of soot particles in the order of DP2>DP3>DP4>DP1, the lowest value observed is in DP0, where water percentage is 0