Material Modeling for Hyperelastic Material using LS-DYNA
OBJECTIVE
- To calculate the Mooney Rivlin and Ogden material constants.
- To compare it with the stress-strain data from the dog bone specimen tensile test.
PROCEDURE
In this work, the hyperelastic material had to model. The stress-strain curve of the hyperelastic material is not like metals. Unlike the stress-strain curve for metals, which becomes non-linear after elastic limit and shows plastic behavior, the hyperelastic material shows linearity for a very short length of the curve, after which it goes into non-linear elastic for up to around 500% of strain. This is why modeling the material for hyperelastic material is different from metals.
Unlike metals, where the engineering stress-strain curve was converted to effective stress and effective plastic strain, in the hyperelastic case, the engineering stress-strain can be directly taken as an input, if it is smooth. The figure below shows the denoised stress-strain curve obtained from the experimental. It was taken as an input for modeling the hyperelastic material.
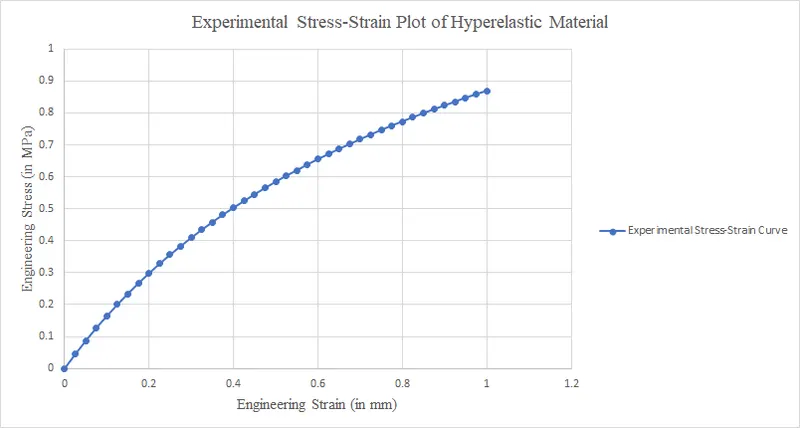
Figure 1: Stress-Strain curve obtained from experimental results.
To check, out of Mooney Rivlin and Ogden material model, which model best fits with experimental data points, a tensile test on dog specimen had to perform using both material models. Thus, a dog bone specimen was imported into ls-dyna as shown below.
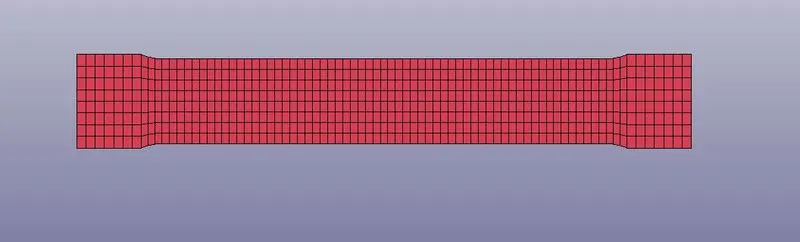
Figure 2: Dogbone specimen for virtual tensile test.
The engineering stress-strain curve obtained from the experiment has to be input, first, before proceeding to further steps. Using *DEFINE_CURVE card, the data was taken as an input to ls-dyna, as shown below.
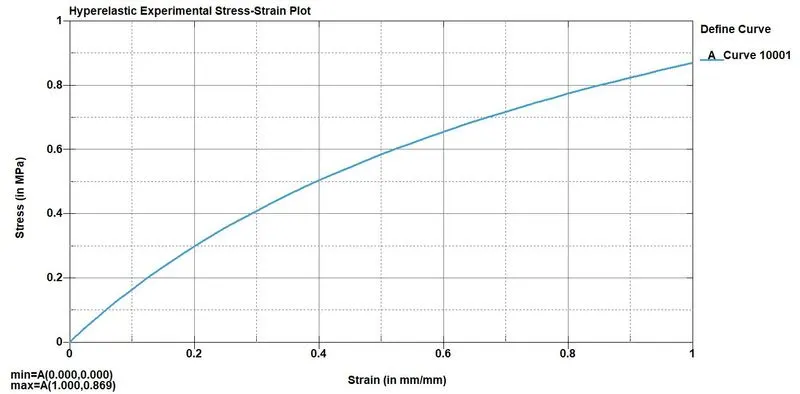
Figure 3: Experimental stress-strain curve taken as input to ls-dyna.
To assign the hyperelastic material, *MAT_HYPERELASTIC_RUBBER_(TITLE) (077_H) card was selected. In that card, N=1 was selected to calculate the Mooney-Rivlin constants, and provide it the engineering stress-strain curve as input. This calculates the C10 and C01 constants of Mooney-Rivlin.
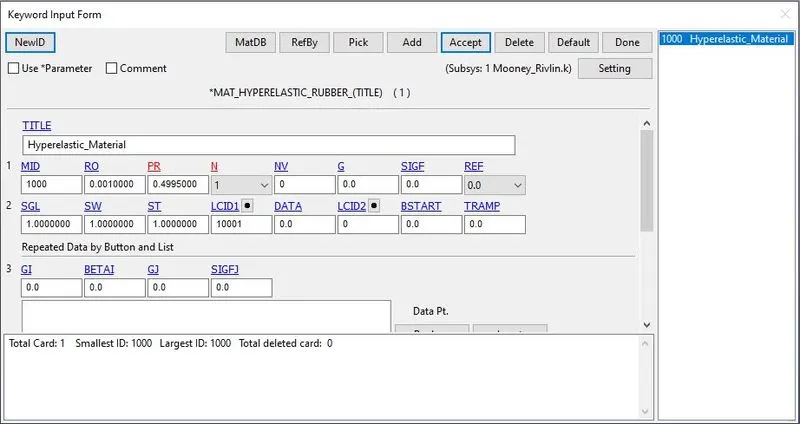
Figure 4: *MAT_HYPERELASTIC_RUBBER_(TITLE) (077_H) card with curve defined, and N=1.
After material, the *SECTION_SHELL card was selected to assign the thickness of 2 mm to the specimen. Then, in the boundary condition, the specimen had to apply the tension as similar to the UTM testing machine. For that, three boundary conditions were applied to the specimen, as shown in the figures below.
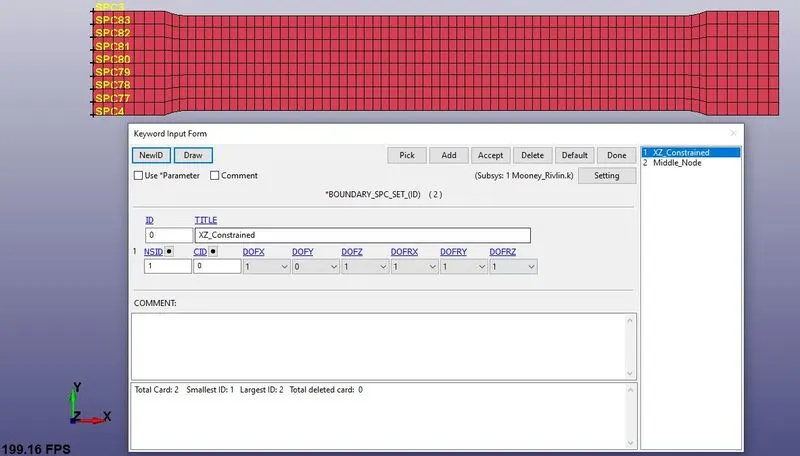
Figure 5(a): Extreme left nodes constrained in x and z direction, but free to move in the y-direction, to allow lateral deformation.
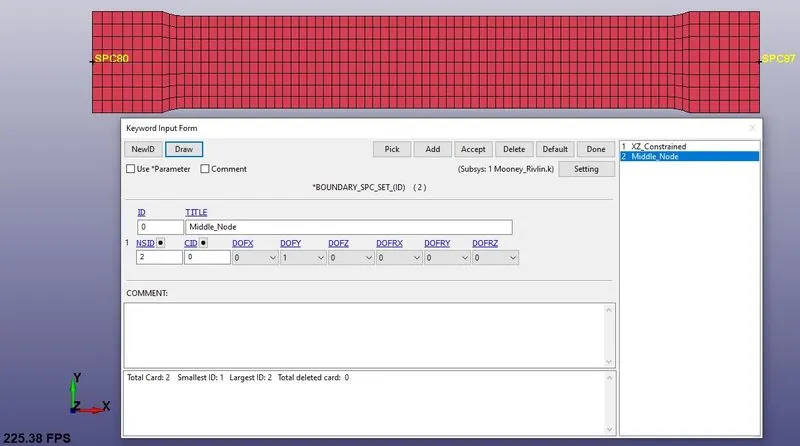
Figure 5(b): Middle nodes of the extreme left and extreme right constrained in the y-direction, to provide support to the specimen.
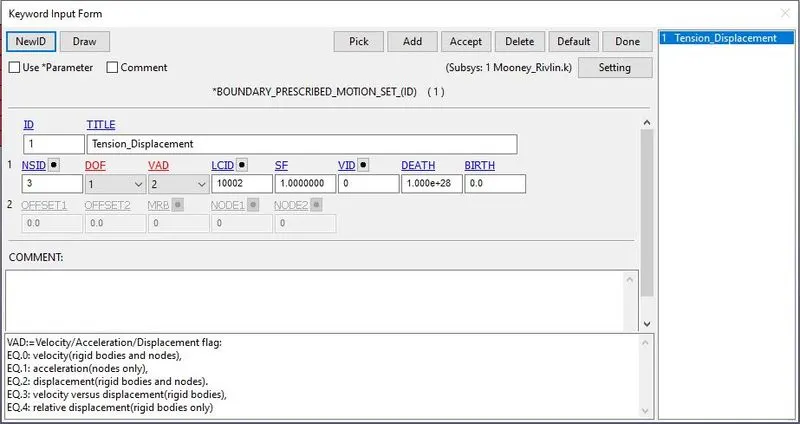
Figure 5(c): *BOUNDARY_PRESCRIBED_MOTION_SET card to assign the displacement to the extreme right nodes, using the curve data shown in fig. 5(d).
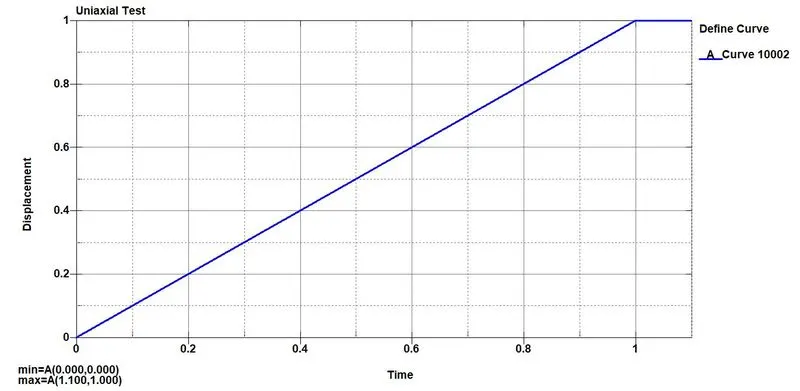
Figure 5(d): Displacement curve provided as an input for boundary condition, to the extreme right nodes of the specimen.
From figure 5(a), (b), (c), and (d) it can be seen that how the boundary conditions were applied to the specimen, to perform the uniaxial tensile test.
Further, as a part of controlling the solver, *CONTROL_TERMINATION card was provided with the end time of simulation equal to 1s. The simulation had to run implicitly, thus the *INCLUDE_IMPLICIT_GENERAL card was introduced. For the animation output, *DATABASE_BINARY_D3PLOT card was called, and along with that in *DATABASE_ASCII_option card, GLSTAT, MATSUM, and ELOUT was called.
The figure below shows the Von-Mises contour of the simulation. It was observed from the simulation that the kind of animation was similar to the UTM test. There was an elongation in the x-direction with lateral deformation in the y-direction. After confirming the simulation, the next step was to check the value of Moone-Rivlin constants.
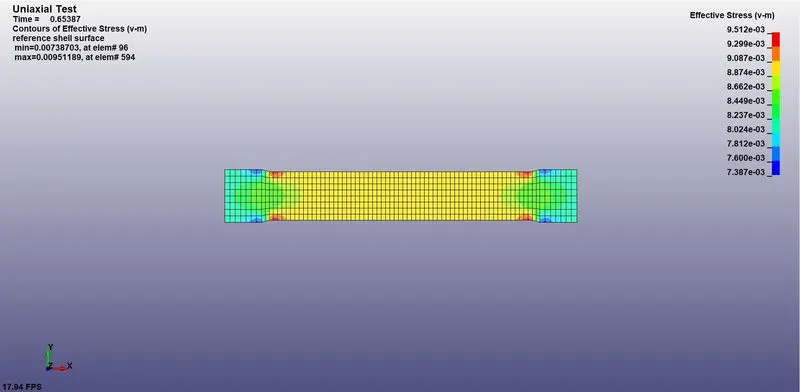
Figure 6: Von Mises contour of the simulation with a maximum stress of 9.512E-03 MPa with 4.4E-03 strain value in the x-direction.
From the .d3hsp file of the simulation, the following data was collected. In the data output of the simulation Mooney constants can be seen as Mooney constant c1 = 0.1768E+00, and Mooney constant c2 = 0.1474E+00. Along with these constants, some more data can also be seen. The extension, and the stress values, are nothing but stretch and the true stress values.
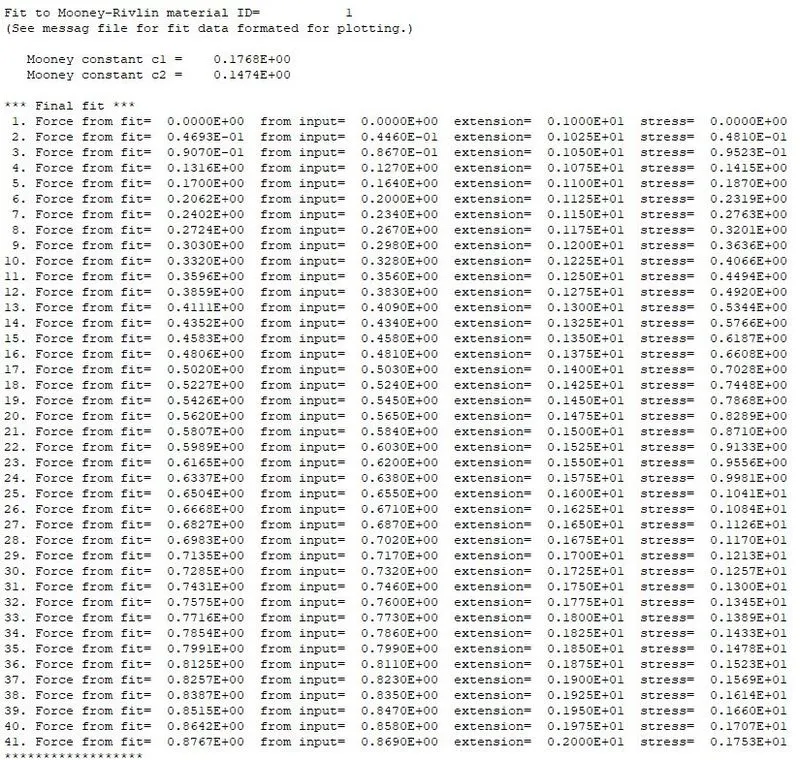
Figure 7: Mooney constants and other tensile test data obtained from simulation.
Using the formulas shown below, the values of extension and stress were converted to engineering strain and stress respectively. And the engineering stress vs. strain plot was drawn, which can be seen in fig. 8.
Stretch = 1 + Engineering strain
True Stress = Engineering Stress * (1 + Engineering Strain)
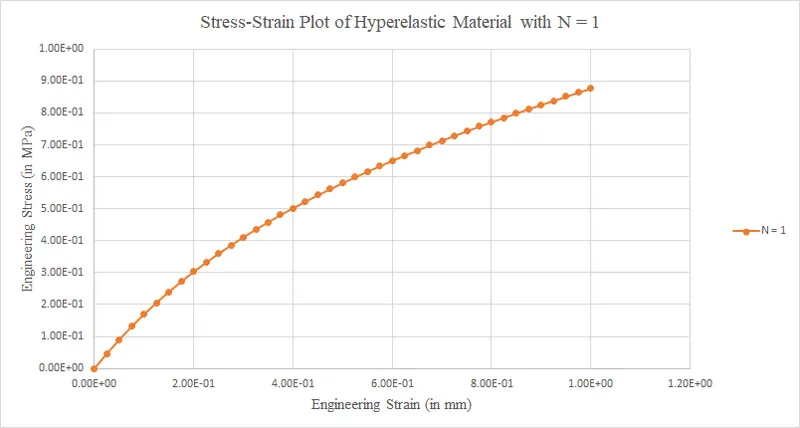
Figure 8: Engineering stress-strain plot obtained from simulation with N=1.
Similar to earlier steps, results were also obtained for N = 2, and N = 3. And the three plots i.e., N=1, 2, and 3 were compared with the experimental result, as shown below.
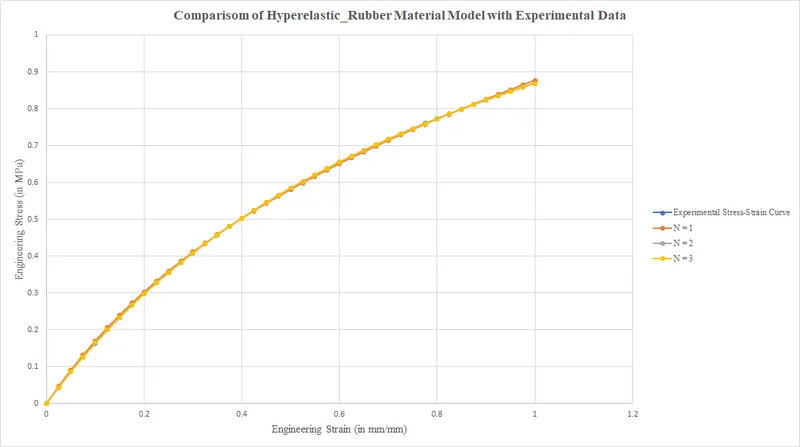
Figure 9: Stress-Strain curve comparison between experimental data, and hyperelastic material model with N = 1, 2, and 3.
From fig. 9, it can be observed that all the curves are superimposing. No significant change can be seen in the plot. Thus *MAT_HYPERELASTIC_RUBBER can be used as the material model with any N value. The figure below shows the complete output data obtained from the simulation.
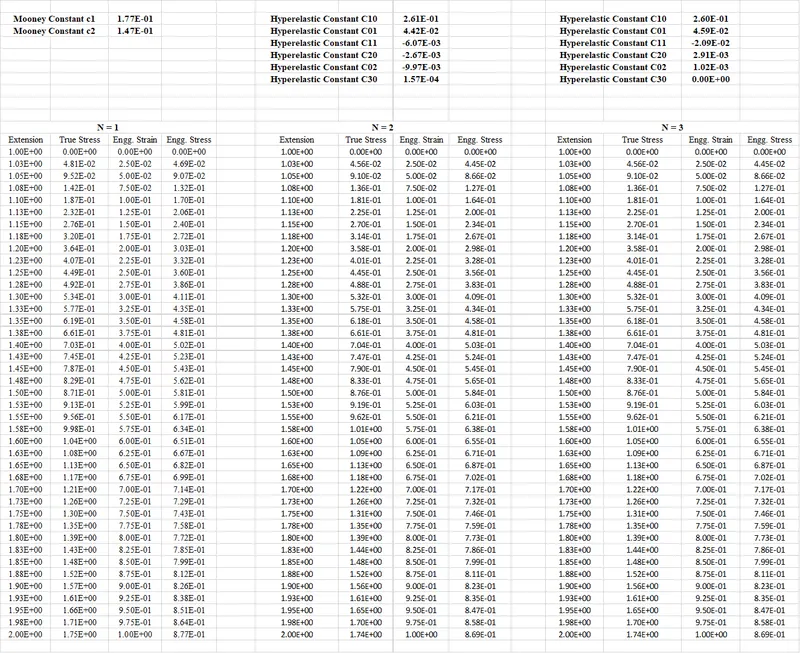
Figure 10: Output data obtained from the simulation file.
In the second case, everything remained the same, only the material model was changed. In this case, instead of *MAT_HYPERELASTIC_RUBBER, *MAT_OGDEN_RUBBER material model was used for the specimen. The data points obtained from the experiment were provided similar to the first case, saved the file, and the simulation was started. Following data were obtained from the .d3hsp output file of the simulation.
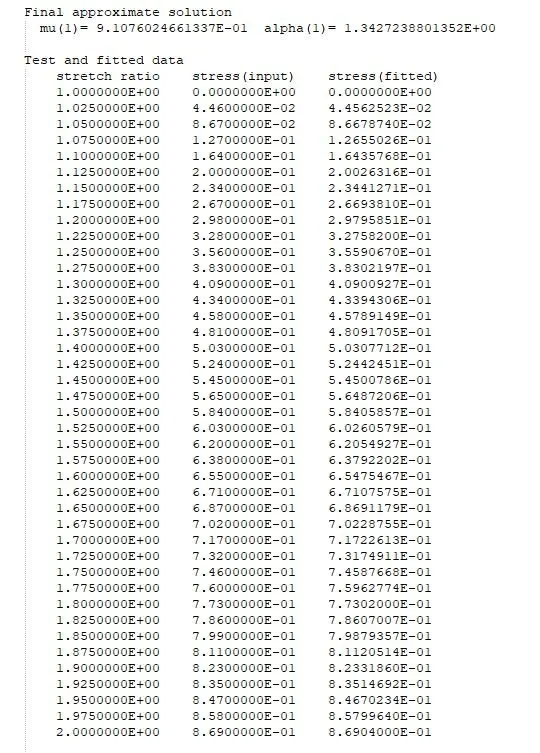
Figure 11: Ogden constants and other tensile test data obtained from simulation, with N = 1.
The simulation, with Ogden material model, was ran for N = 1, 2, and 3, and using the same formulas shown above, the output data was converted to engineering stress and strain values, and the plot was drawn comparing it with experimental data, as shown below.
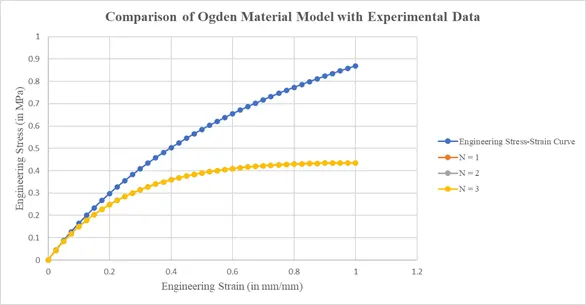
Figure 12: Stress-Strain curve comparison between experimental data, and Ogden material model with N = 1, 2, and 3.
From fig. 12, the distinct deviation can be seen between the experimental stress-strain curve, and the curve obtained from the simulation. Thus, Ogden material cannot be used as a material model for this material. The figure below shows the output data obtained from the simulation using the Ogden material model.
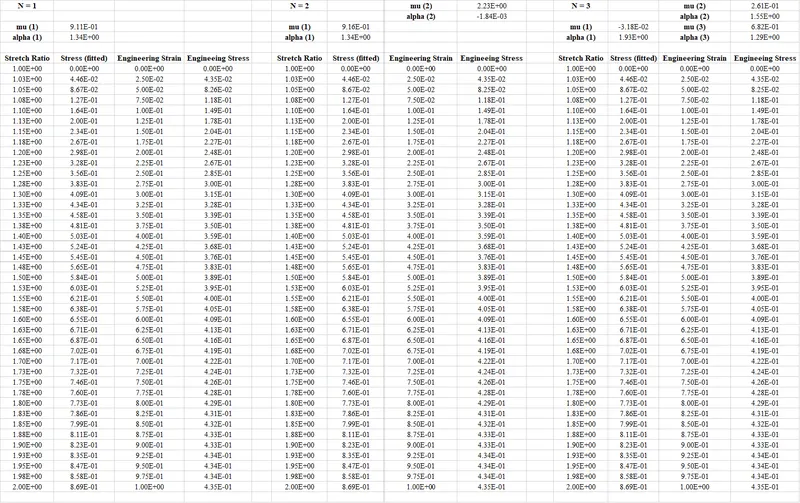
Figure 13: Output data obtained from the simulation file, using Ogden material model.
CONCLUSION
In this work, a stress-strain curve obtained from the experimental test was available. Using this data, out of *MAT_HYPERELASTIC_RUBBER, and *MAT_OGDEN_RUBBER material, which best fits the experimental data had to check. Also, the Mooney-Rivlin and Ogden constants had to check. Thus, to perform it, the experimental data was feed into ls-dyna, and a tensile test was performed on a dog bone specimen. A plot of engineering stress-strain was drawn from the output of the simulation and compared with the experimental data. After comparing, it was observed that the *MAT_HYPERELASTIC_RUBBER best fits with the experimental data, with any N value. And thus, it can be used as a material card for this particular material, with the Mooney constants values obtained from the simulation, instead of the experimental curve data. On the other hand, because the engineering stress-strain curve, obtained from the simulation by using *MAT_OGDEN_RUBBER material model, was too deviating from the experimental curve, it is not a good choice to use a material card for this particular material.