Week - 10 Hyperelastic Material Models
Given the material data below, calculate the Mooney Rivlin and Ogden material constants and compare the both using stress-strain data from a Dogbone specimen tensile test with 100 percent strain. The given data is the engineering stress-strain in MPa/(mm/mm). The comparison should be shown from the d3hsp file and using simulation.
Answers:
Aim-
- The aim of the assignment is to compare the below engineering stress-strain curve of a hyper-elastic material's output behaviour in a case of 100% strain to compare with different Mooney - Rivlin conditions and validate the results.
- The data is given below
-
Eng. Strain Eng. Stress (MPa) 0 0 0.025 0.045 0.05 0.087 0.075 0.127 0.1 0.164 0.125 0.2 0.15 0.234 0.175 0.267 0.2 0.298 0.225 0.328 0.25 0.356 0.275 0.383 0.3 0.409 0.325 0.434 0.35 0.458 0.375 0.481 0.4 0.503 0.425 0.524 0.45 0.545 0.475 0.565 0.5 0.584 0.525 0.603 0.55 0.62 0.575 0.638 0.6 0.655 0.625 0.671 0.65 0.687 0.675 0.702 0.7 0.717 0.725 0.732 0.75 0.746 0.775 0.76 0.8 0.773 0.825 0.786 0.85 0.799 0.875 0.811 0.9 0.823 0.925 0.835 0.95 0.847 0.975 0.858 1 0.869
-
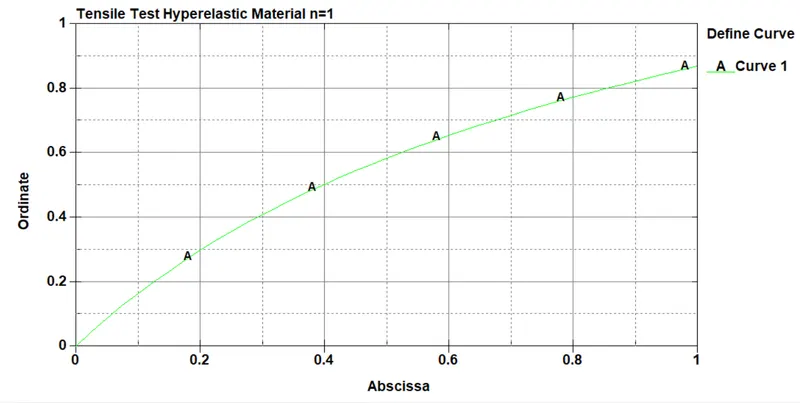
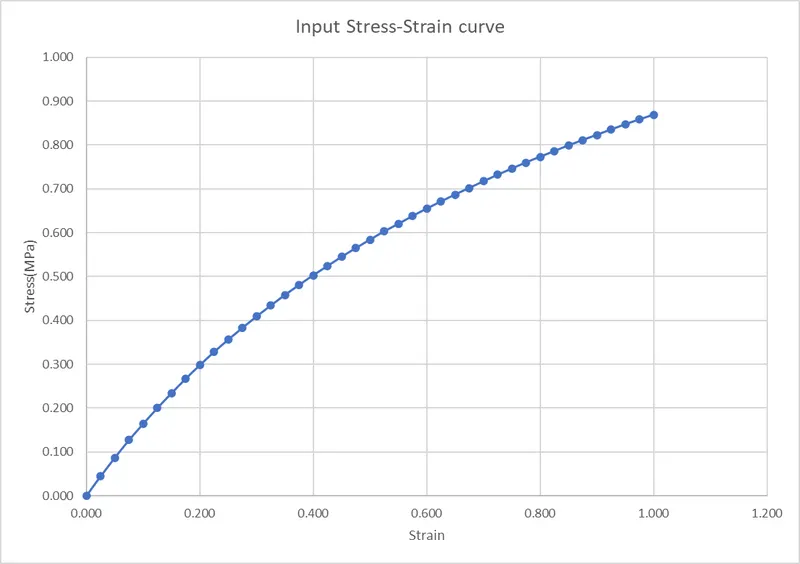
- The curve of the input material is given below
- The data is given below
Procedures-
- The first procedure is to copy the above material data and export as .csv file to use it as material curve input.
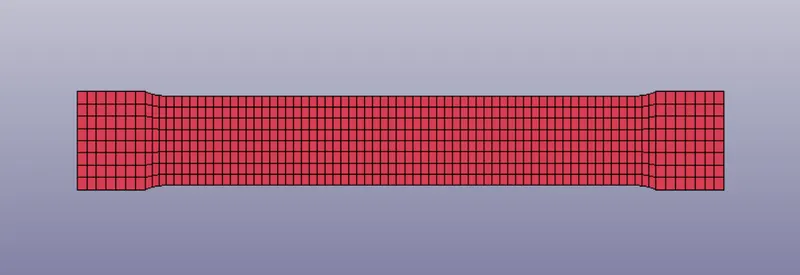
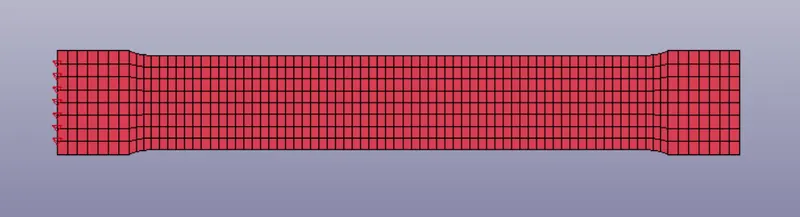
- The next step is to open the dog-bone mesh file in LS-Dyna pre-post UI.
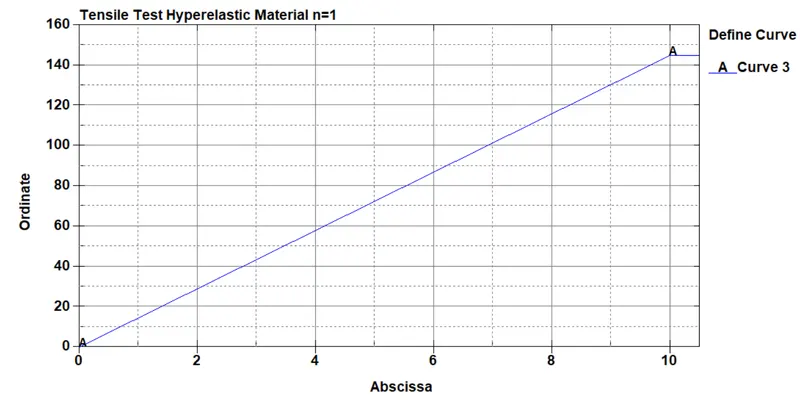
- The next step is to create the curve for defining the material property. The input curve is given below
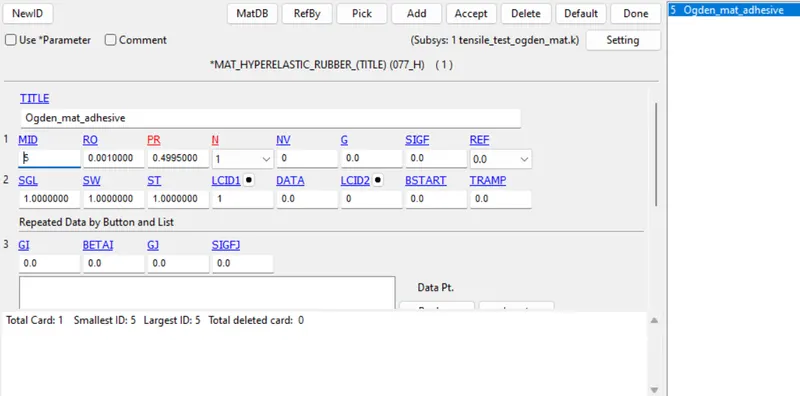
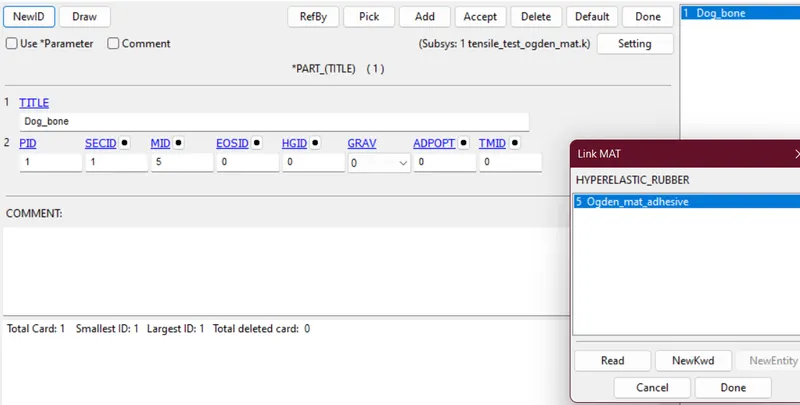
- The next step is to create the material card referencing the material curve in MAT (077_H) property which is Hyperelastic- Rubber.
- The Young's modulus for the material can be calculated using the engineering data
- `E =0.045/0.025=0.001`
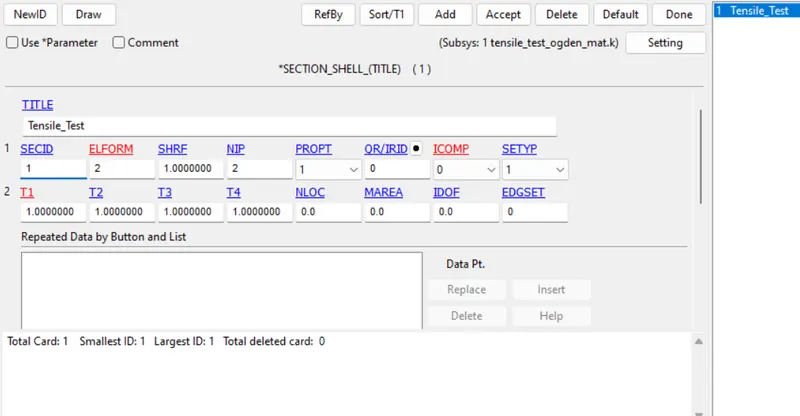
- The next step is to define the section card with the section card
- The next step is to reference both the section and mat card in part card and save it.
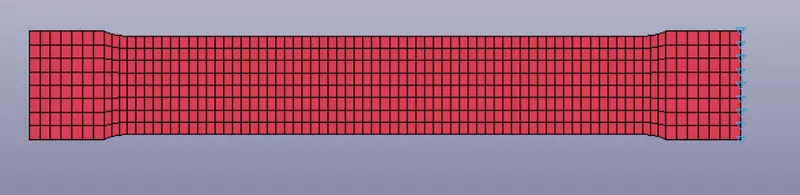
- The next step is to apply the boundary condition which is to fix one of the dog bone
- The next step is to apply a load, as we are giving the displacement as the prescribed motion load which is provided as a load curve and given below
- The next step is to give the control cards to define termination time and timestep.
- The next step is to give the output files to define database cards.
- There are three analyses for different n values for n values at 1,2, & 3 are to be done in order to compare the results with input material properties.
- For n=1
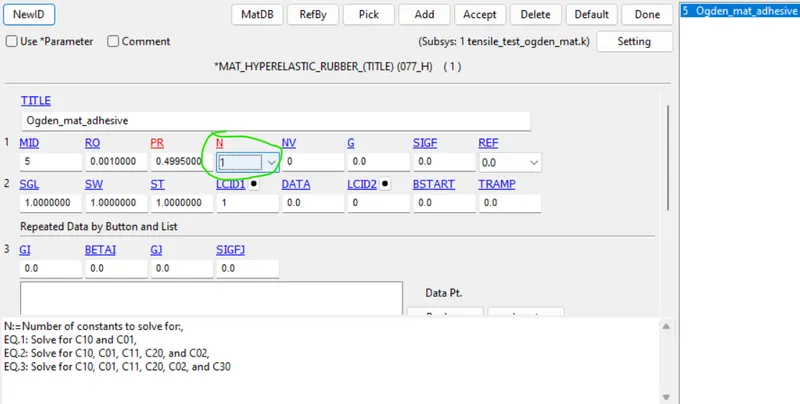
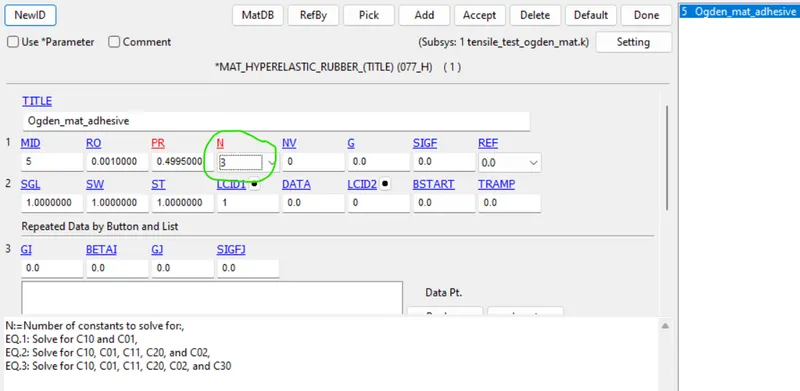
- The first step is to input n as 1 in the mat card to behave it as an equation with two constants.
- After the run of this scenario, the Mooney-Rivlin constant for this run is given below
-
Mooney Const. c1 0.1767 c2 0.1475
-
- The output stretch and true stress value of this run is shown in a detailed manner in the below-attached spreadsheet.
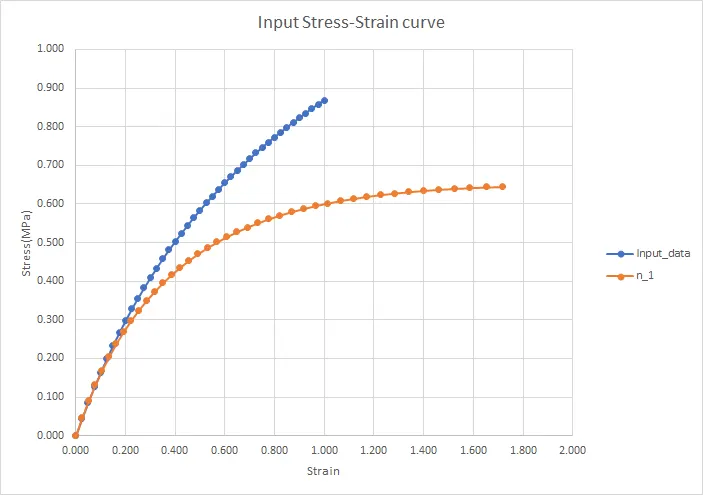
- The comparison between the input data and the output data for this case is
- As we can see from the above image the input and output vary a lot after a 0.2 strain but till this point, the curve follows the input property curve.
- The first step is to input n as 1 in the mat card to behave it as an equation with two constants.
- For n=2
-
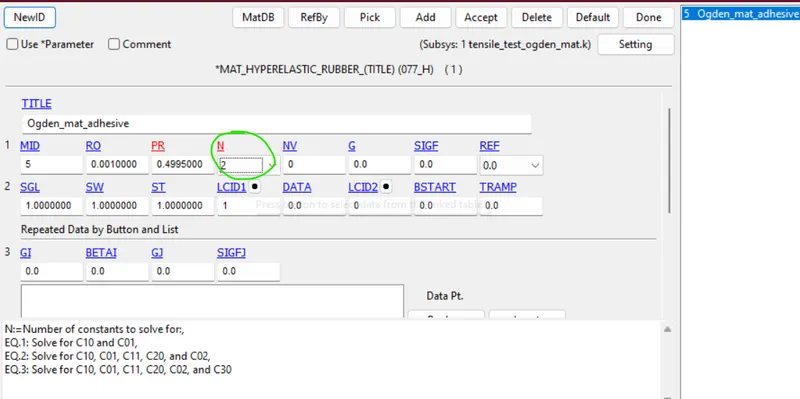
- The first step is to input n as 2 in the mat card to behave it as an equation with two constants.
- After the run of this scenario, the Mooney-Rivlin constant for this run is given below
-
Mooney Const. C10 2.52E-01 C01 5.45E-02 C11 -3.23E-02 C20 5.94E-03 C02 1.46E-02 C30 0.00E+00
-
- The output stretch and true stress value of this run are shown in a detailed manner in the below-attached spreadsheet.
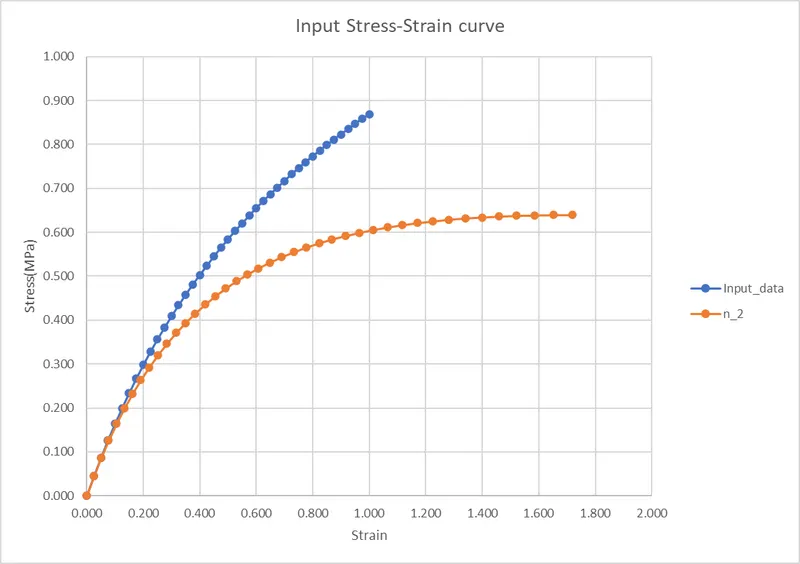
- The comparison between the input data and the output data for this case is
- As we can see from the above image the input and output vary a lot after a 0.2 strain but till this point, the curve follows the input property curve.
- The first step is to input n as 2 in the mat card to behave it as an equation with two constants.
-
- For n=3
-
- The first step is to input n as in the mat card to behave it as an equation with two constants.
- After the run of this scenario, the Mooney-Rivlin constant for this run is given below
-
Mooney Const. C10 2.43E-01 C01 6.40E-02 C11 -1.13E-01 C20 3.64E-02 C02 7.45E-02 C30 -8.54E-04
-
- The output stretch and true stress value of this run are shown in a detailed manner in the below-attached spreadsheet.
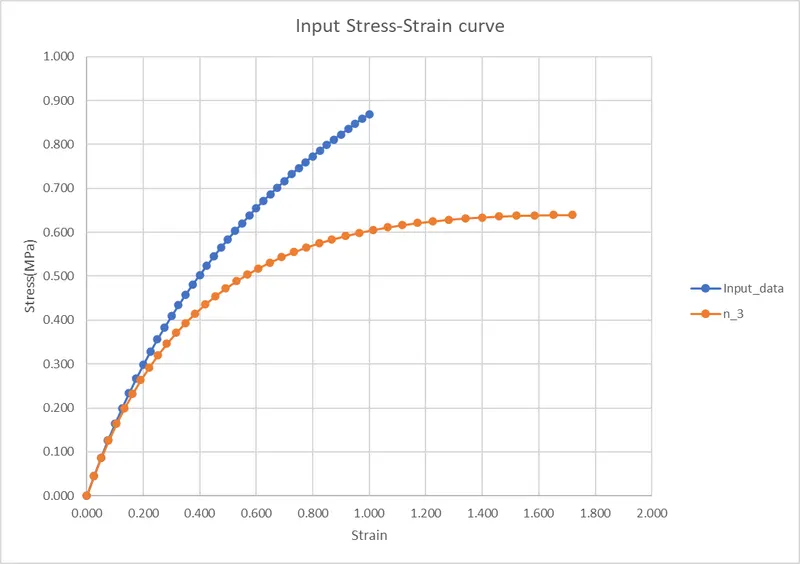
- The comparison between the input data and the output data for this case is
- As we can see from the above image the input and output vary a lot after a 0.2 strain but till this point, the curve follows the input property curve.
- The first step is to input n as in the mat card to behave it as an equation with two constants.
-
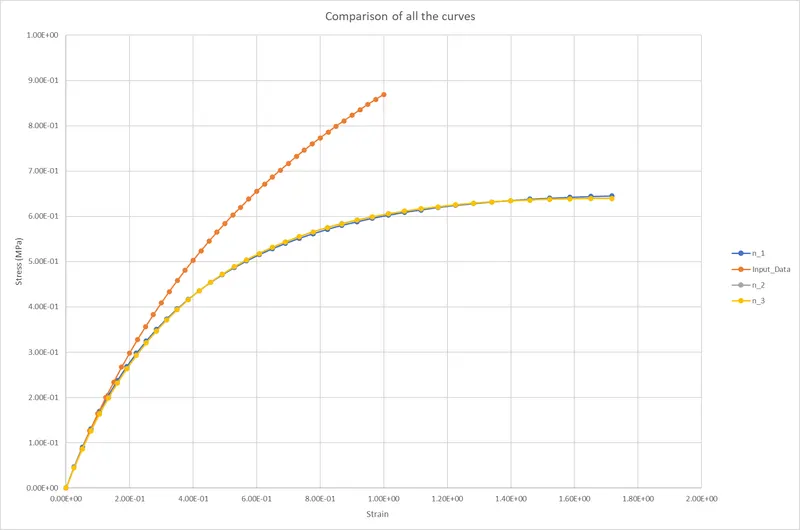
- The comparison between all the cases in one window of the image is given below
- For n=1
- Conclusion:
- From this image, we can conclude that the solver can't able to capture the property of this Hyperelastic material using the 077_H mat card, so this needs to be modified using some other material models. We can also compare the Mooney Rivlin constant of all the cases above and we can see that the higher order coefficients are very small it suggesting that all the curves have more or less similar behaviour.