Week - 10 Hyperelastic Material Models
AIM
The aim of this project is understand how to model a hyper elastic material from raw input data and validate the same.
EXPLANATION
A hyperelastic material stress-strain data from a tensile test is usually represented by using a polynomial. The method used to create a polynomial curve is often used to construct the graph of a hyper elastic material. There are different types of constitutive laws that can be used to recreate the input data like neo-hookean, mooney-rivlin etc. Different hyperelastic materials may be best represented by different types of constitutive laws. So, we need to make sure that the input data is correctly represented in ls-dyna otherwise errors may occur.
In this assignment we are given the engineering stress vs engineering strain data of a hypeselastic material. We need to calculate whether Mooney rivlin or Ogden material laws best represent the input data. For this we first need to give the input data to the hyper elastic material model and run a simple tensile test on a dogbone specimen and note the extension and stress values that ls-dyna has calculated from the d3hsp file and compare it to our input stress-strain data to see whether it closely resembles the input data. If any of the constitutive laws represents the hypeselastic material very closely then the constants generated by the constitutive laws can be noted down and input in the material model for faster calculations.
CASE SETUP
The input data is imported into excel file. The engineering stress data that is in MPa is converted to kg-mm-ms units for our convenience. A simple done bone specimen file is then loaded on to ls-prepost. *DEFINE_CURVE keyword is used to input the raw stress strain data into ls dyna.
First we need to find the Mooney- rivlin constant so we select *MAT_HYPERELASTIC_RUBBER as our material model and select N= 1 as it represents Mooney - rivlin equation. Density is taken as 1.6e-06, PR= 0.4999.
Then we input our engineering stress vs engineering strain that we have given in *DEFINE_CURVE in the LCID option. SGL, SW, ST are set to one.
In order to do a tensile test on the dogbone specimen. The 1st step is to arrest all DOF except translational degree of freedom in the x-direction of the neutral axis using *SPC SET keyword. The next step is to constrain the nodes at the end of the specimen in all directions except translation in y direction.For giving displacement to the specimen we need to first define a load curve. For this we use *DEFINE CURVE keyword. A load curve with a maximum displacement of 145mm is defined.*PRESCRIBED_MOTION SET keyword is used to give the required displacement in the x-direction and the displacement is given to the nodes at the end of the specimen. *SECTION SHELL is used to define the section of the specimenwith t1=1.0mm.
*PART_PART is used to give the correct section and material to the specimen.
*CONTROL_TERMINATION is used to give a termination time of 20ms.
*DATABASE-BINARY D3PLOT is activated with DT=0.1. *DATABASE ASCII option is used to activate GLSTAT and MATSUM with DT=0.1.
The simulation is then run and the d3hsp file is opened to get the Mooney rivlin constants c10and C01 as well as the output extension and true stress to compare with the input data to check whether the constitutive law correctly represents our hyperelastic material.
The output that we obtain is stretch vs true stress, so we need to convert it into engineering stress vs engineering strain. Stretch or extension can be converted to engineering strain using the formulae , STRETCH=1+ engineering strain. True stress can be converted to engineering stress using the formulae, ENGINEERING STRESS = TRUE STRESS/STRETCH.
Similarly, to find the Ogden material constants we use the keyword *MAT-OGDEN- RUBBER instead of * MAT-HYPER ELASTIC-RUBBER and do the simulation as before and take the output values from the d3hsp file.
RESULT
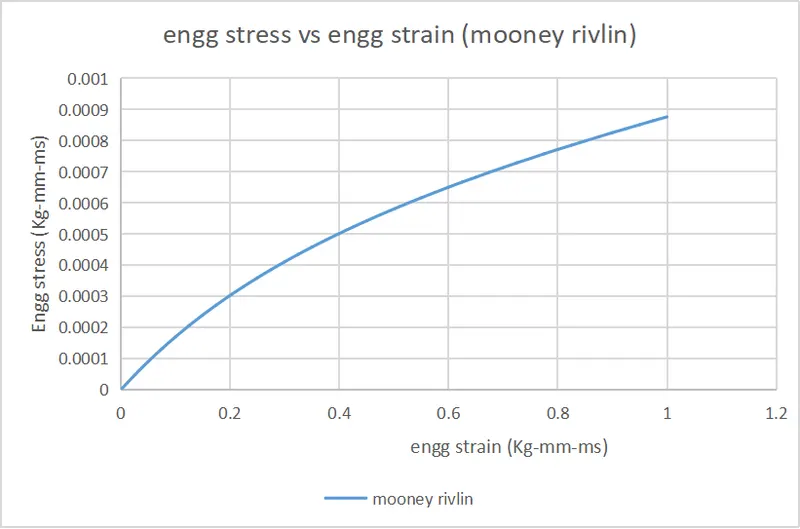
The mooney constants obtained after the simulation are C10 = 0.1768E-03 and C01 = 0.1474E-03 .
The output stress strain curve obtained after simulation is shown below.
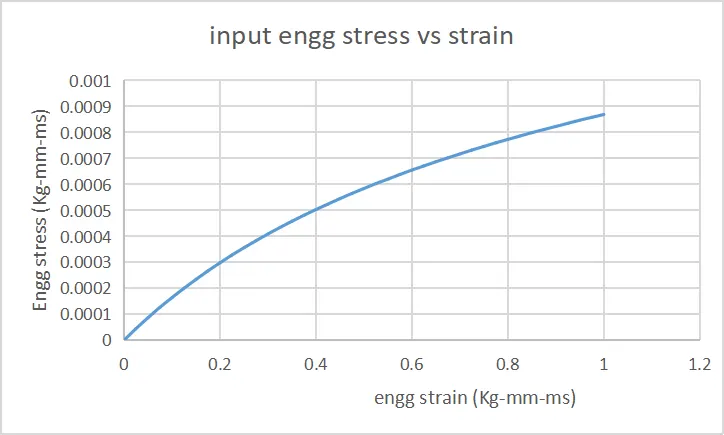
The input engineering stress vs engineering strain curve is shown below.
The input and output curves when plotted on the same graph is shown below.
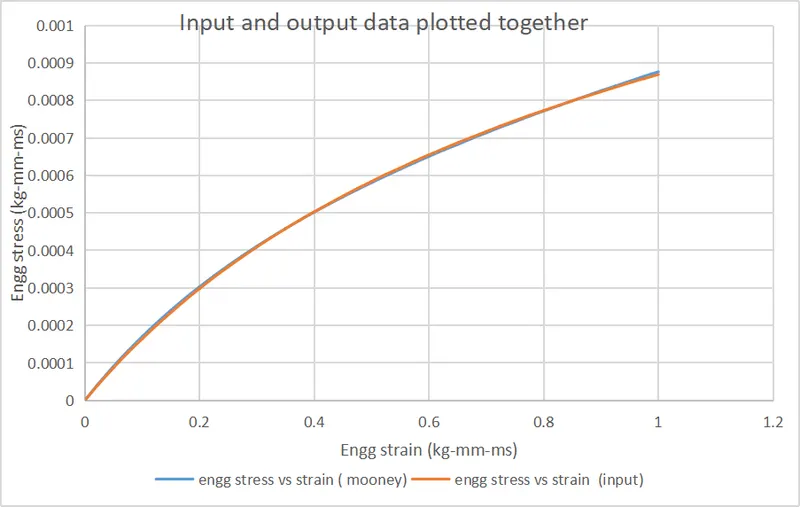
It can be seen that the output values closely mathes the input data .
The Ogden material constants obtained after the simulation is mu =9.1076025253111E-04 and
alpha = 1.342723867193.
The output engg stress vs engg strain plot obtained is shown below.
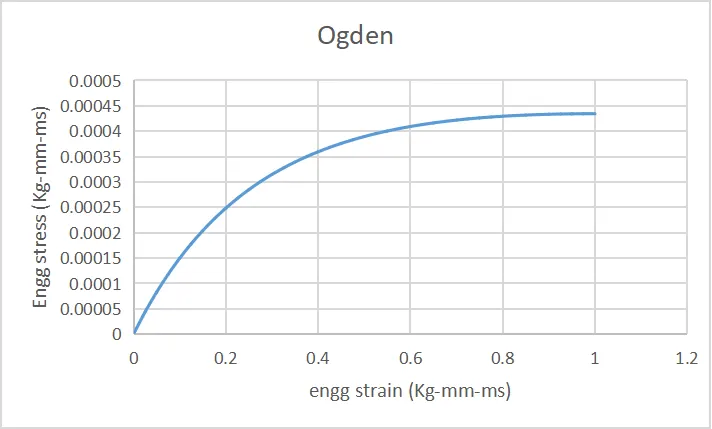
The input and output curves when plotted on the same graph is shown below.
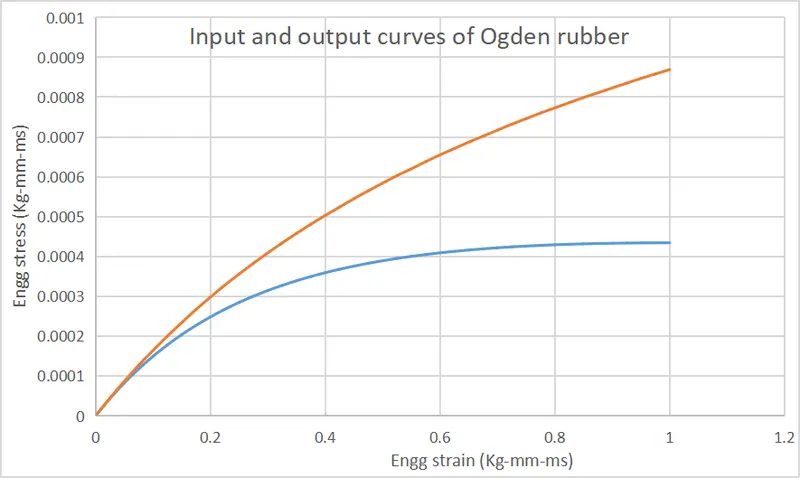
It can be seen that there is a huge variation in the output data from the input values.
CONCLUSION
It is clear from the plots that the mooney rivlin material model correctly represents our hyperelastic material and should be used when modelling this particular material.