Week 1 Stress Concentration on a Plate with hole
Q 11 Answer :
Objective:
- To determine and compare the maximum deformation and maximum stress developed in two different cases.
- To determine selection of Design from the Analysis and Manufacturing point of view.
Procedure:
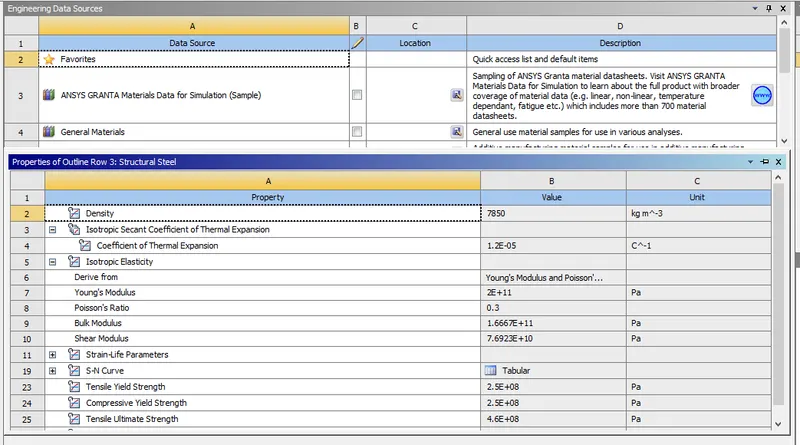
Step 1: Engineering Data
- In this option you can find a list of generally used materials and you can add a material of desired choice/specifications.
- You can also add custom materials and specify the mechanical properties of materials.
Step 2: Geometry
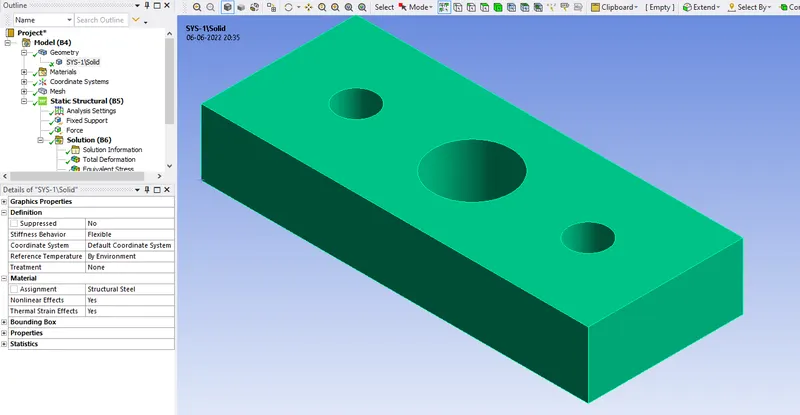
- Select Static Structural Analysis and create the specified 2D geometry using spaceclaim.
- Extrude/Pull the geometry with given dimensions.
- Rename the Static Structural tab as Case 1 and follow the similar process for Case 2
- Update the Static Structural tab and proceed to model.
Step 3: Model
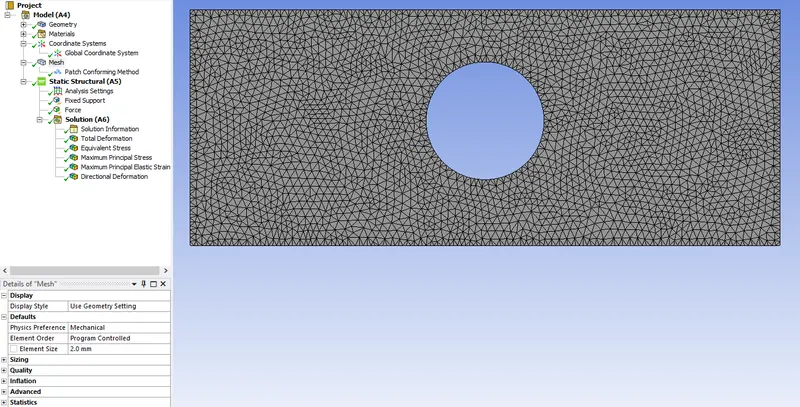
- In this step you can assign the material to geometry and generate mesh with desired accuracy of required solution.
- Within the Mesh option inside the Details of Mesh under default option you can specify Element size and see if the mesh quality is as per required standards.
- You also have an option to change meshing element type/meshing method according to requirements.
Step 4: Setup
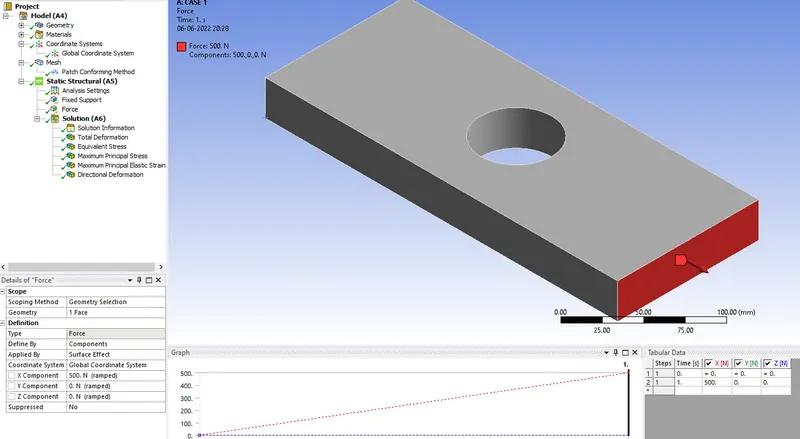
- This step involves setting up boundary conditions and analysis settings
- Provide a fixed Support to the Left side face of plate.
- Prove a Force defined by components in the X-axis with given magnitude.
Step 5: Solution
- Observe results for Equivalent Stress distribution, Total Deformation
Observe for probes which point out Maximum and Minimum values of corresponding data.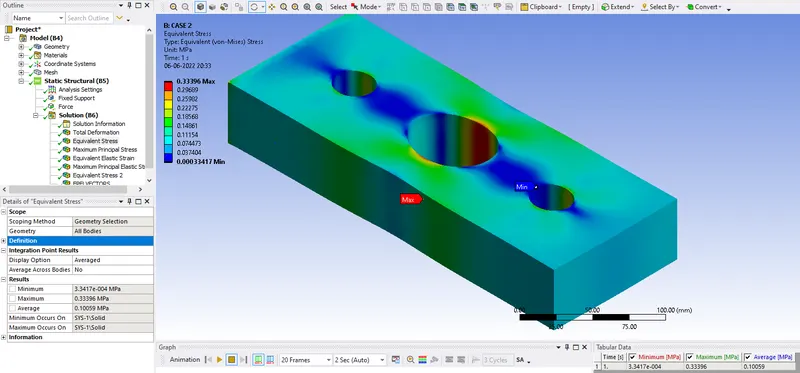
**Note: Geometry procedure is same for both cases but with slight modification from case 1. Remember to add two holes in 2-D geometry before using the extrusion/Pull command.
Deformation and Stress results:
|
CASE # (500 N applied load) |
Maximum stress (Von-Mises in MPa) |
Maximum deformation (Total deformation in μm) |
|
CASE 1 |
633.21 |
0.28955 |
|
CASE 2 |
333.96 |
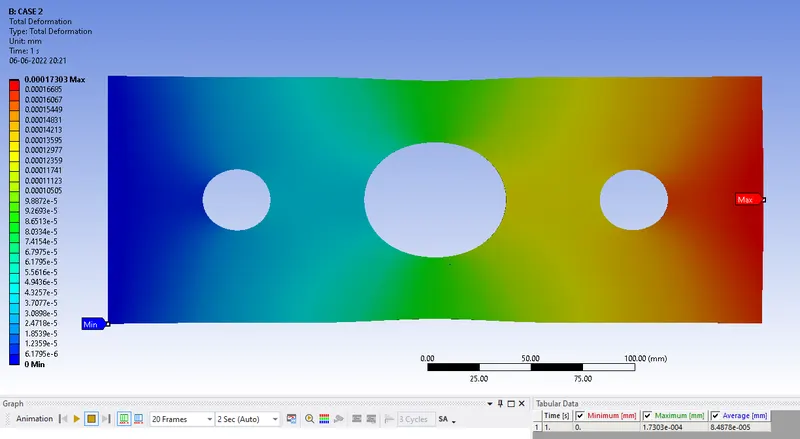
0.17303 |
Images for CASE 1 & CASE 2 simulation results displaying Stress distribution and deformation:
Fig 1 showing areas of Maximum and Minimum stress in case1
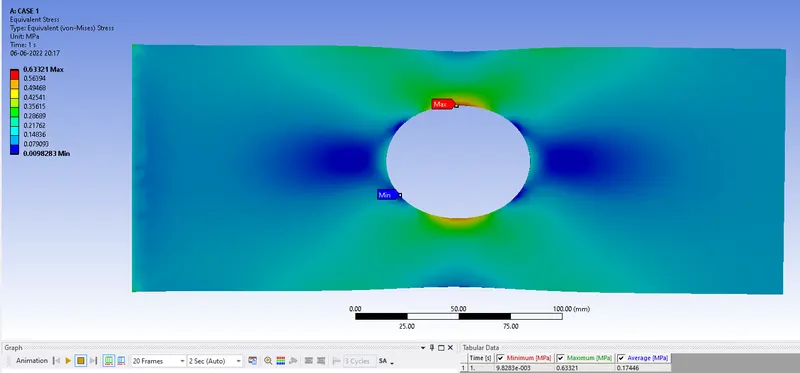
Fig 2 showing areas of Maximum and Minimum deformation in case1
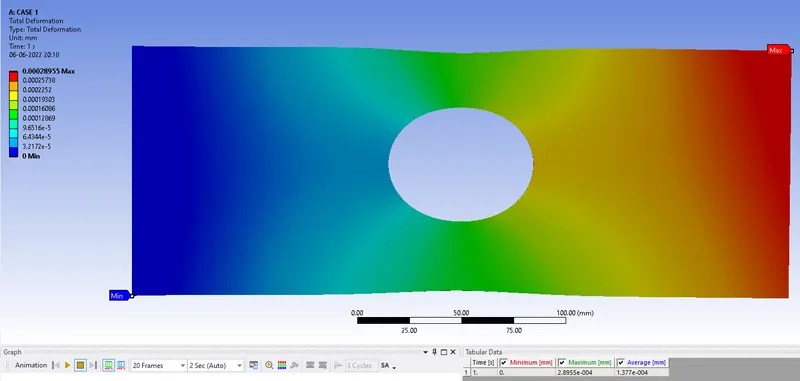
Fig 3 showing areas of Maximum and Minimum stress in case2
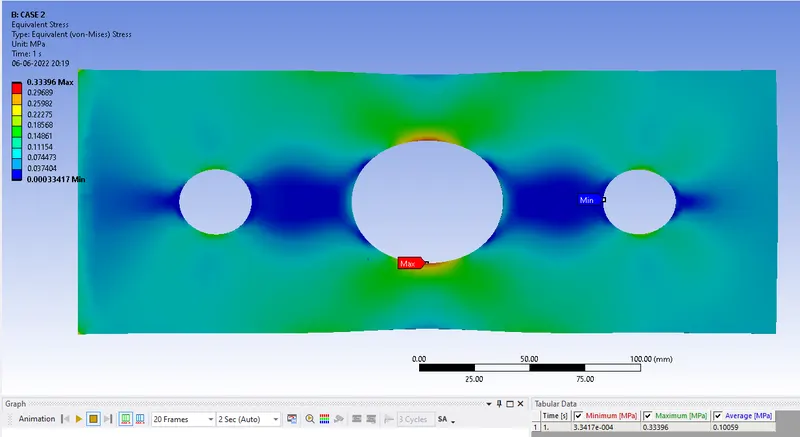
Fig 4 showing areas of Maximum and Minimum deformation in case2
Attached Simulation files display a detailed overview of preprocessing steps.
Results Comparison : In comparison, we see that stresses developed in the second case are 47% less than those in the first case. Also, the deformation produced in the second case is 40% less than that produced in the first case.
Q. From an analysis standpoint, which of the design will you select? Explain why?
A: Analysis shows that
-Design 2 is preferred as it produces less deformation and stresses than design 1 for the same amount of applied load and same material type.
-Also, stress concentration in design 2 is less than that of design 1.
Thus, design 2 is preferred as it performs better.
Q.From a manufacturing standpoint, which of the design will you select? Explain why?
A:From a manufacturing standpoint alone, selection will depend on the method used for manufacturing.
-Additive manufacturing methods like casting will consume less material for manufacturing design 2. So, design 2 will be preferred in this case. But if complexity of design for die casting mold and tooling is considered design 1 is preferred.
-In Subtractive manufacturing methods design 1 is preferred as it is easy to machine and has less cost of operation as compared to design 2.
Thus, design 1 is preferred in this case.