Week 1 Stress Concentration on a Plate with hole
1. Comparision of maximum stress and deformation:
| Plate with a hole (Case 1) | Plate with holes (Case 2) | |
| Maximum stress (MPa) | 0.60673 | 0.58247 |
| Maximum Deformation (mm) | 0.00027 | 0.00030 |
2. From an Analysis standpoint , I will select Design 2 (Plate with holes) for the following reasons:
- The maximum stress in case_2 is smaller than case_1. maximum stress defines the resistance to deformation hence case_2 has more resistance of deformation than case_1.
- Since case_2 contains 2 smaller hole nearer to the larger hole, the stress concentration and stress concentration factor is less for the case.\
3. From an manufacturing standpoint , I will select Design 1 (plate with hole) for the following reasons:
- Manufacturing cost : since case_2 has more amount of holes,manufacturing cost will be more than case_1.
- Tooling cost: For making 3 holes, tooling cost will be more for case_2 as compared to case_1.
- Time period of manufacturing : The tim period for producing a part will increase in case_2 as compared to case_1.
4. REPORT:
AIM:
To compare Maximum stress, deformation and strain of 2 diffrent components under tensile load using Finite Element Analysis.
PROCEDURE:
1. Design
The Design of the components were made using Space Claim module on Ansys Workbench as per the given dimensions:
Part1: Plate with hole
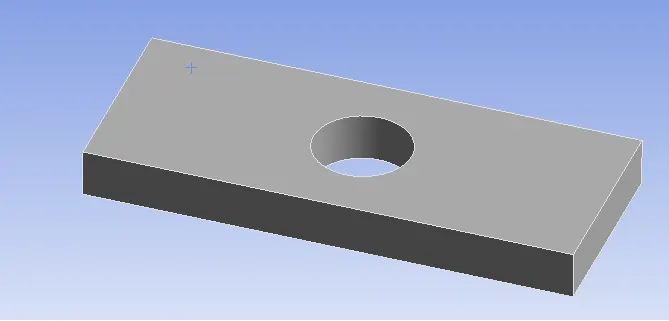
Length=300mm
Height=120mm
Thickness=30mm
Circular Hole at the center: Diameter=60mm
Part 2: Plate with holes:
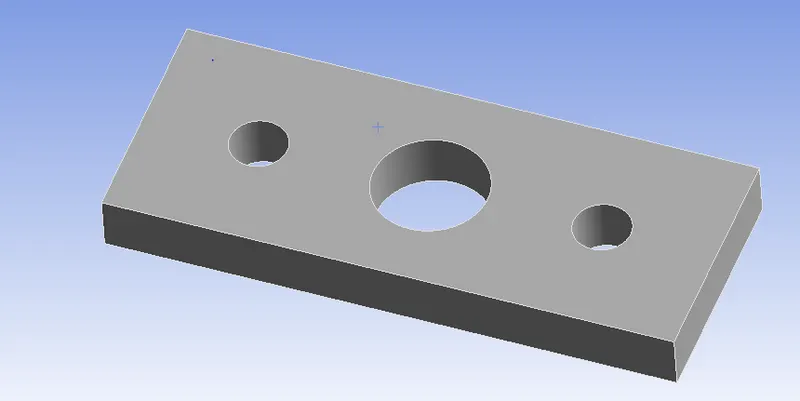
Plate dimensions:
Length=300mm
Height=120mm
Thickness=30mm
Hole dimensions :
Diameter of hole at centre:60 mm
diamter of holes 90 mm left and right of centre : 30 mm
2.Meshing:
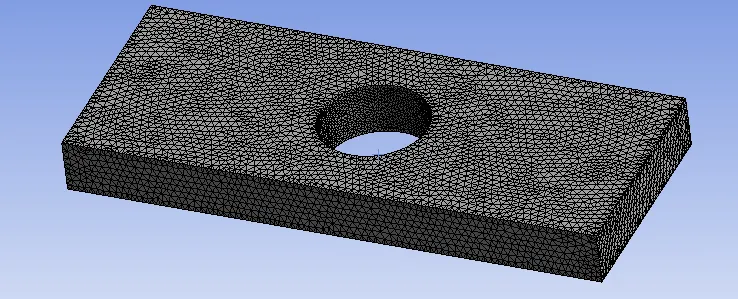
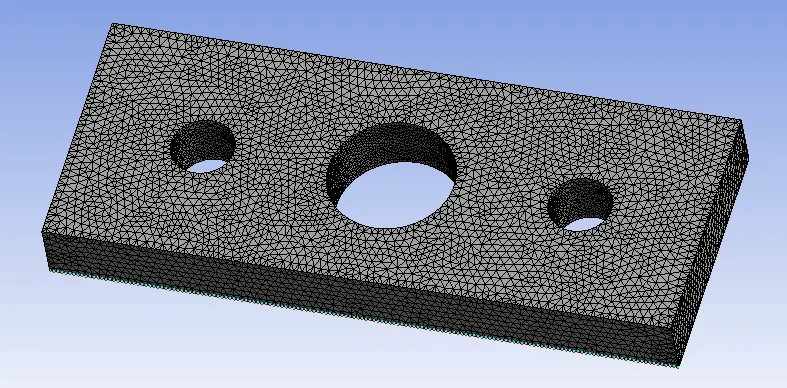
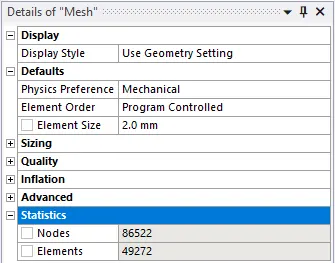
The meshing was done on both the Parts using the following properties:
mesh type: Tetrahedron
Element Size: 2 mm
Meshing on Part 1 :
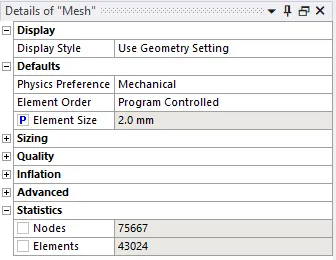
Meshing on Part 2 :
3.Loading Conditions:
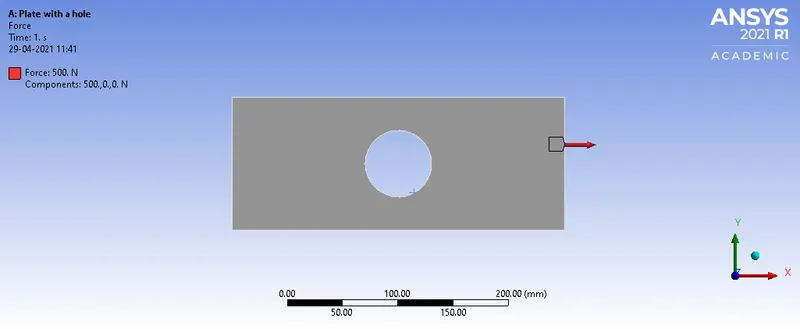
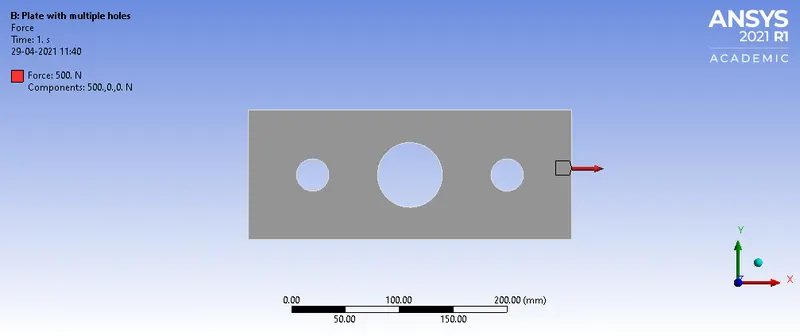
Tensile Load of 500 N were applied on + X axis.
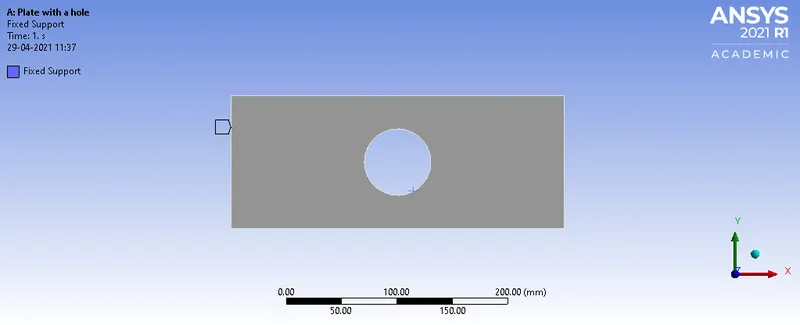
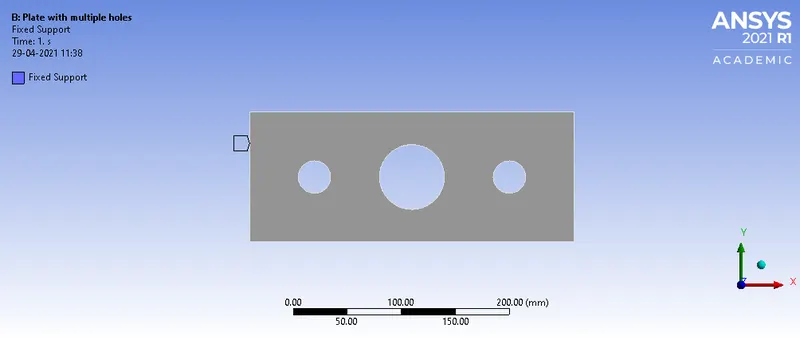
Plate is fixed at left face at negative of X axis as per the figure shown below:
Part 1:
Part 2:
Load was applied on the part as per the figures shown below :
part 1:
Part2:
4.Result :
Following properties were calculated for part 1 and part 2:
1. Maximum Strain
2. Maximum Displacement
3. Strain
Results of the Analysis are tabulated below :
| Part 1 | Part 2 | |
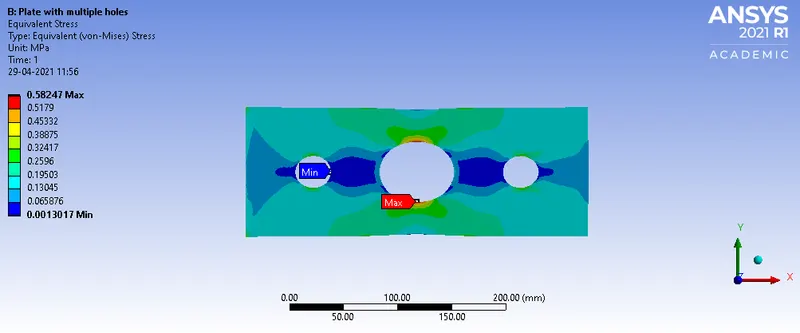
| Maximum Equivalent(Von Mises) Stress | 0.60673 | 0.58247 |
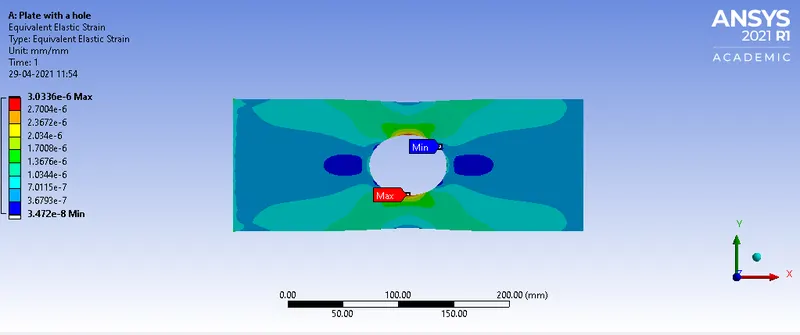
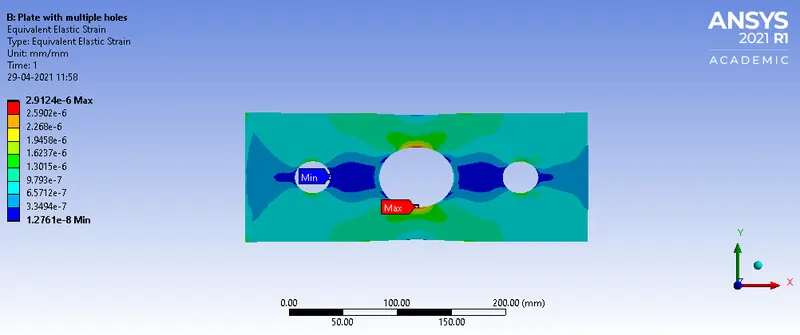
| Maximum Equivalent Elastic Strain | 3.033*`10^-6` | 2.912*`10^-6` |
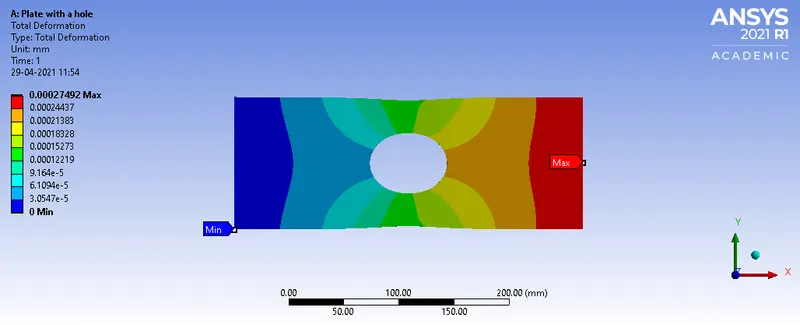
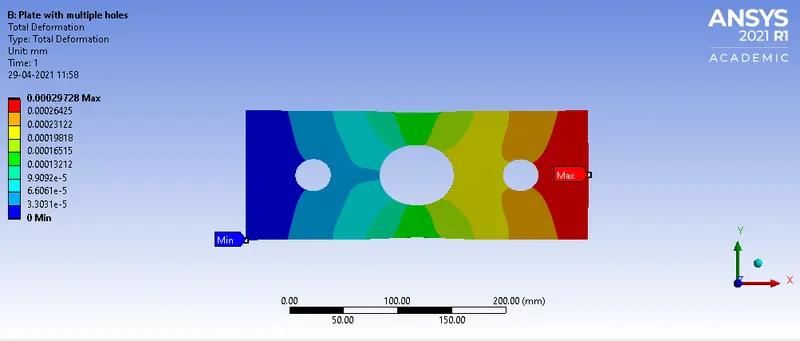
| Maximum Deformation | 0.00027 | 0.00030 |
Material Properties:
| Material | Structural Steel |
| Density | 7.85e-06 kg/mm³ |
| Young's Modulus | 2e+05 MPa |
| Poisson's Rato | 0.3 |
| Yield Strength | 250 MPa |
| Ultimate Strength | 460 MPa |
Factor of Safety for the given parts:
| Maximum Stress (MPa) | Yield Stress(MPa) | Factor of Safety | |
| Part 1 | 0.60673 | 250 | 412 |
| Part 2 | 0.58274 | 250 | 429 |
The figures of the result are attached below:
Part 1:
Equivalent(Von Mises) Stress:
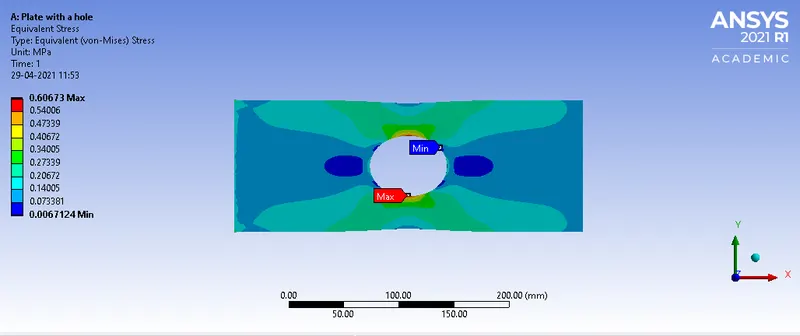 :
:
Equivalent Elastic Strain
Deformation:
PART 2:
Equivalent(Von Mises) Stress:
Equivalent Elastic Strain:
Deformation:
5.Conclusion:
When Part 1 and Part 2 are put under tensile test of 500 N acting along positive X axis, Part 2 depicts better Factor of safety, Maximum Stress and maximum strain in comparison with Part 1.