Week 1- Mixing Tee
1. Introduction
In this study, we aim to analyze the mixing effectiveness of a mixing tee used in industrial applications. The mixing tee's effectiveness is critical for achieving uniform temperature distribution, which is essential for process efficiency and product quality. We investigate the impact of two key factors: the length of the mixing tee (short vs. long) and the momentum ratio (2 and 4) between the hot and cold inlets. Additionally, we evaluate the performance of two turbulence models, k-epsilon and k-omega SST, to determine which provides more accurate and reliable results for this specific application.
2. Simulation Setup
2.1 Geometry and Meshing
The geometry includes two configurations: a short mixing tee and a long mixing tee. Both designs feature a hot inlet at the top and a cold inlet on the side, merging into a single outlet. The meshing strategy involves a structured grid with refinement in areas of expected high gradients, such as the inlet and mixing regions.
2.2 Boundary Conditions
Hot Inlet: Temperature set to 36°C with a velocity of 3 m/s.
Cold Inlet: Temperature set to 19°C. The velocity is adjusted to achieve the desired momentum ratios (2 and 4).
Outlet: Pressure outlet boundary condition with specified backflow temperature to ensure stability.
2.3 Turbulence Models
We initially used both the k-epsilon and k-omega SST turbulence models to assess their suitability. The k-omega SST model was chosen for the final analysis due to its superior handling of adverse pressure gradients and separation phenomena, which are critical in accurately predicting mixing in complex flow situations like a mixing tee.
2.4 Solver Settings
Solver Type: Steady-state, pressure-based solver.
Convergence Criteria: Monitored through residuals, with a target of less than 10^-6 for continuity, momentum, and energy equations.
Discretization Schemes: Second-order upwind for momentum, energy, and turbulence equations.Simulation Cases Selection
2.5 Simulation Cases Selection
Given the task to select and focus on a subset of simulations, we chose the following cases based on their significance in illustrating the impact of tee length and momentum ratio:
Short Tee, Momentum Ratio 2, k-omega SST A
Short Tee, Momentum Ratio 4, k-omega SST G
Long Tee, Momentum Ratio 2, k-omega SST D
Long Tee, Momentum Ratio 4, k-omega SST H
The cases are named AGDH for convenience
k-epsilon (k-ε) is a good general-purpose model, particularly for free-shear flows and where near-wall effects are not dominant.
k-omega SST (k-ω SST) is often preferred for flows with significant near-wall phenomena, such as internal flows with complex boundary layers, flows with separation, or those with adverse pressure gradients.
In this challenge, where accurate prediction of mixing and interaction between hot and cold streams (in a potentially separated or complex flow region) is crucial, the k-omega SST model is indeed more suitable for capturing the nuances of these flows.
The choice of k-omega SST across these cases allows for a consistent comparison and is justified by its robustness in handling the complexities of turbulent mixing flows. This selection covers the variations in tee length and momentum ratio, providing comprehensive insight into their effects on mixing effectiveness.
3. Results and Discussion
3.1 Results
Comparison Table
Case | Cell Count | Average Outlet Temperature | Iterations for Convergence |
Short Tee, Momentum Ratio 2, k-epsilon | 379062 | 303.25°K | 75 |
Short Tee, Momentum Ratio 4, k-omega SST | 379062 | 300.7°K | 70 |
Long Tee, Momentum Ratio 2, k-omega SST | 512710 | 303.25°K | 110 |
Long Tee, Momentum Ratio 4, k-omega SST | 512710 | 300.8°K | 90 |
Obviously, the number of elements in long tee is higher than in short tee. Here we can see depending on short tee, there is no much change number of iterations for convergence; still, k w sst is converging slightly early, And for both long and short tee there is change avg outlet temperature depending on momentum ratio. The momentum ratio 4 gave a lower average outlet temperature. For a long tee when we changed momentum ratio by keeping the turbulence model the one with momentum ratio 4 became more stable around 90 iterations.
To see the effect of model difference, i tried with Short Tee, Momentum Ratio 2, k-omega SST, ie case C. The outlet temperature and iterations were found to be the same as Long Tee, Momentum Ratio 2, k-omega SST (case A), therefore, there is no much effect for k-e and kw sst in average outlet temperature and number of iterations for convergence.
Among all, most mixing is obtained for Long Tee, Momentum Ratio 4, k-omega SST (case H).
Temperature contour plots along the pipe
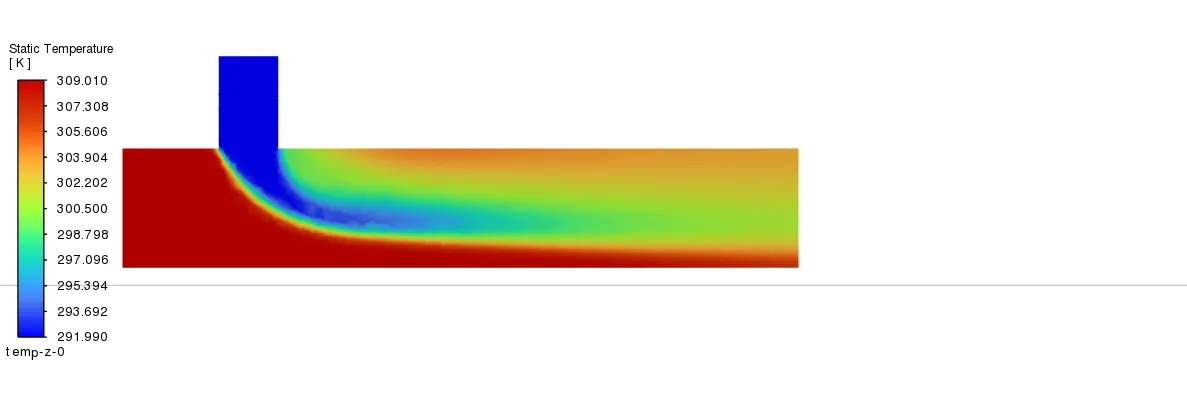
Case A (Short Tee, Momentum Ratio 2, k-omega SST)
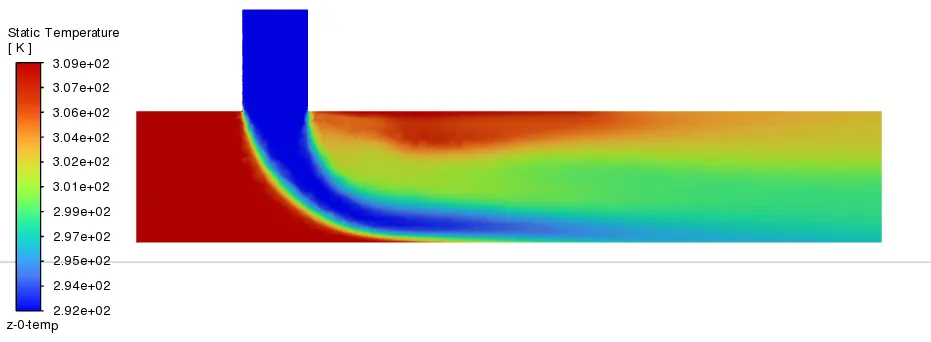
Case G (Short Tee, Momentum Ratio 4, k-omega SST)
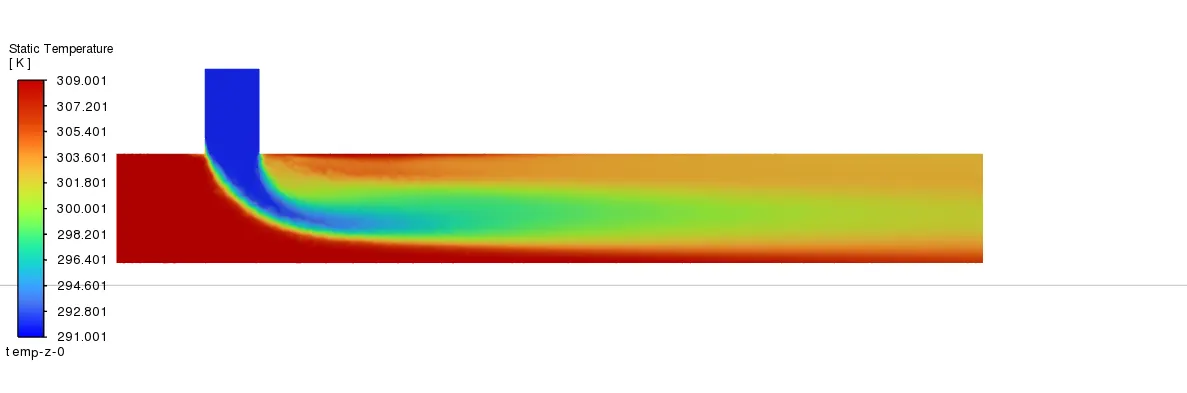
Case D (Long Tee, Momentum Ratio 2, k-omega SST)
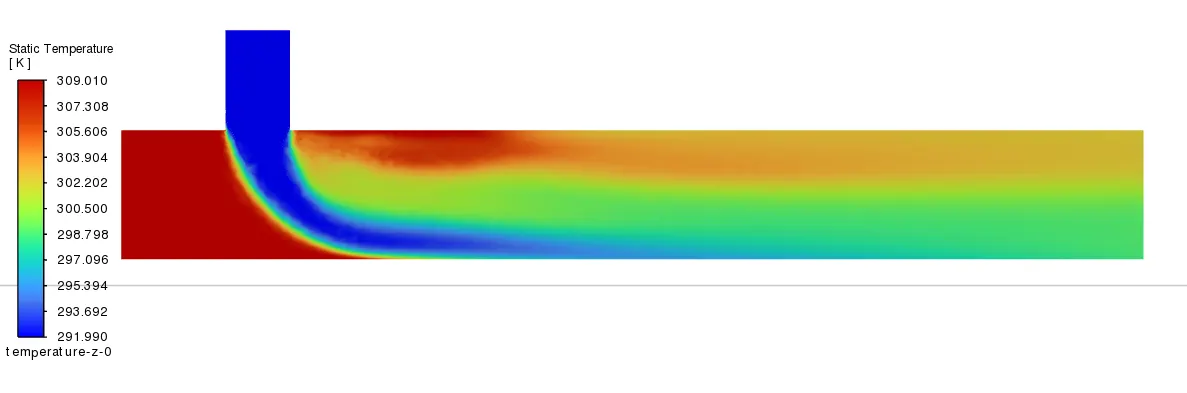
Case H (Long Tee, Momentum Ratio 4, k-omega SST)
Velocity contour plots along the pipe
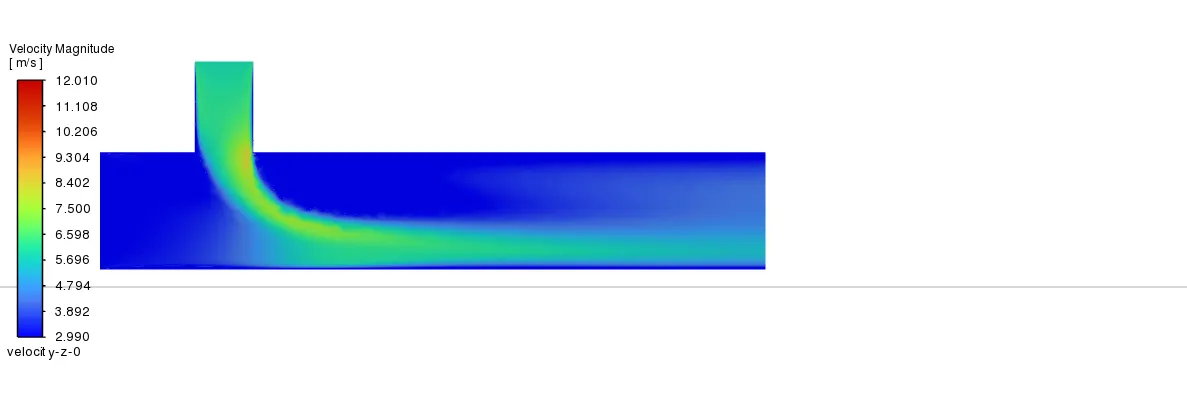
Case A (Short Tee, Momentum Ratio 2, k-omega SST)
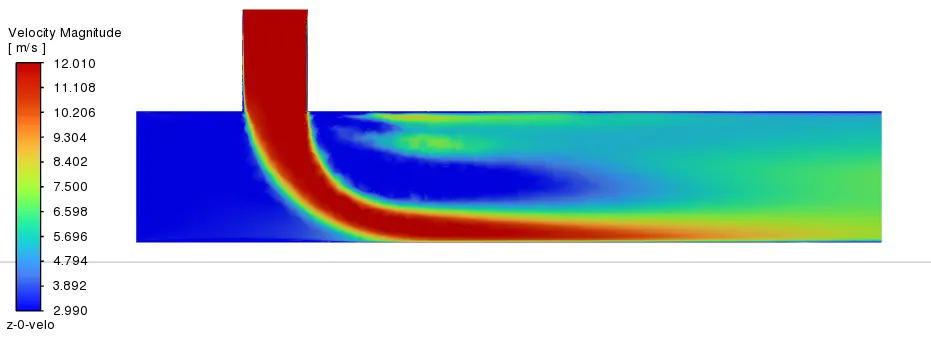
Case G (Short Tee, Momentum Ratio 4, k-omega SST)
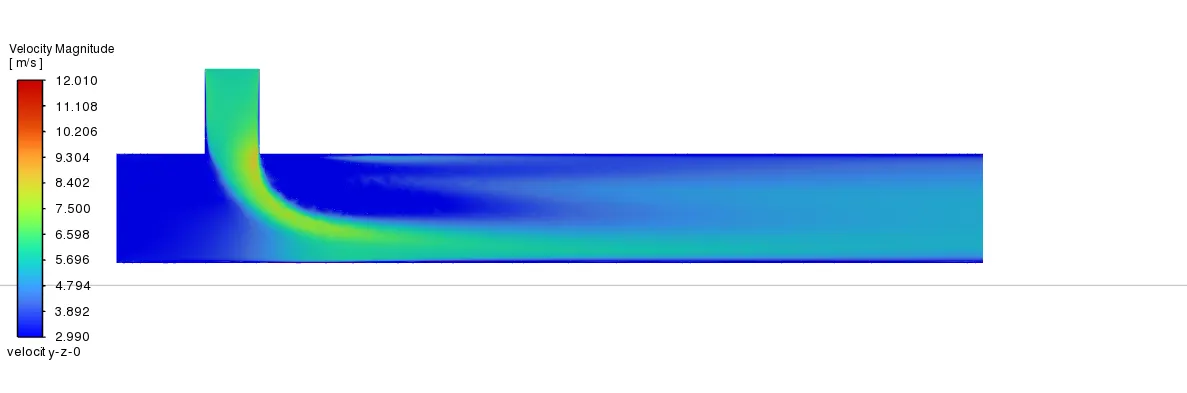
Case D (Long Tee, Momentum Ratio 2, k-omega SST)
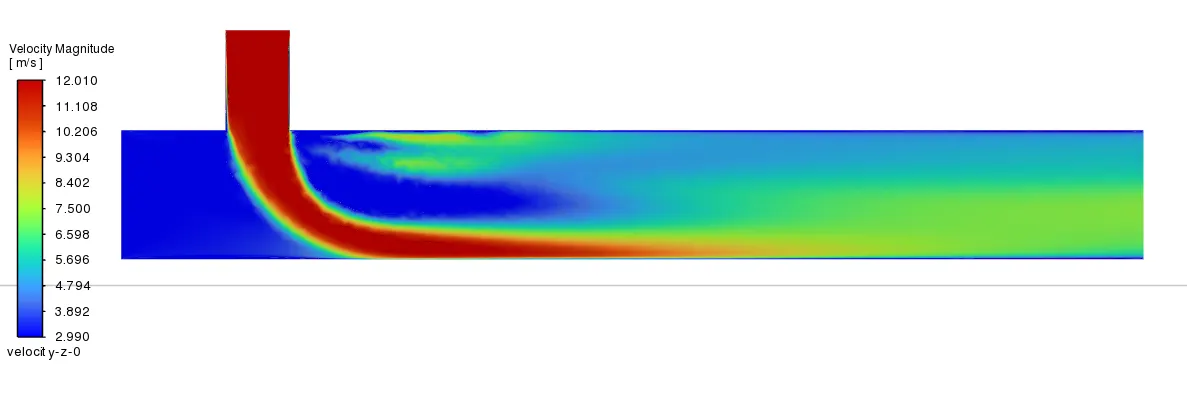
Case H (Long Tee, Momentum Ratio 4, k-omega SST)
Temperature contour plots across the pipe
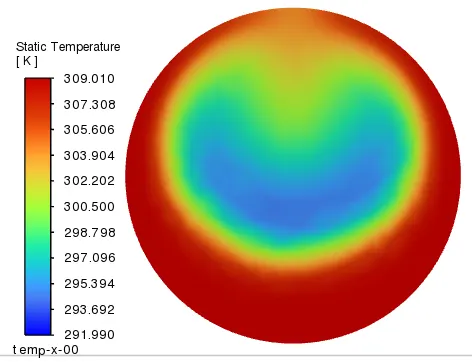
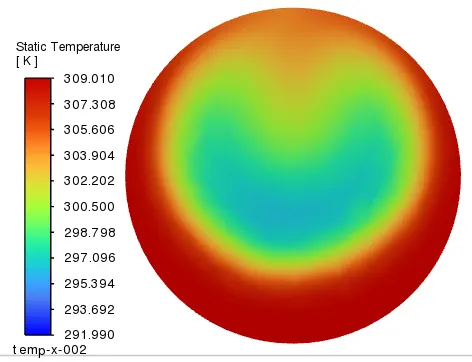
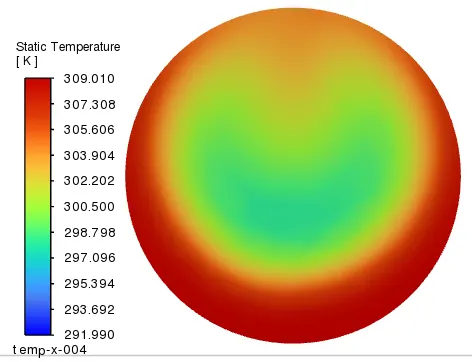
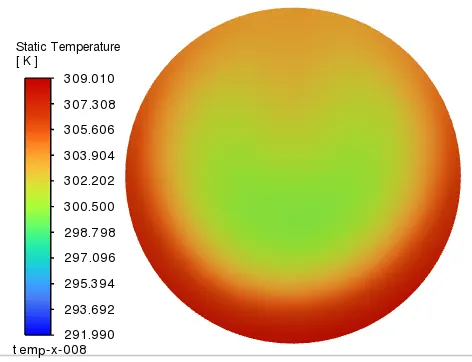
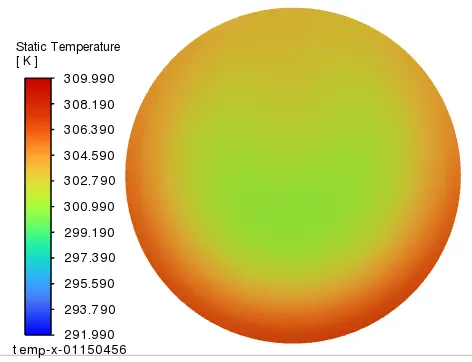
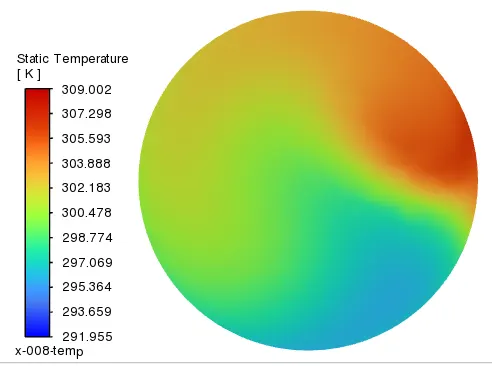
Case A (Short Tee, Momentum Ratio 2, k-omega SST) temperature across positions at x equals to, 0.00, 0.02,0.04,0.08,0.1150456 which is outlet
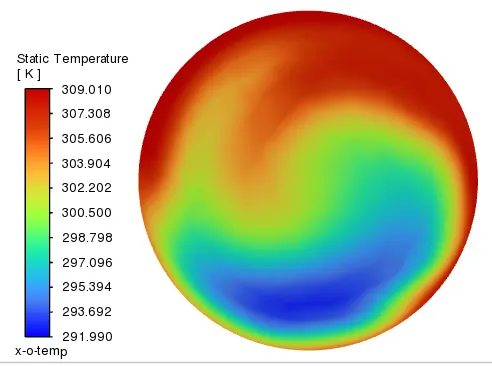
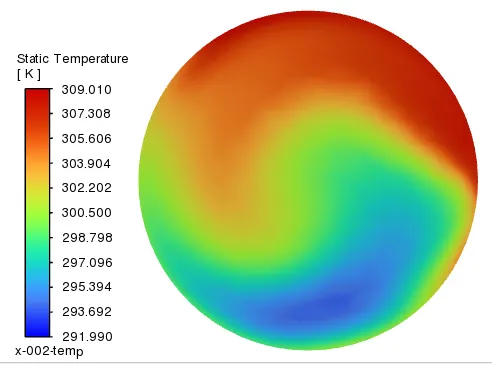
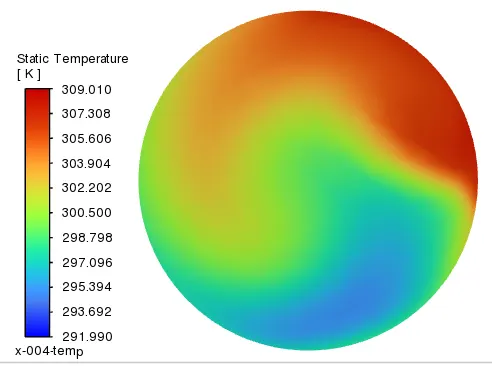
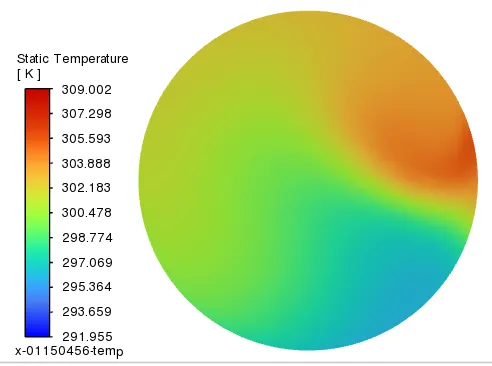
Case G (Short Tee, Momentum Ratio 4, k-omega SST) temperature across positions at x equals to, 0.00, 0.02,0.04,0.08,0.1150456 which is outlet
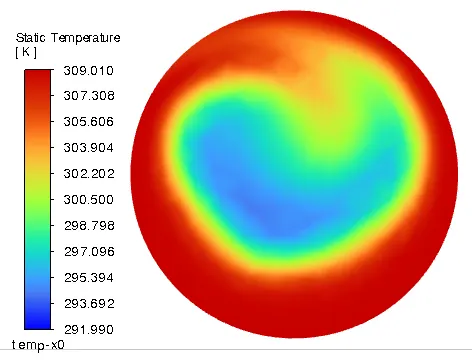
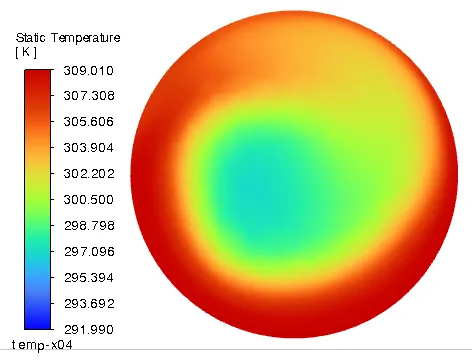
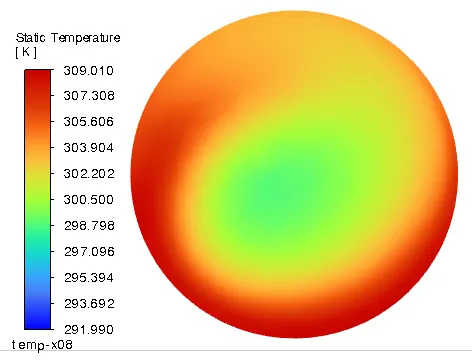
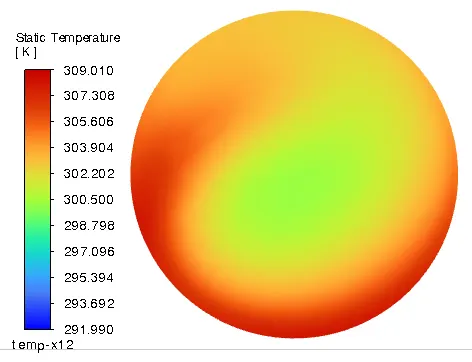
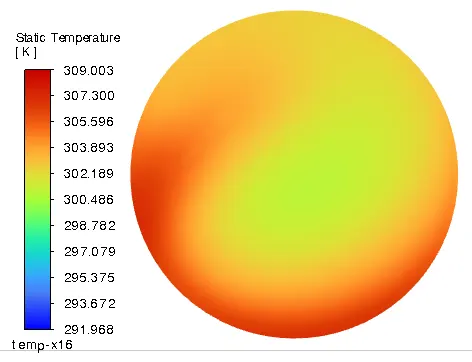
Case D (Long Tee, Momentum Ratio 2, k-omega SST) temperature across positions at x equals to, 0.00, 0.02,0.04,0.08,0.12, 0.16.
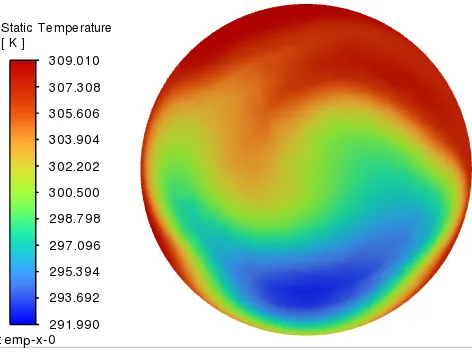
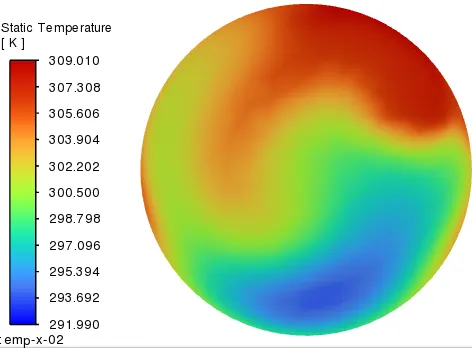
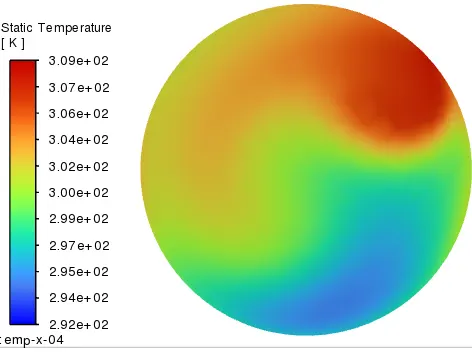
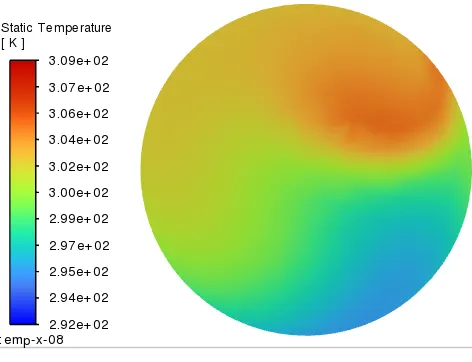
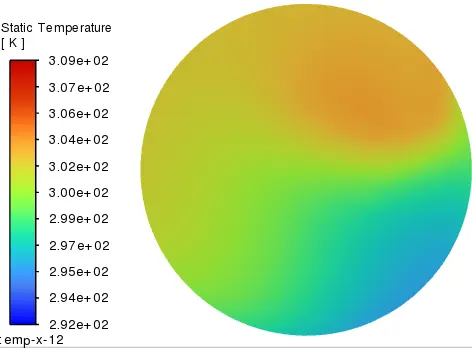
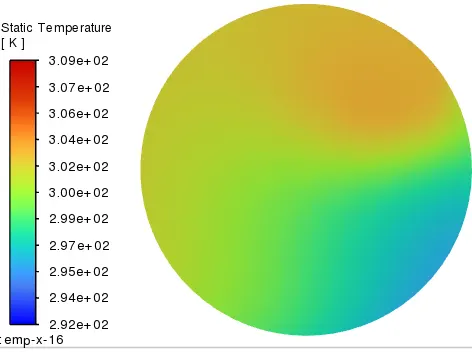
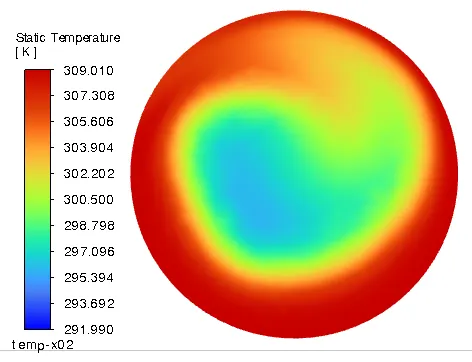
Case H (Long Tee, Momentum Ratio 4, k-omega SST) temperature across positions at x equals to, 0.00, 0.02,0.04,0.08,0.12, 0.16.
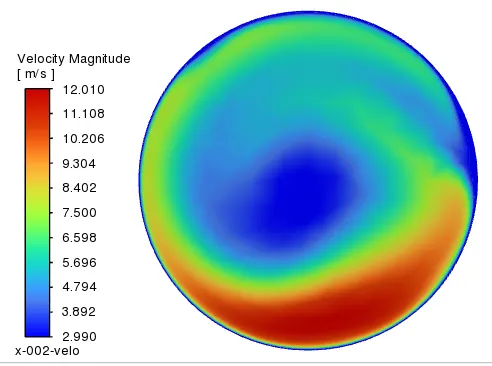
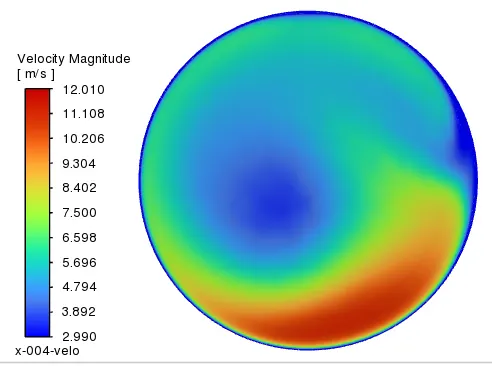
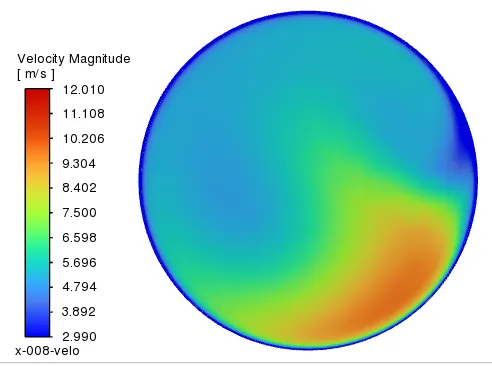
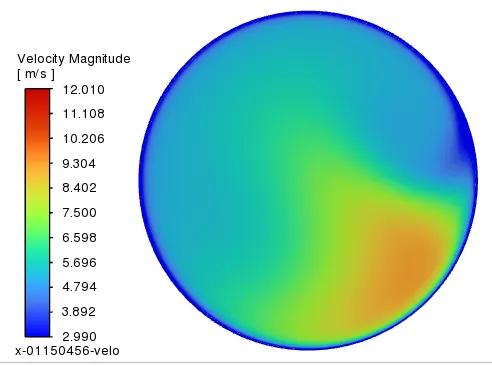
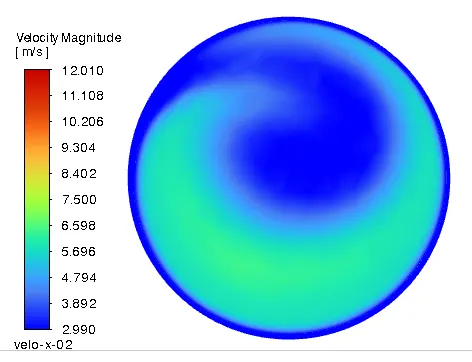
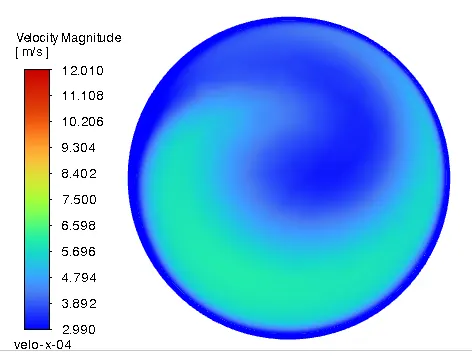
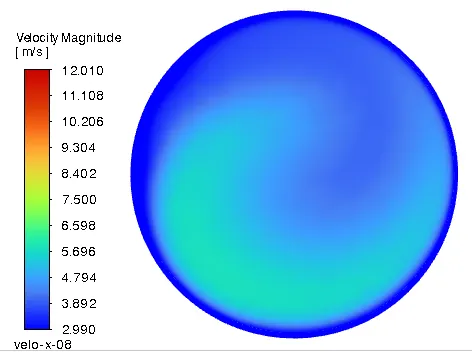
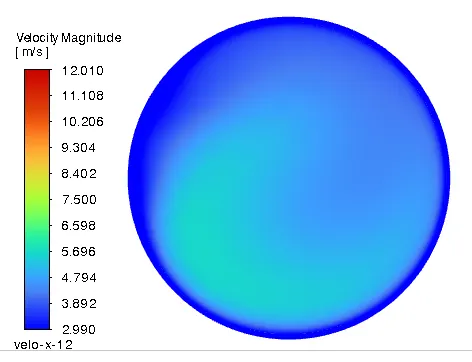
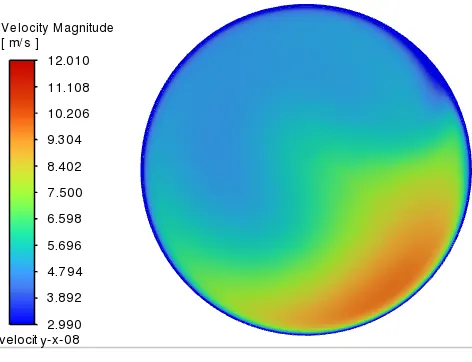
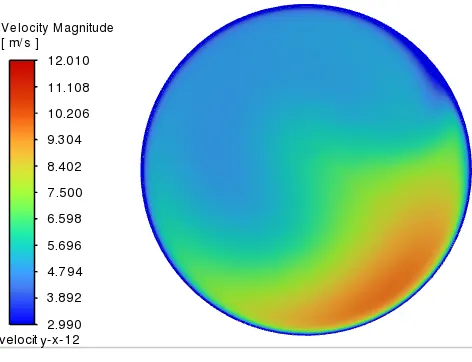
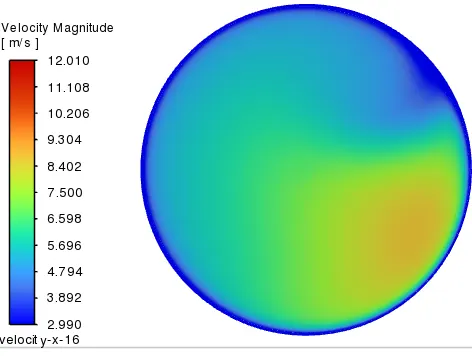
Velocity contour contour plots across the pipe
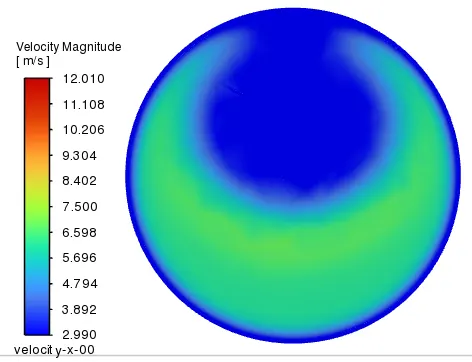
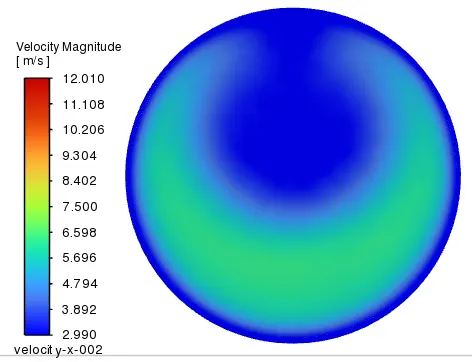
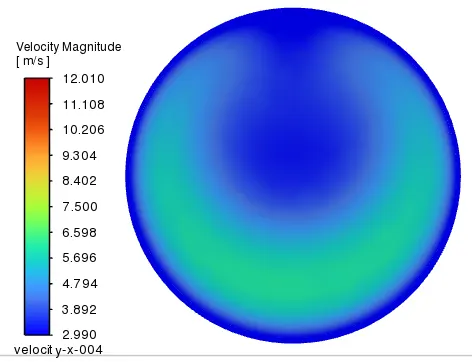
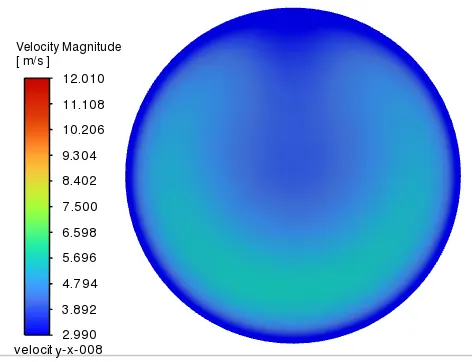
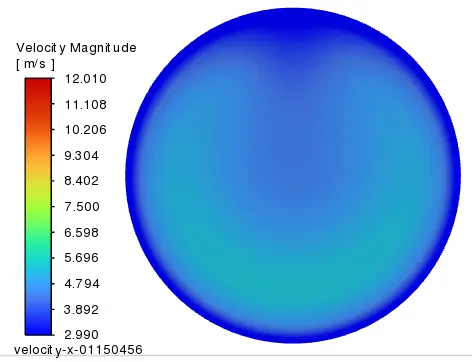
Case A (Short Tee, Momentum Ratio 2, k-omega SST) velocity across positions at x equals to, 0.00, 0.02,0.04,0.08,0.1150456 which is outlet
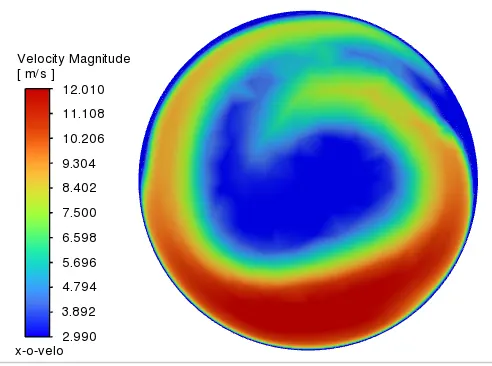
Case G (Short Tee, Momentum Ratio 4, k-omega SST) velocity across positions at x equals to, 0.00, 0.02,0.04,0.08,0.1150456 which is outlet
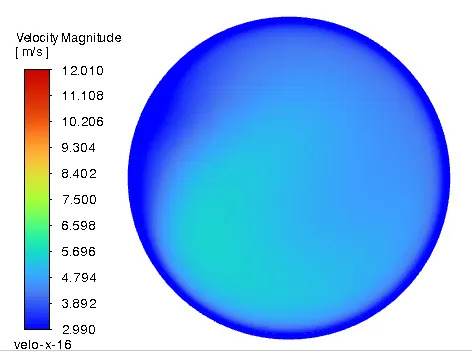
Case D (Long Tee, Momentum Ratio 2, k-omega SST)
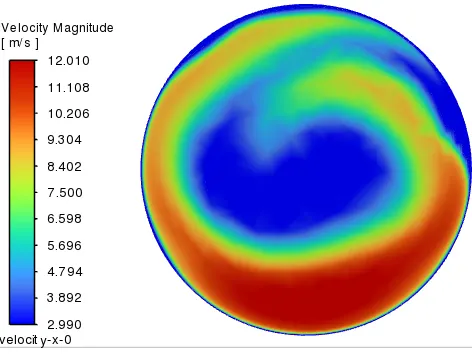
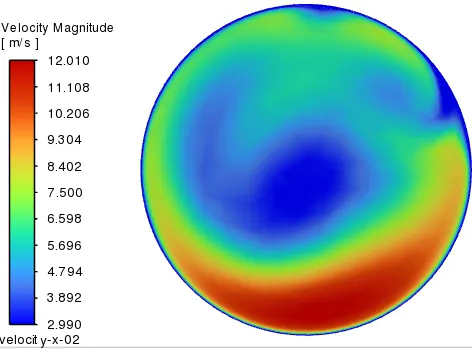
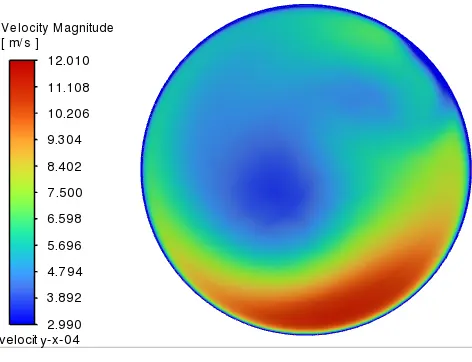
Case H (Long Tee, Momentum Ratio 4, k-omega SST)
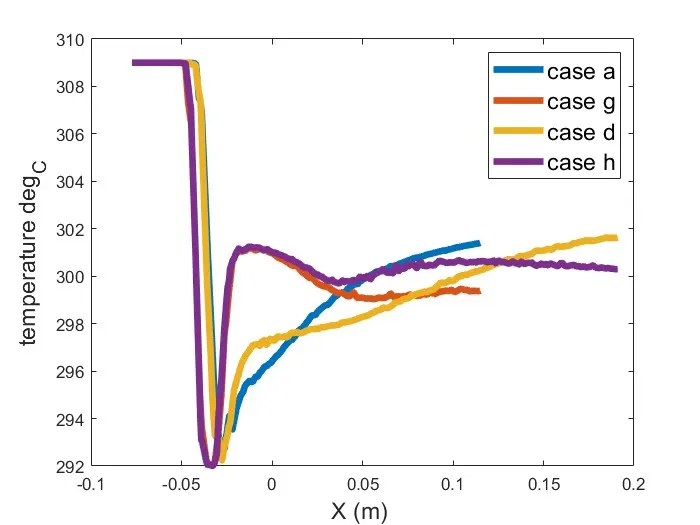
Temperature and Velocity line plots
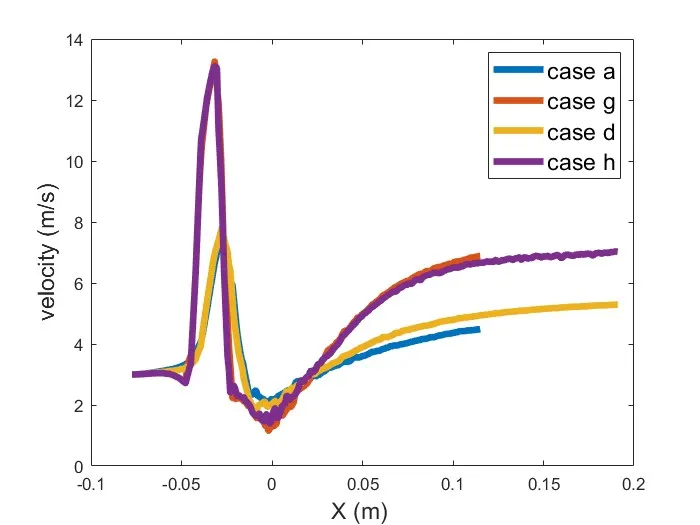
3.2 Analysis of Velocity Along X-Axis
The velocity profile along the x-axis provides critical insights into the flow dynamics for each case. Initially, all cases display a sharp spike in velocity followed by a rapid drop around the mixing region (near X = 0). Among the cases, Case H (Long Tee, Momentum Ratio 4) exhibits the highest peak, indicating the strongest momentum from the cold inlet, which aligns with the expected outcome given its higher momentum ratio. In contrast, the Short Tee configurations, particularly Case A (Momentum Ratio 2), show a lower peak velocity, with Case A having the lowest peak among them.
As the flow progresses downstream (positive X values), the velocity begins to stabilize across all cases. Case H continues to maintain the highest velocity in the recovery region, followed closely by Case G (Short Tee, Momentum Ratio 4). The long tee configurations (Cases D and H) demonstrate a more gradual recovery, suggesting more effective mixing and momentum distribution due to the extended length of the tee.
Overall, increasing the momentum ratio leads to higher peak velocities and a quicker recovery, as observed when comparing Case A with Case G and Case D with Case H. The long tee configurations, particularly Cases D and H, show smoother and more gradual velocity profiles, indicating more efficient energy distribution and mixing due to the increased length.
3,3 Analysis of Temperature Along X-Axis
The temperature profile along the x-axis reveals significant details about the thermal mixing for each case. Initially, all cases show a substantial drop in temperature at the mixing point (near X = 0), where the hot and cold streams converge. Case A (Short Tee, Momentum Ratio 2) experiences the smallest temperature drop, suggesting less effective initial mixing compared to the other cases. On the other hand, Case H (Long Tee, Momentum Ratio 4) exhibits the most pronounced temperature drop, which is consistent with the high momentum of the cold stream overpowering the hot stream initially.
As the flow continues downstream, the temperature begins to recover across all cases. The long tee configurations (Cases D and H) show a more gradual recovery, indicating more effective thermal mixing along the extended length. Case D (Long Tee, Momentum Ratio 2) has the most gradual recovery, while Case H displays a more aggressive recovery due to its stronger momentum ratio.
In general, the long tee configurations (Cases D and H) are more effective at thermal mixing, with temperatures stabilizing further downstream. Conversely, the short tee cases (Cases A and G) demonstrate quicker, but less effective, thermal recovery, which may result in less uniform mixing.
3.4 Comparative Analysis
When comparing the performance of the tee configurations, the long tee configurations (Cases D and H) clearly outperform the short ones in terms of both velocity and temperature distribution. The extended length of the tee allows for more gradual and thorough mixing of the hot and cold streams, resulting in more uniform profiles downstream.
Increasing the momentum ratio, as seen when comparing cases with a ratio of 2 to those with a ratio of 4, results in higher peak velocities and a more significant initial temperature drop. However, it also leads to faster stabilization downstream. This effect is particularly evident in the long tee cases, where the higher momentum ratio enables more efficient use of the available length for mixing, enhancing the overall performance of the system.
4. Meshing and Mesh Independence Study
The mesh independence study aimed to ensure that the simulation results accurately reflected the physical behavior of the system, independent of mesh size. For this study, the k-omega SST model was selected over the k-epsilon model due to its superior ability to capture complex flow behaviors, particularly in areas with strong adverse pressure gradients and near-wall effects, making Case C the more accurate choice. Three different mesh sizes were tested: an element size of 3 × 10⁻³ m with 115,568 elements, an element size of 2 x 10⁻³ m with 219,894 elements, and an element size of 1.5 x 10⁻³ m with 379,062 elements. The area-weighted average temperature and velocity for these mesh sizes were 303.35 0K and 4.51 m/s, 303.25 0K and 4.51 m/s, and 303.256 0K and 4.51 m/s, respectively. The minimal variation in temperature and the consistent velocity values across different mesh sizes demonstrate that the results are independent of mesh density. Consequently, the mesh with an element size of 1.5 × 10⁻³ m was selected, as it provides a reliable and accurate representation of the flow characteristics, confirming the mesh independence of the simulation.
5. Effect of Length and Momentum Ratio
From the temperature and velocity contour plots given in the results section we can observe that, the cases with increased length and momentum ratio show more uniform temperature and velocity distribution at the outlet, which implies better mixing of fluids.
6. Convergence Plot
- Include convergence plots for each simulation to demonstrate solution stability.
Short Tee, Momentum Ratio 2, k-omega SST A
Short Tee, Momentum Ratio 4, k-omega SST G
Long Tee, Momentum Ratio 2, k-omega SST D
Long Tee, Momentum Ratio 4, k-omega SST H
7. Conclusion
In this challenge, the objective was to assess the mixing effectiveness in a mixing tee under varying configurations using steady-state simulations. By comparing short and long tees with different momentum ratios and employing both the k-epsilon and k-omega SST turbulence models, we aimed to identify the most effective setup for uniform mixing. The k-omega SST model was selected over k-epsilon model due to its superior performance in capturing complex flow behaviors, particularly in regions with strong adverse pressure gradients and near-wall effects. The mesh independence study confirmed the reliability of the simulation results, showing minimal variation in temperature and velocity across different mesh sizes.
The analysis demonstrated that long tee configurations, particularly Case H (Long Tee, Momentum Ratio 4, k-omega SST), provided the most effective mixing, resulting in more uniform velocity and temperature profiles downstream. The higher momentum ratio in Case H contributed to stronger initial mixing and faster stabilization, making it the optimal configuration for enhanced mixing efficiency. Overall, the findings indicate that for achieving better mixing performance, a long tee with a higher momentum ratio, when paired with the k-omega SST turbulence model, is the preferred setup.