Week 1- Mixing Tee
AIM:
To preform an analysis for mixing tee short and long by using steady state simulations in ANSYS FLUENT to find the effectiveness of the two models.
INTRODUCTION & THEORY:
* In a T-shaped mixers the two liquid streams in the inlet channels meet each other at the T-junction, and their liquid-liquid contacting face exhibits planar, swirling folds and the folds breaking to be chaos and turbulence, as the reynolds number increases.
* The characteristic mixing scenario attracts long-time attention, given these mixings are of fundamental importance in fluid physics and also have been successfully used in engineering applications.
* Here we are mixing two fluids in different temperature to get a output suitable for the air conditioning of the warm room.
*For that we are using T-shaped mixtures of two different length and using ANSYS WB we can simulate the results and plot charts are created with that we can discuss the performance and output given by the two models.
PRODECURE:
*Start ANSYS WB > in systems open fluid flow fluent platform. In that open the geomentry of T joint small in space claim.
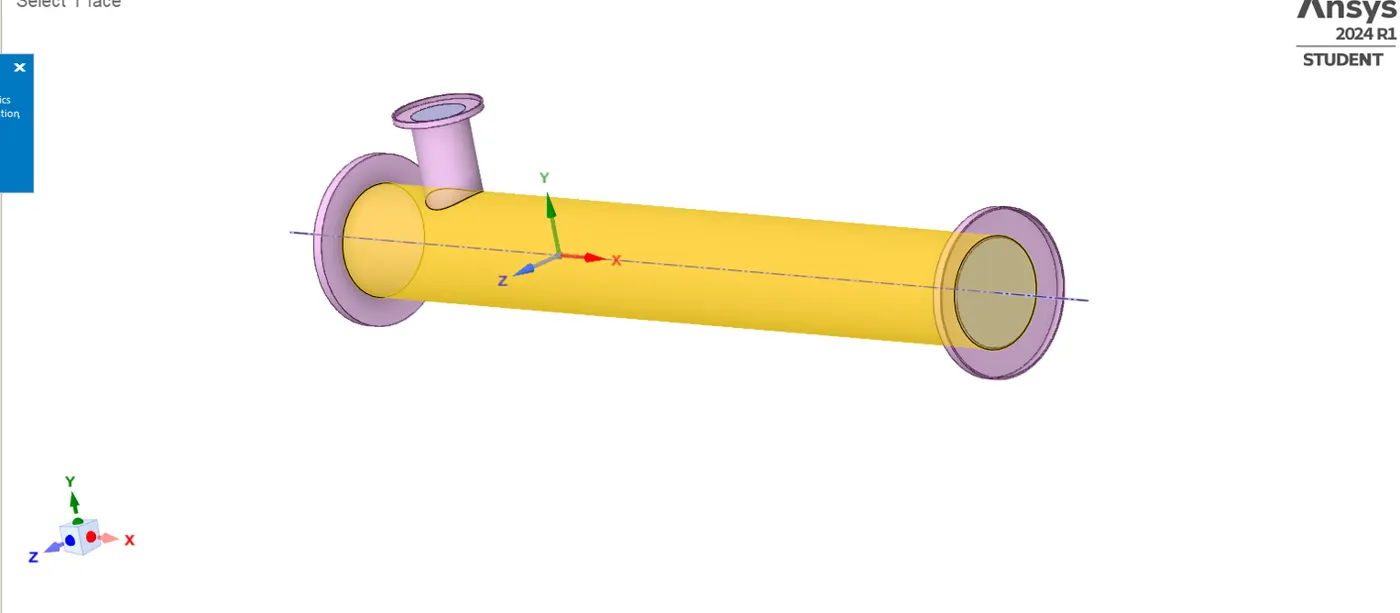
* A solid 3 D model of T joint opened in the space claim GUI. We need only the fluid impact surface only for the further process so we are here to supress the model for only fluid volume.
* For that go to the menu bar >prepare >volume extract> in here we need only volume which the fluid impacts for the select edge select > select the edges for volume inlet and outlet .
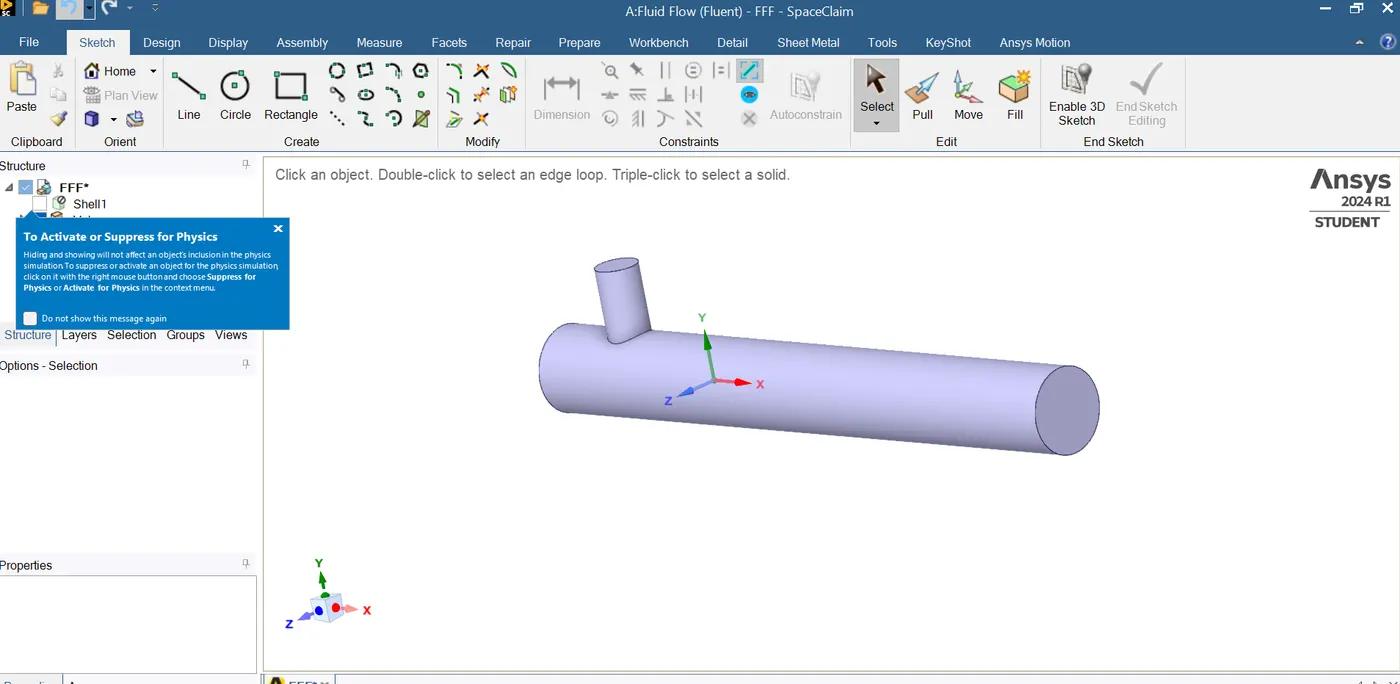
* we can a new volume is created below shell to hide the shell volume right click the shell >select supress for physics> unselect the shell volume. now we have only one volume thats all we need for the mesh.
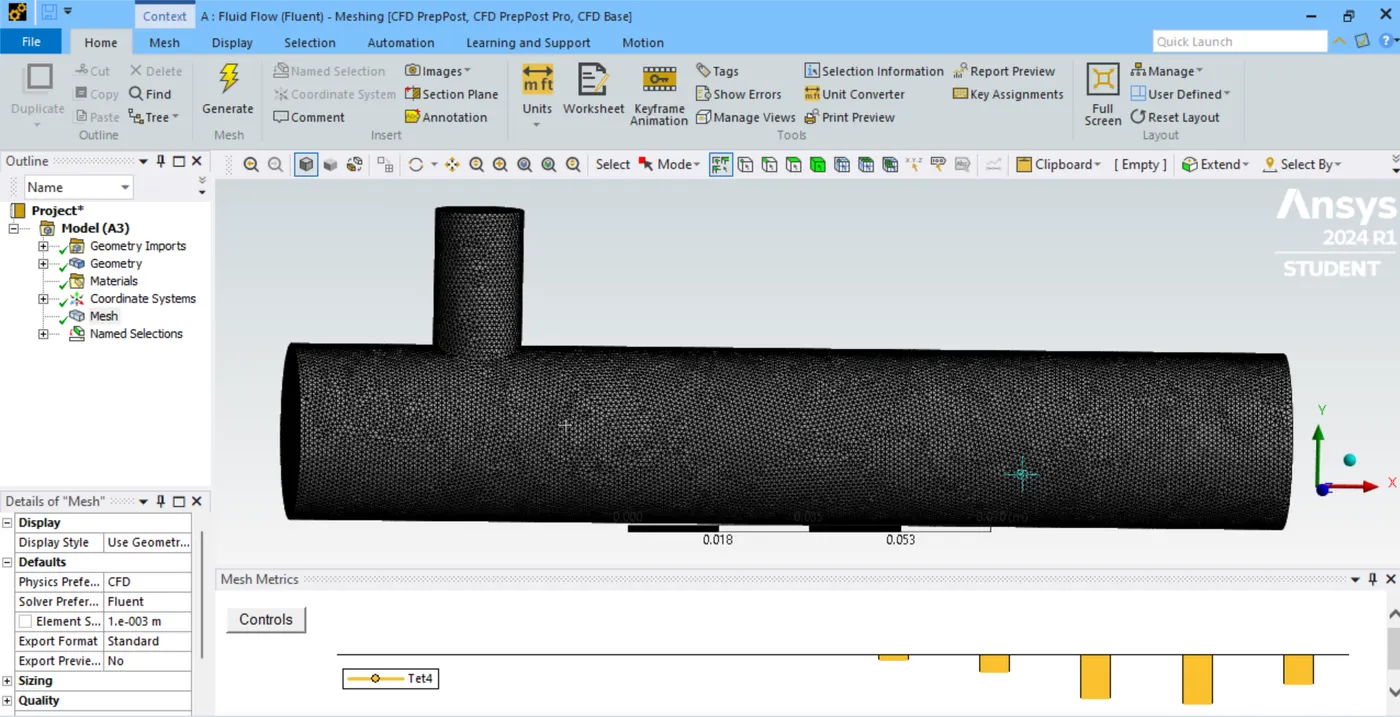
 *selet the mesh and all the criterias for making the mesh has been automatically set and the mesh has been automatically and can be changed if there is a necesscity.
* section has been formed by given by which and where we need to observe any transitions that is temperature in here.
* Which can be achieved by surface selection in the menu bar select surface icon>select surface need to be selected.we create inlet along with x axis and - y axis and oulet along x axis , remaining are seleted as walls.
*Now we will go to the setup update the detials and do a double click to open the file . A dialog box will shown there we will set how many processor are undergone for the analysis.
* Now in the domain interface we need to perform a mesh check to find the whether the mesh we have created is without errors or not . here we have an graphical interface and a console.
*In the console we can seen is there any process is going on or not on the graphical interface we see the model.
*After checking the mesh set up the physics for our model.
*select energy equation>select viscous model because we are working with a fluid medium> select k Epsilon model >relaisable >standard wall functions.
*setting the boundry conditions for all the inlets and oulets.
*Go to the zones>boundries>in that set the initial velocity & temperature of inlets are added.
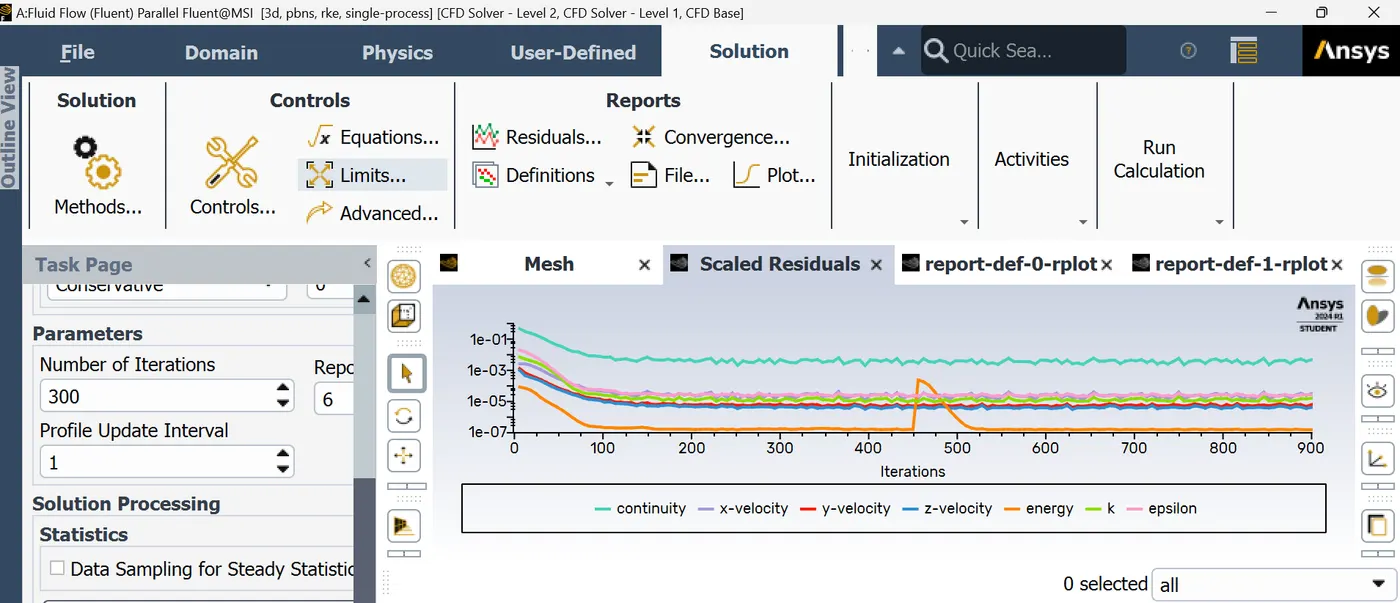
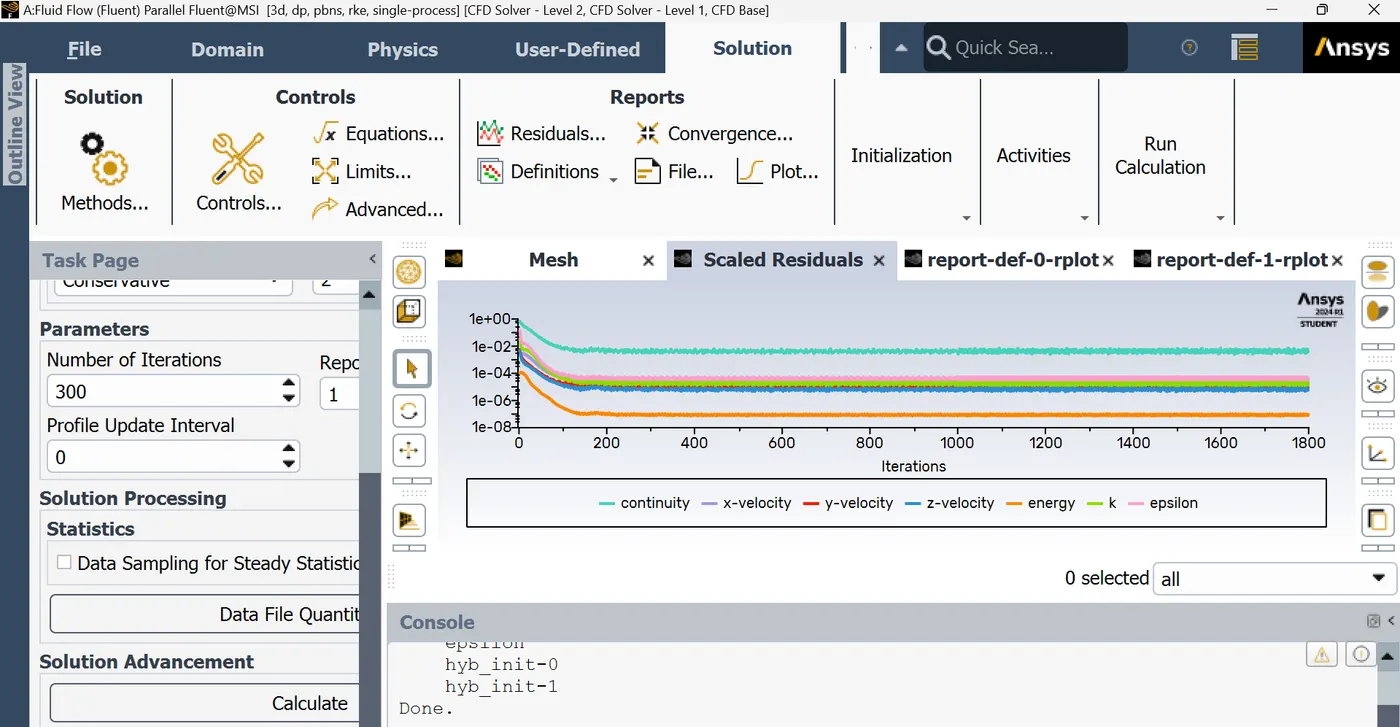
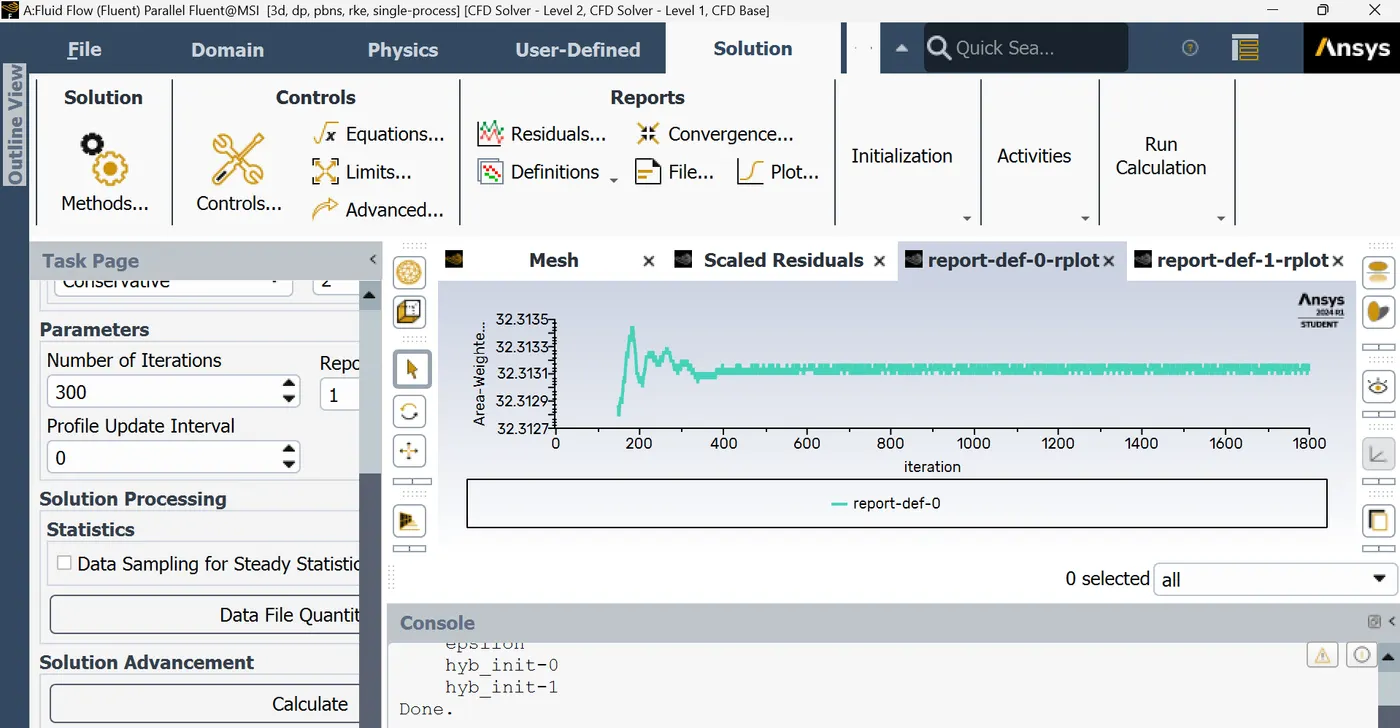
*Next we need to pass to the solution in that case we need define which type of solution we need are specified in definition>new>surface report>area weighted AVG. another one as new>surface report>standard deviation.
* In both the cases we need outlet temperature so select field variable as temperature at outlet surface.
* Now run it upto 300 iteration and see the plots are having values somewhere near 1.
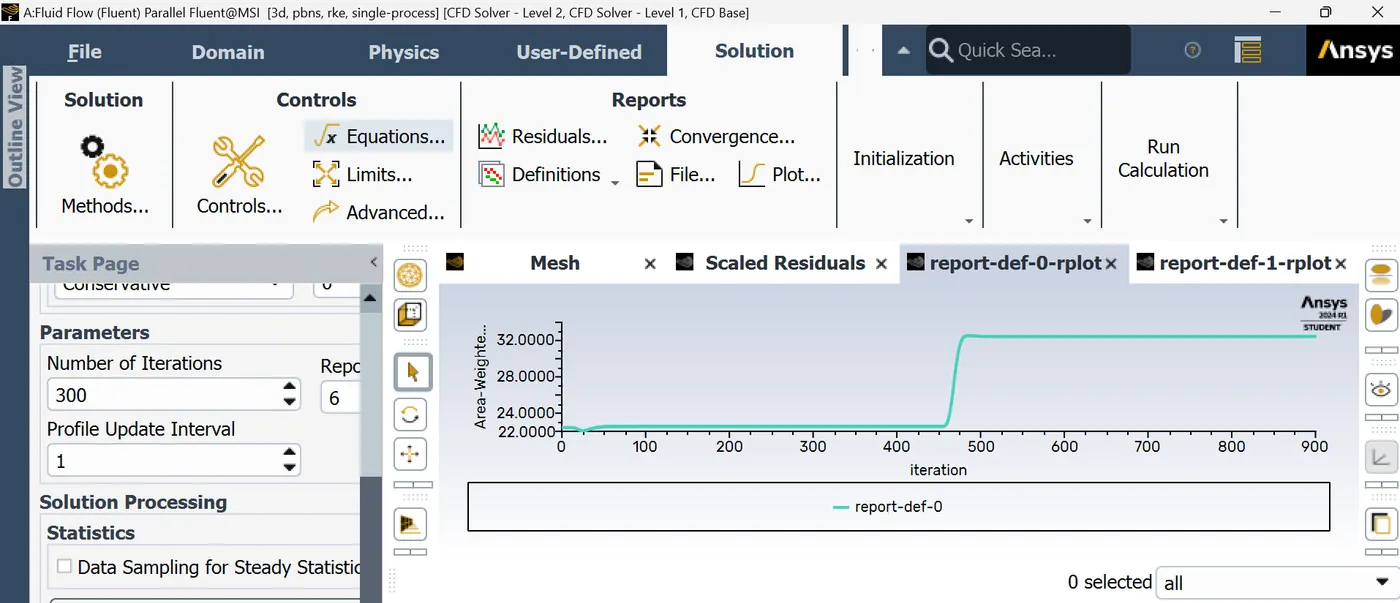
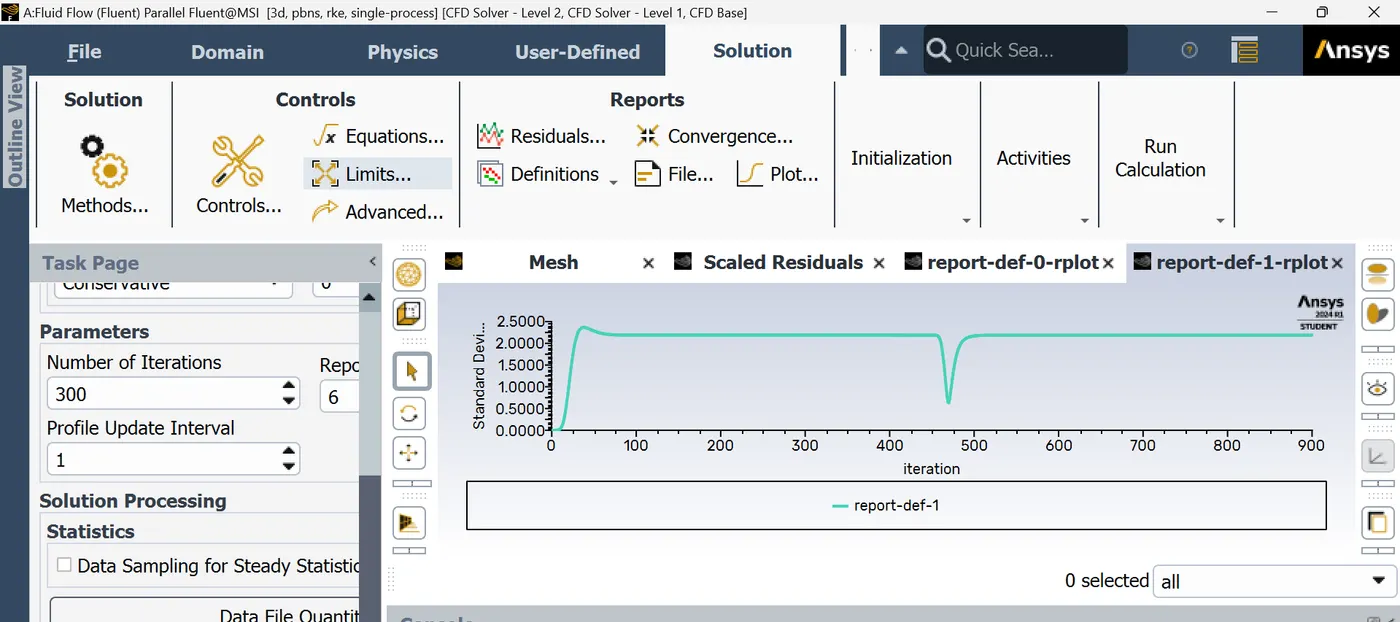
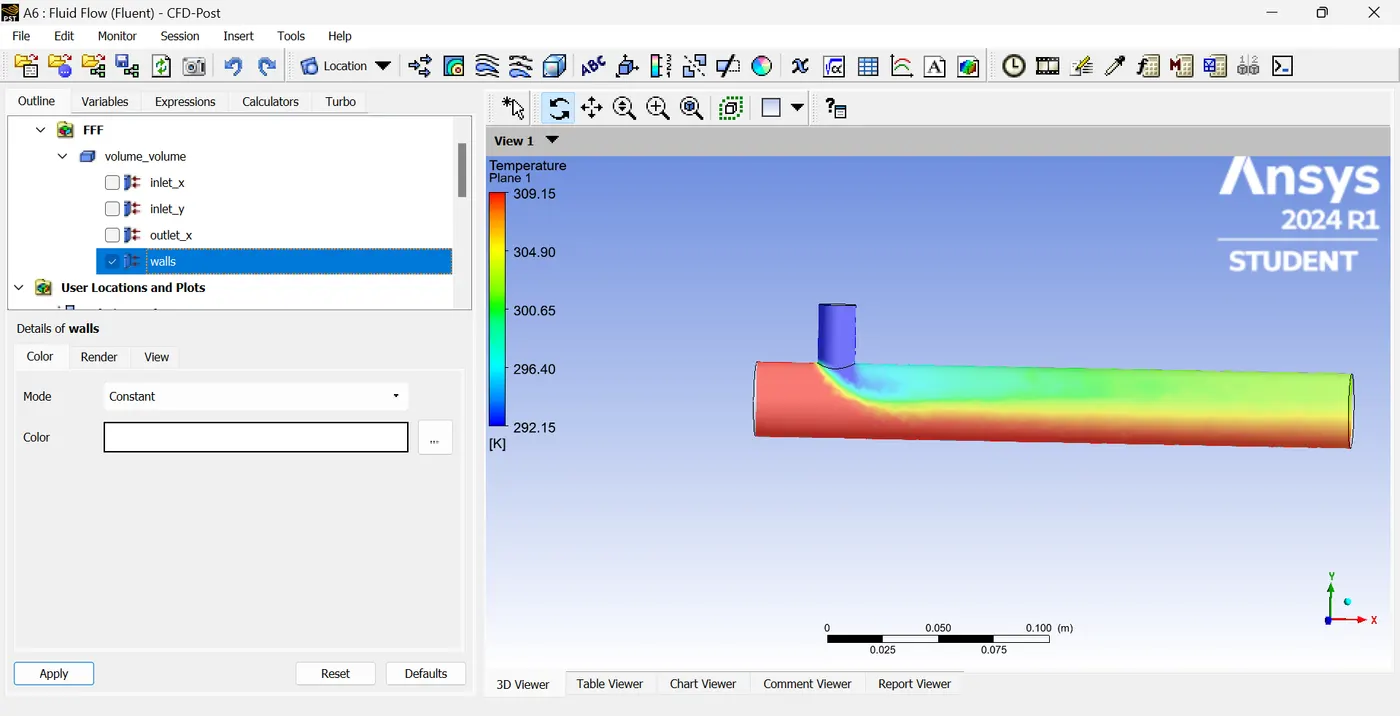
*open the results now we can un select all the inlet and outlet only walls we need for this
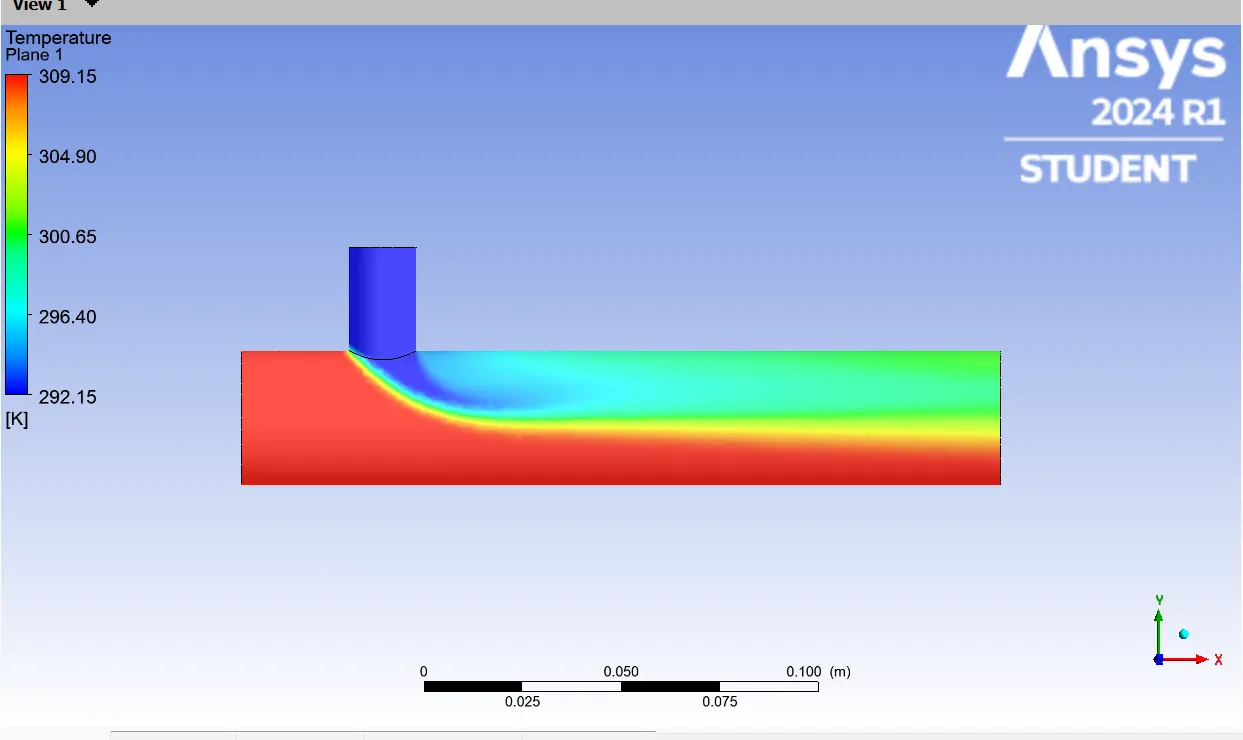
*increase the transprancy for betterview and we can insert a plane by insert>location>plane.
*Double click the plane and change the varible from constant to temperature and load the initial inlet temperatures and click apply now we can see the temperature plot chart of mixing cold and hot fluid can be done
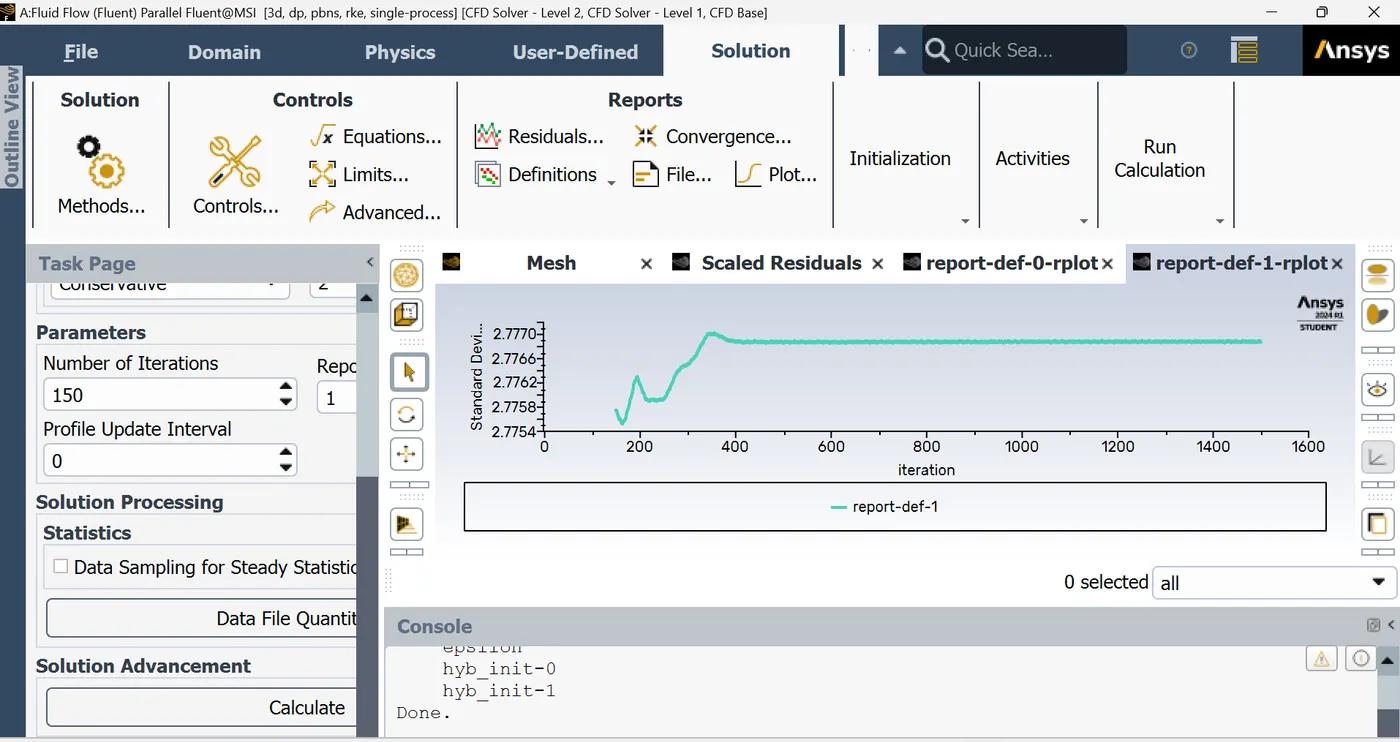
* above the same as follows for the second model.
CONCLUSION:
By seeing the graph and the simulation charts the temperature output given by the small T joint is much more effecient than the long T joint.