Week 1- Mixing Tee
Aim: To perform steady state simulations to compare the effectiveness of mixing when there are hot inlet and cold inlet.
Objectives:
- Velocity and temperature contour plots on the cut planes along and across the pipe.
- Velocity and temperature line plots along and across the length of the pipe.
- Perform Mesh independent study for any one case.
- Discuss the effect of length and momentum ratio on results.
Given: Here two versions of mixing tee are used in the analysis one shorter in length and another longer in length.
- Hot inlet temperature = 360C
- Cold inlet temperature = 190C
Case 1:
- Short mixing tee with a hot inlet velocity of 3m/s
- Momentum ratio of 2, 4.
Case2:
- Long mixing tee with a hot inlet velocity of 3m/s
- Momentum ratio of 2,4.
Momentum ratio = velocity at hot inlet/ velocity at cold inlet
Procedure:
Geometry preparation:
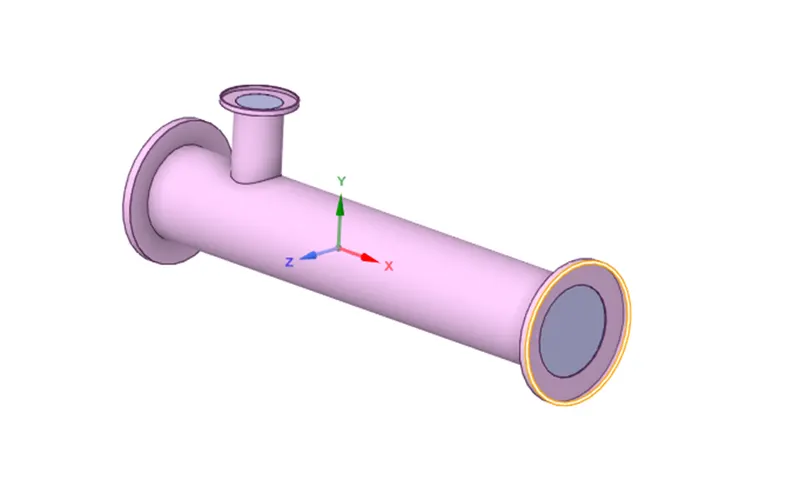
Open ansys workbench-select fluid flow (fluent)tool- open geometry model in space claim window
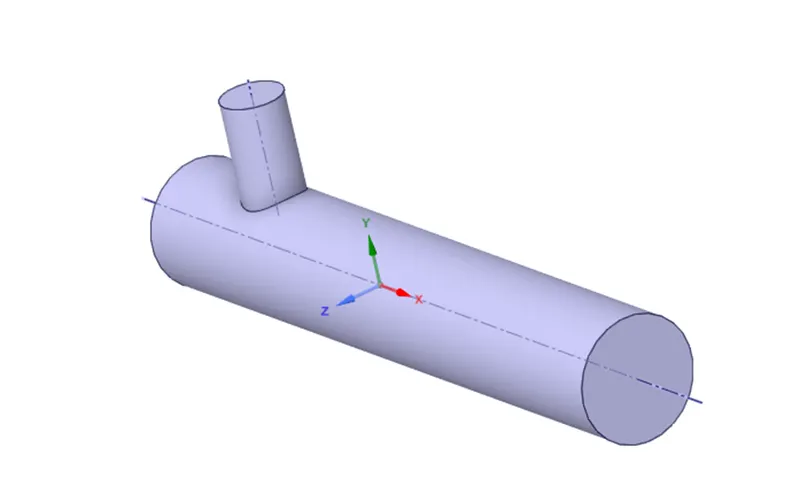
Open prepare- select volume by selecting edges-hide shell and click on suppress for physics and volume extraction done
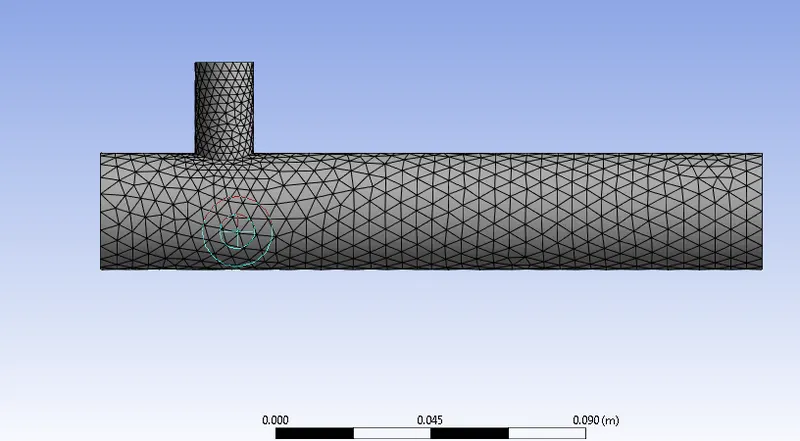
Mesh:
Case1: Short tee, Momentum ratio 2:
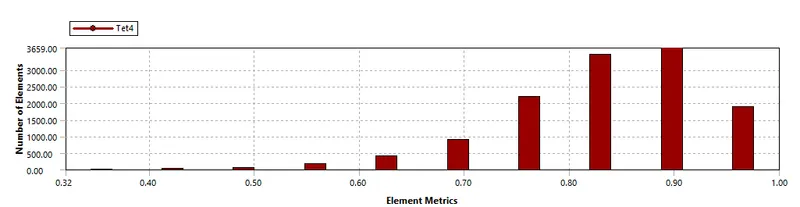
Quality of mesh
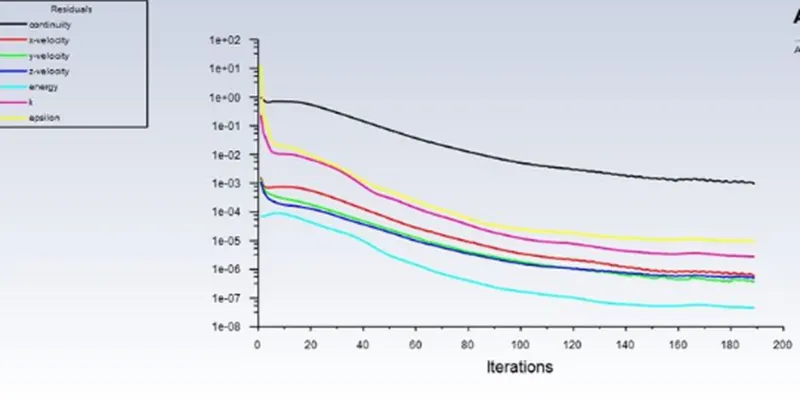
Residuals
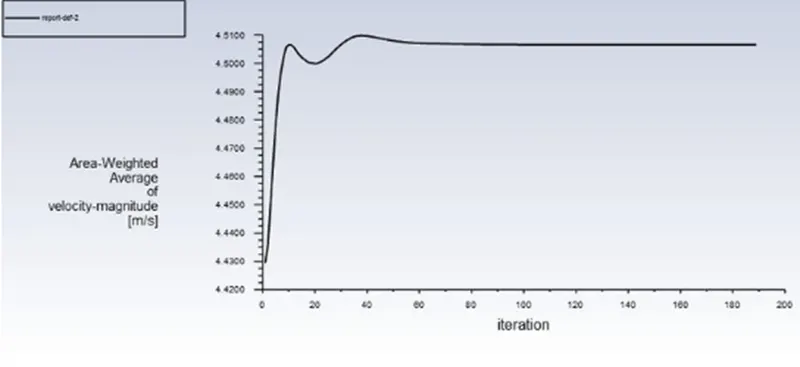
Average outlet velocity plot
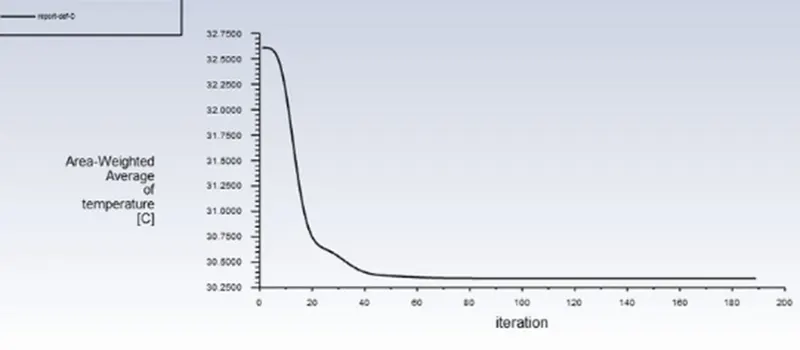
Outlet Temperature plot
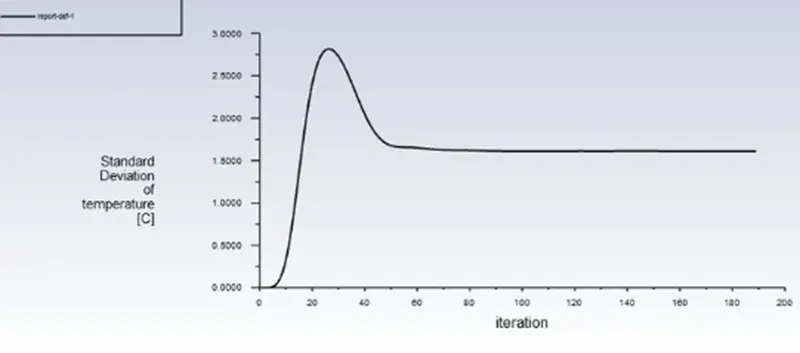
Standard deviation Temperature
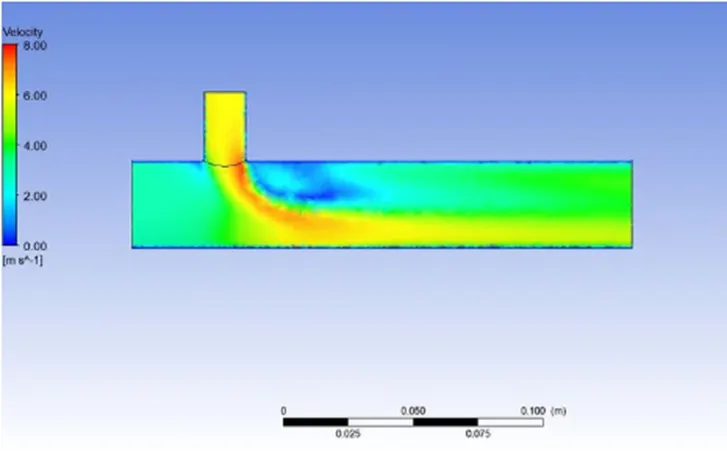
Velocity simulation
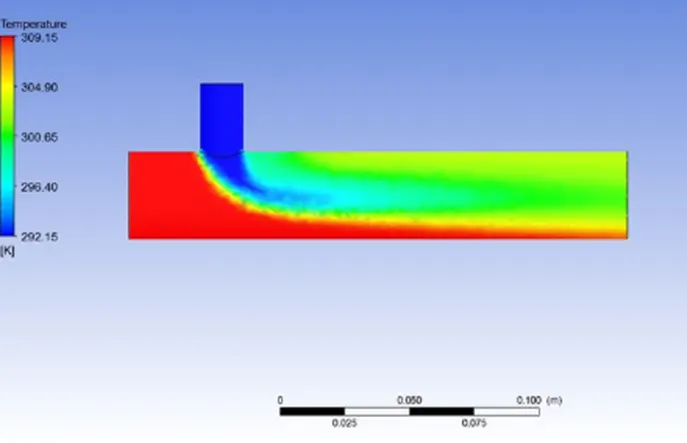
Temperature simulation
Case 1 Momentum ratio 4:
The geometry and meshing is same only change in the momentum ratio the velocity at the inlet y is increased to 12m/s
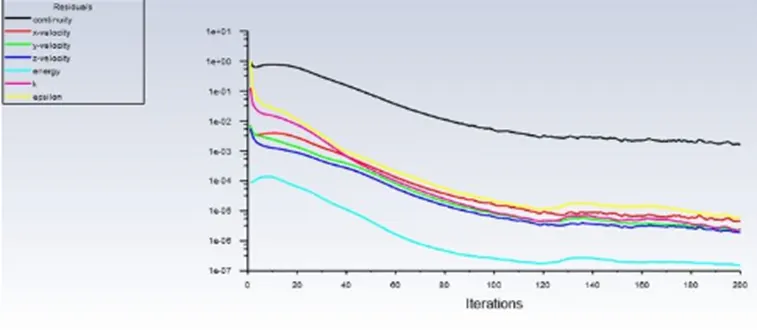
Residual plot:
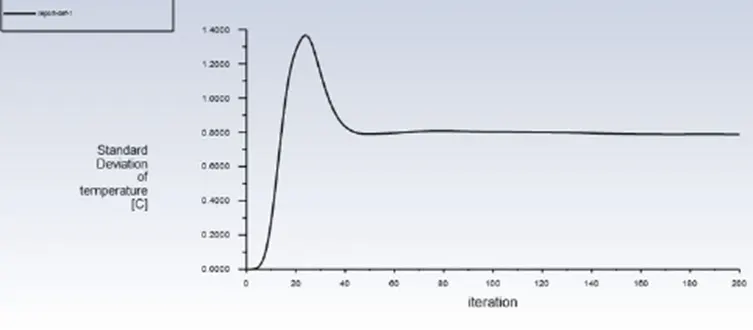
Standard deviation temperature plot
Average outlet temperature plot
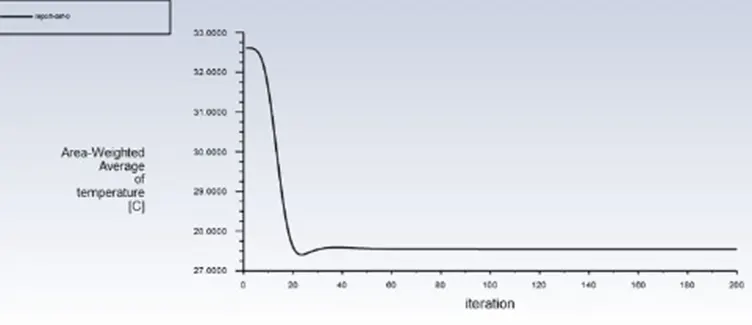
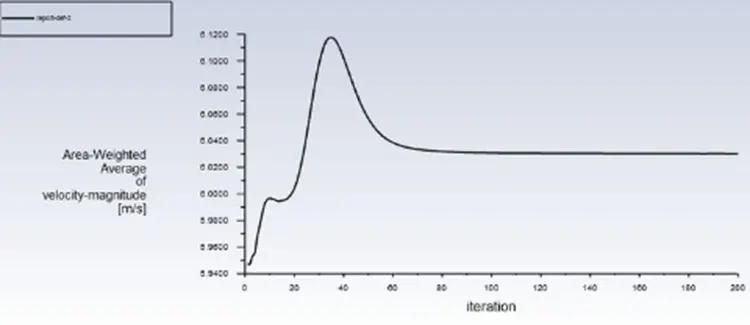
Outlet average velocity plot
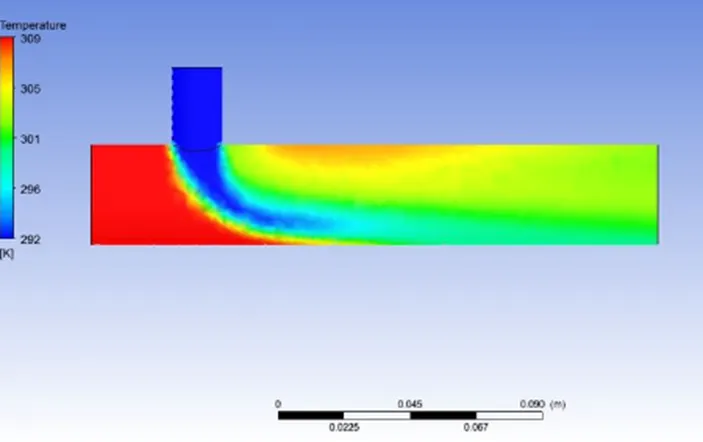
Temperature simulation
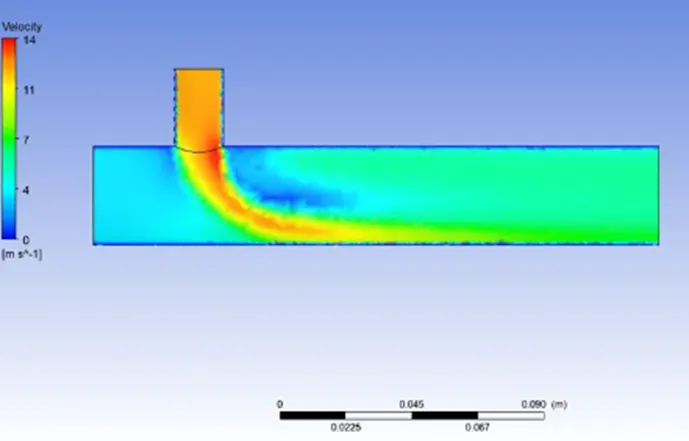
Velocity simulation
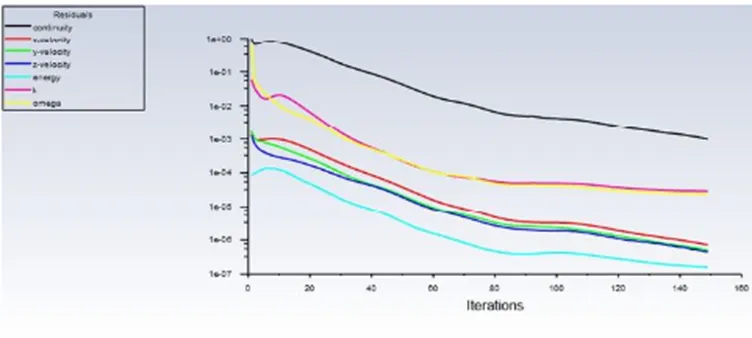
Following case omega is used convergence criteria
Residaul
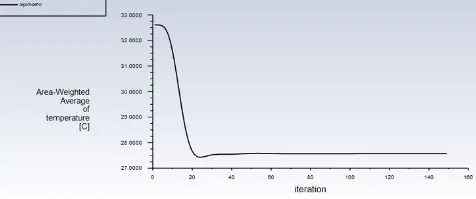
Average temperature plot outlet
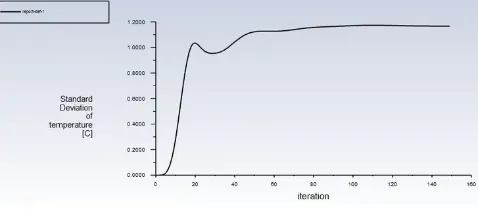
Standard deviation plot
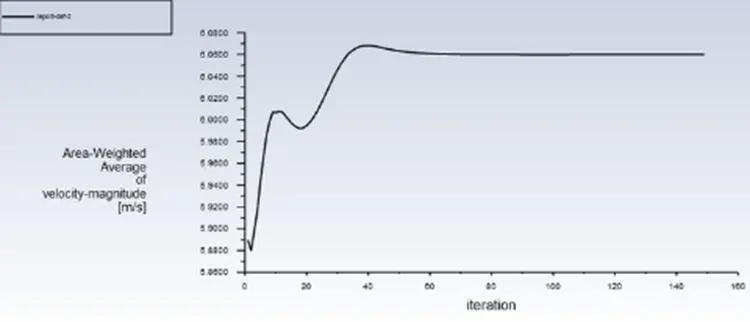
Average velocity at outlet
Velocity and temperature contours
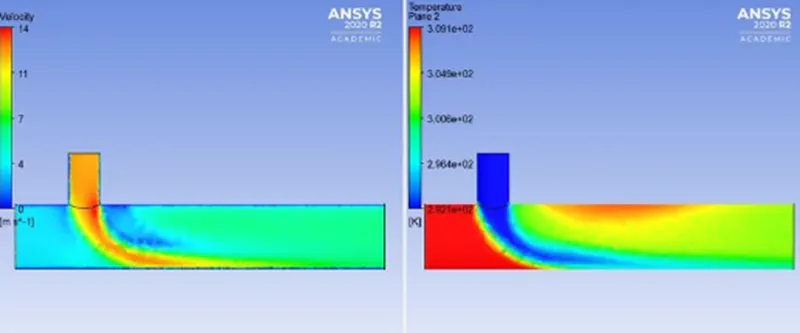
k- Epsilon model predicts well far from the boundaries (wall) and k- omega model predicts well near wall.
Case 2: long tee Momentum ratio 2.
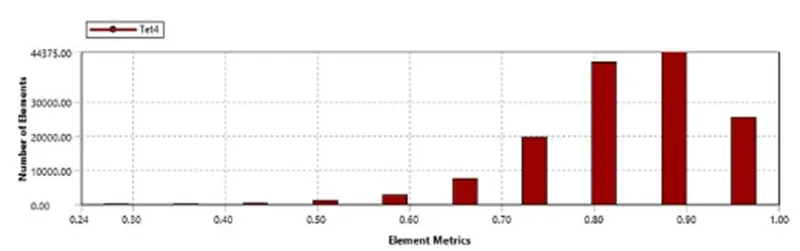
Quality of mesh
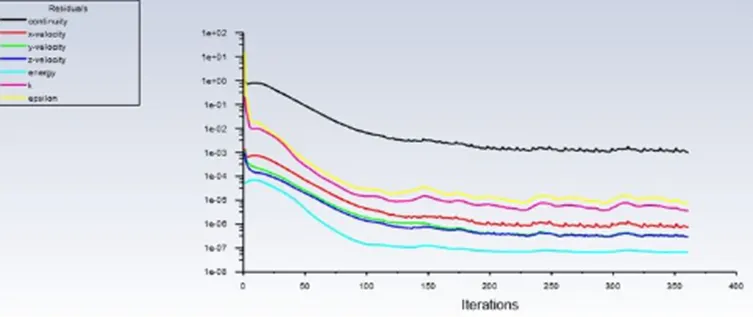
Residuals
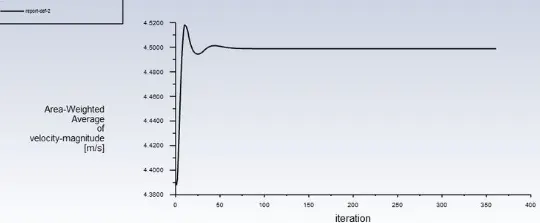
Average velocity at outlet
Standard deviation at outlet
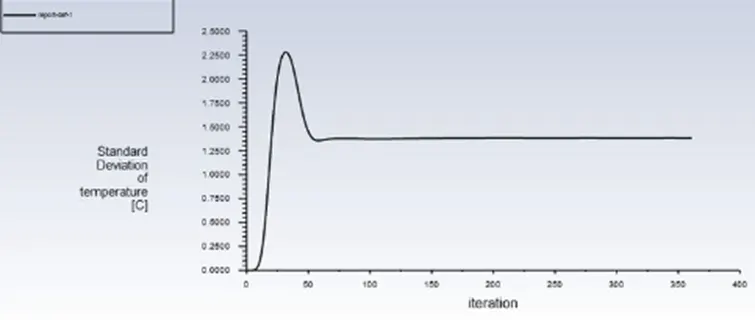
Average temperature at outlet
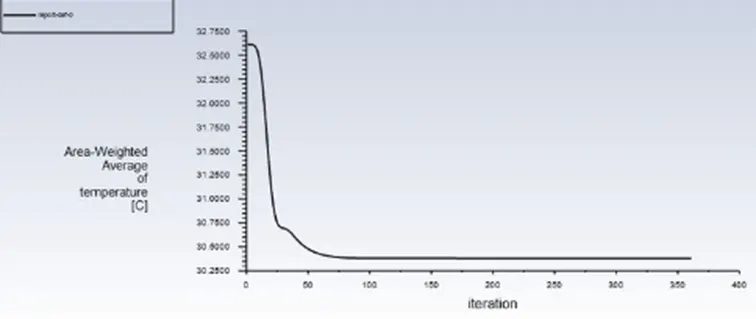
Temperature simulation
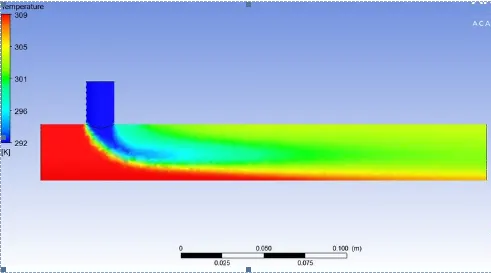
Velocity simulation
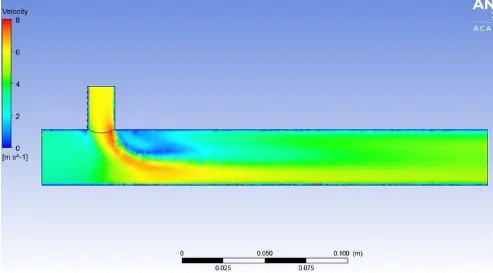
Case 2: Momentum ratio 4
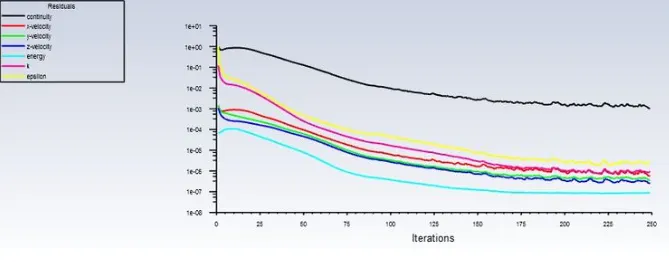
Residuals
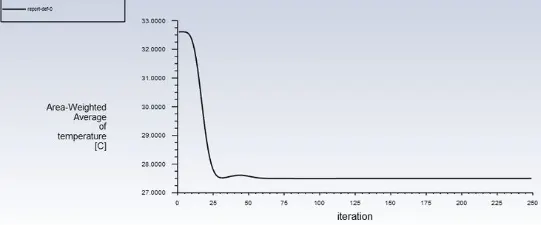
Average temperature
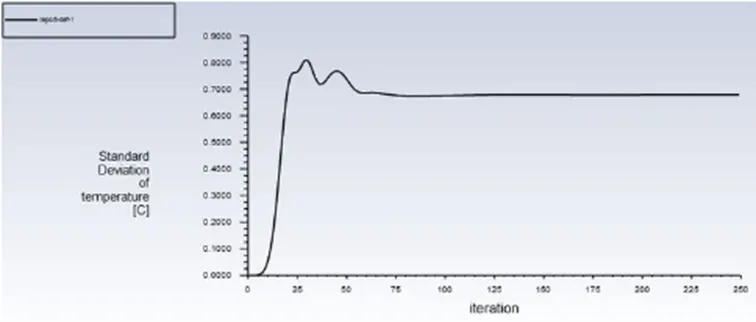
Standard deviation of temperature outlet
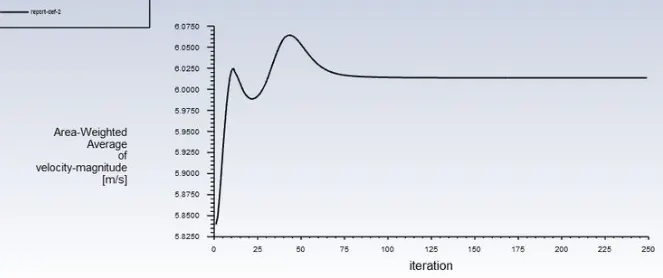
Average velocity at outlet
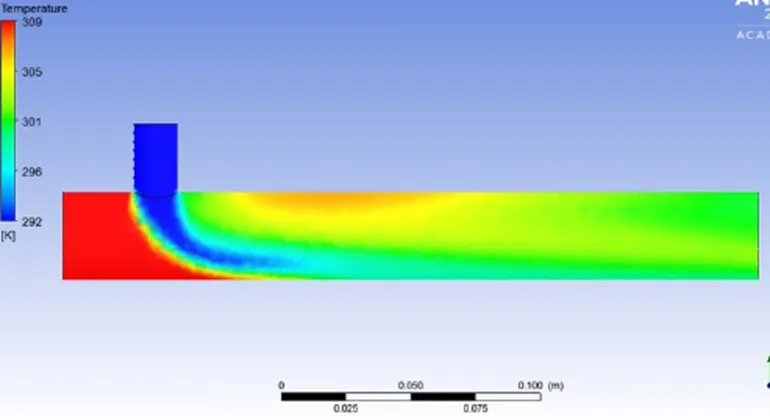
Temperature simulation
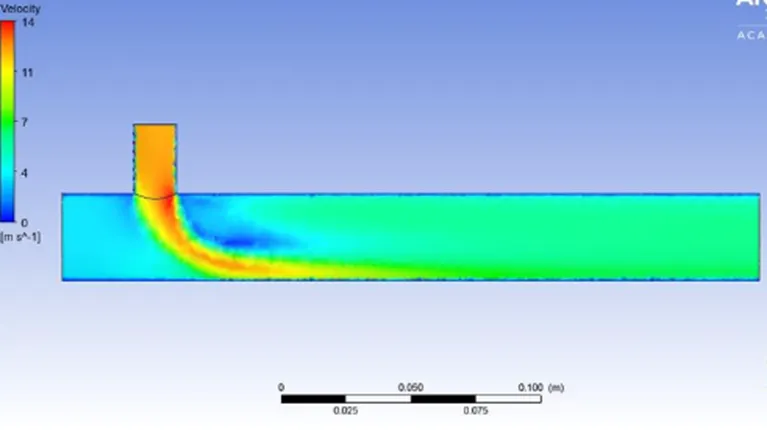
Velocity simulation
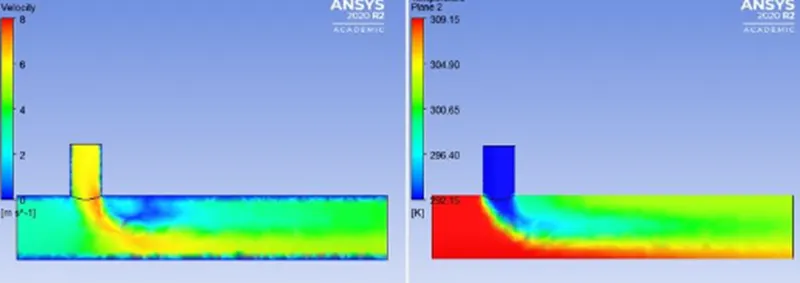
Velocity and Temperature contour
Conclusion:
- Succesfully performed Velocity and temperature contour plots on the cut planes along and across the pipe.
- Performed Velocity and temperature line plots along and across the length of the pipe.
- Performed Mesh independent study for any one case.
- the effect of length and momentum ratio on results are succesfully generated.