Week 1- Mixing Tee
AIM: To compare the mixing effectiveness of a T-shaped pipe when hot and cold air mixes at different speed with solution models of k-epsilon and k-omega.
OBJECTIVE: 1. Set up a steady state simulation for comparing mixing effectiveness of hot and cold air entering at 36oC and 19oC.
- Use K-epsilon and K-omega model for each case and give reason for choosing so..
CASE 1: shorter length of TEE shaped mixing pipe
Hot inlet velocity = 3 m/s
Momentum ratio = 2 and 4
CASE 2: Longer length of TEE shaped mixing pipe
Hot inlet velocity = 3 m/s
Momentum ratio = 2 and 4
Formula: Momentum ratio = velocity at cold inlet/ velocity at hot inlet
CASE 1:
Based on momentum ratios 2 and 4, velocity at cold inlet are 6 m/s and 12 m/s respectively. For these different situations there will be 2 subcases in this case.
Subcase 1: hot inlet velocity = 3m/s; cold velocity inlet = 6m/s; momentum ratio = 2;
Hot air temp = 36oC; Cold air temp = 19oC
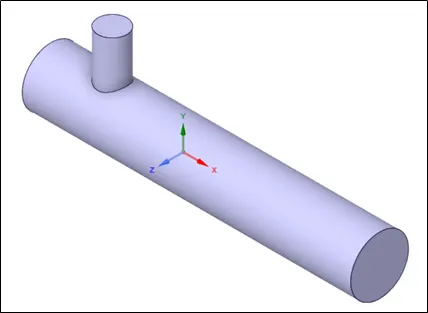
Geometry: model of the short TEE shaped mixing pipe.
MESHING: Meshing done with element size of 0.002 m.
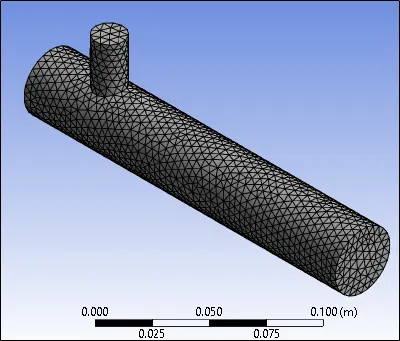
Here are the nodes and element count after meshing. Rest all settings are kept as it is.

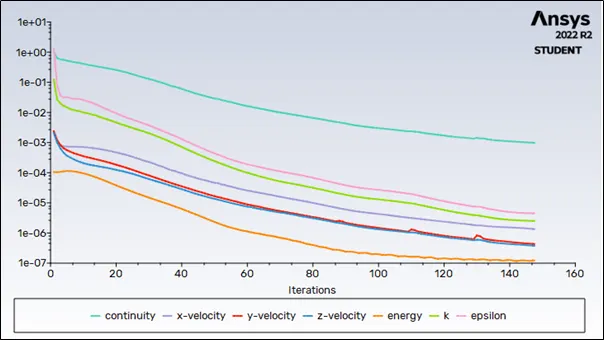
Average temperature output is 30.4 deg. Celsius.
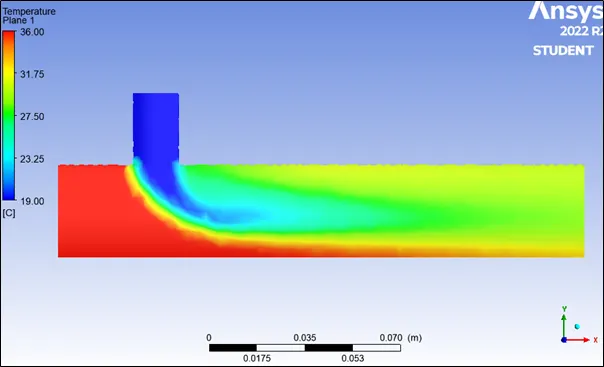
Contour Plots:
- Temperature distribution
- Along length of pipe
- Velocity Distribution
- Along the length of pipe
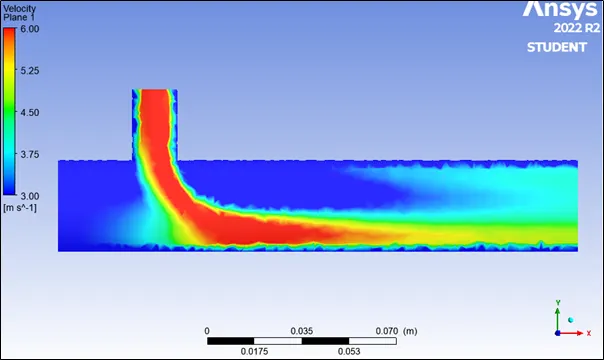
STREAMLINE PLOTS:
- Temperature distribution
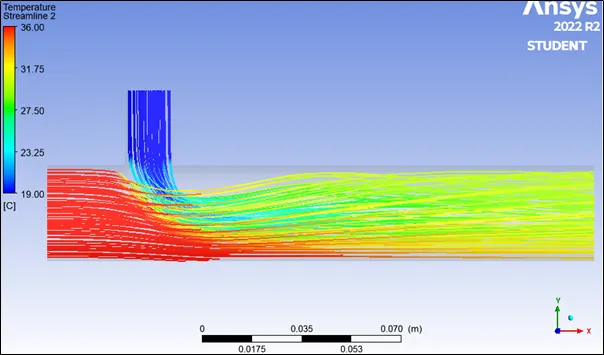
- Velocity distribution
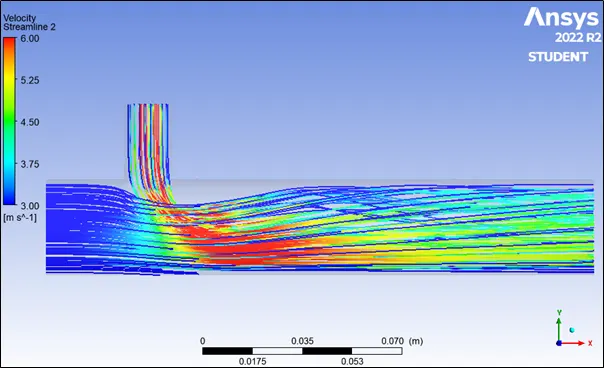
Subcase 2: hot inlet velocity = 3m/s; cold velocity inlet = 12m/s; momentum ratio = 4;
Hot air temp = 36oC; Cold air temp = 19oC
Geometry: model of the short TEE shaped mixing pipe same as that used in subcase 1.
MESHING: Meshing done with element size of 0.002 m.
Here are the nodes and element count after meshing. Rest all settings are kept as it is.
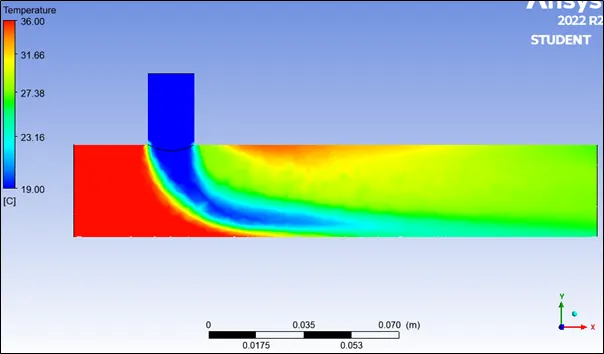
Average output temperature is 27.69
Contour Plots:
- Temperature distribution
- Along length of pipe
-
- Across the Pipe
This is shown as an animation in the video link provided. Across the pipe how the temperature varies throughout.
Link: https://youtu.be/E6oiIFKAiEU
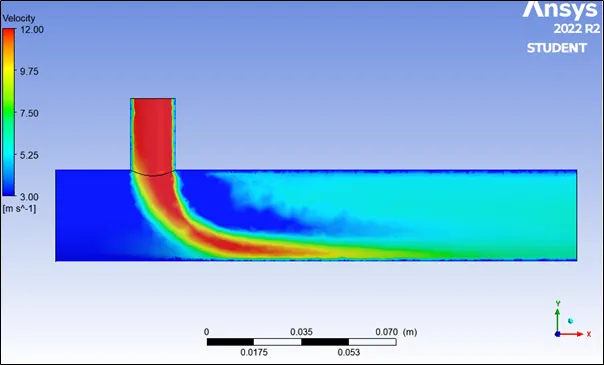
- Velocity Distribution
- Along the length of pipe
b. Across the pipe
This is shown as an animation in the video link provided. Across the pipe how the velocity varies throughout.
Link: https://youtu.be/MkMOd-XArKQ
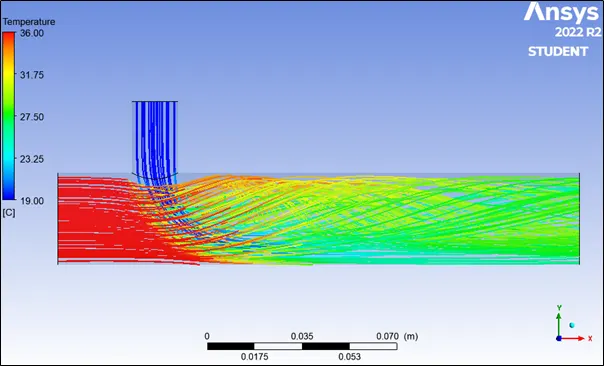
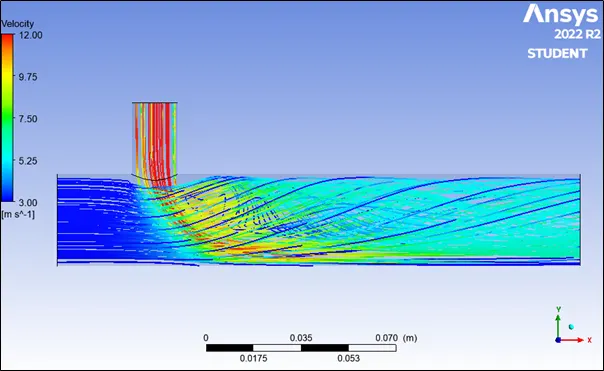
STREAMLINE PLOTS:
- Temperature distribution
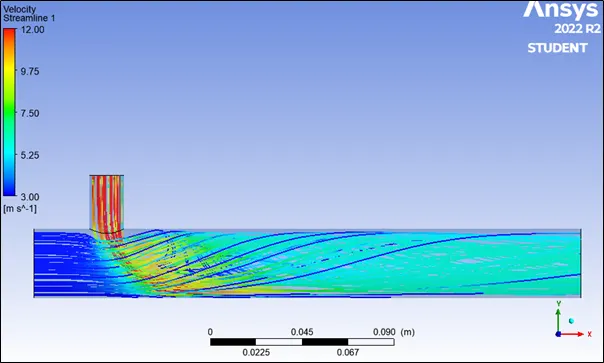
2. Velocity distribution
CASE 2:
Based on momentum ratios 2 and 4, velocity at cold inlet are 6 m/s and 12 m/s respectively. For these different situations there will be 2 subcases in this case.
Subcase 1: hot inlet velocity = 3m/s; cold velocity inlet = 6m/s; momentum ratio = 2;
Hot air temp = 36oC; Cold air temp = 19oC
Geometry: model of the long TEE shaped mixing pipe.
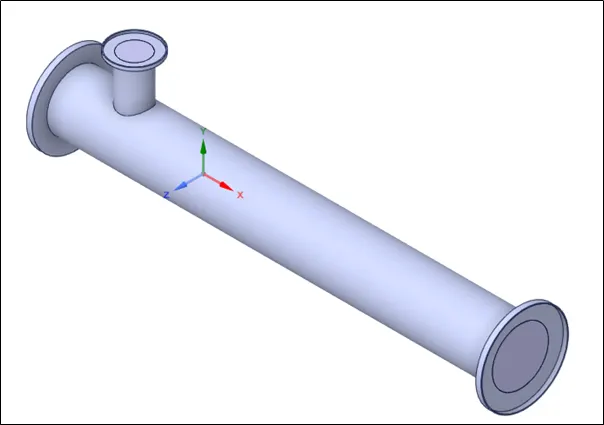
Meshing: it is performed at an element size 0.002m.
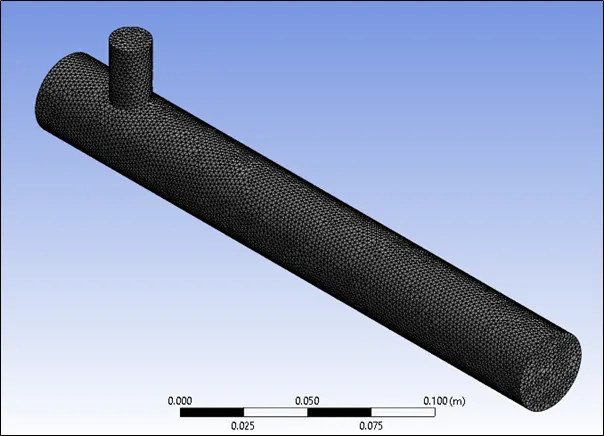
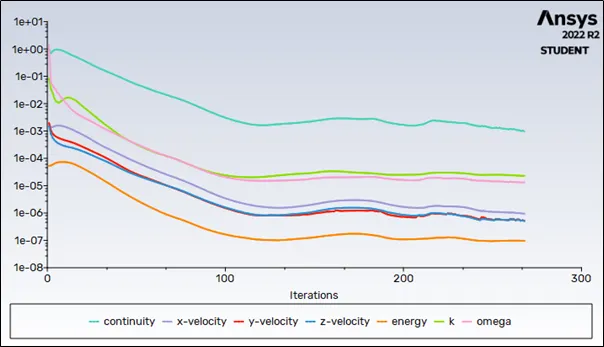
Avg output temperature 30.5
Solution converged after 268 iterations. Number of cell 141302. K-omega solver used.
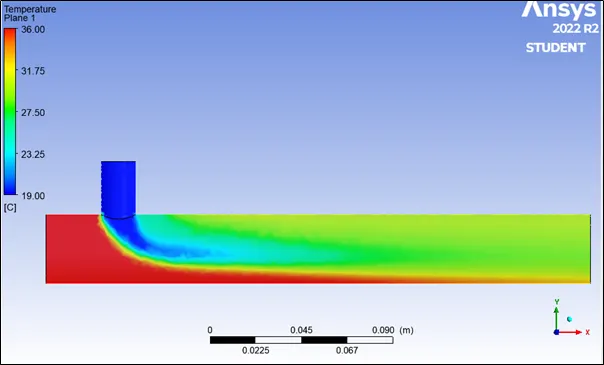
Contour Plots:
- Temperature distribution
- Along length of pipe
- Across the Pipe
- Along length of pipe
This is shown as an animation in the video link provided. Across the pipe how the temperature varies throughout.
Link: https://youtu.be/r2ImxeFo10s
- Velocity Distribution
- Along the length of pipe
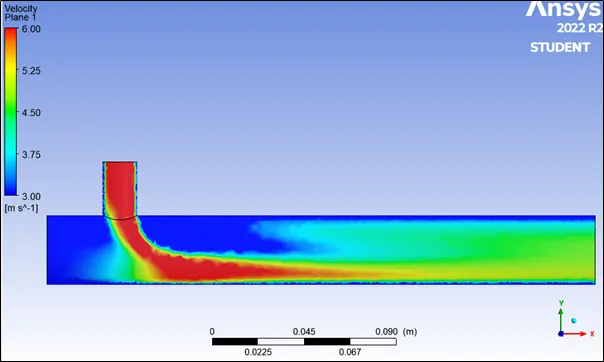
- Across the pipe
- Along the length of pipe
This is shown as an animation in the video link provided. Across the pipe how the velocity varies throughout.
Link: https://youtu.be/8JuUkBXX7Oc
STREAMLINE PLOTS:
- Temperature distribution
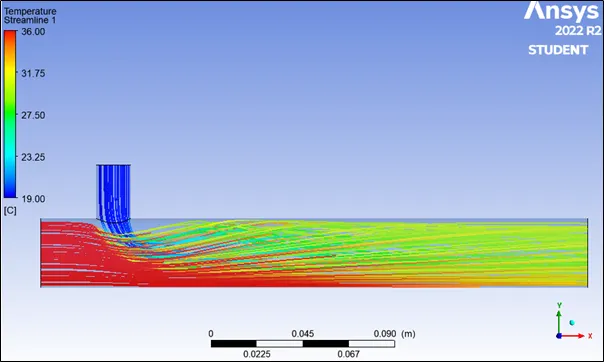
- Velocity distribution
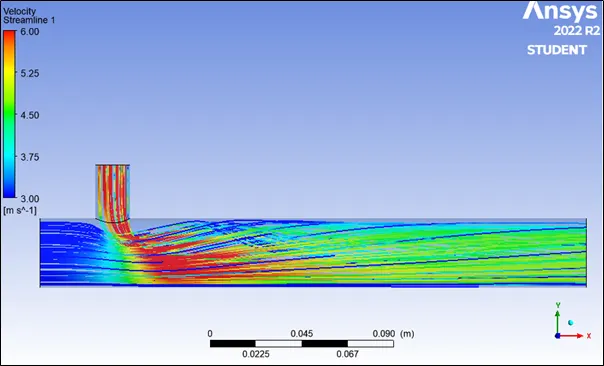
Subcase 2: hot inlet velocity = 3m/s; cold velocity inlet = 12m/s; momentum ratio = 4;
Hot air temp = 36oC; Cold air temp = 19oC
Geometry: model of the long TEE shaped mixing pipe (same as shown in subcase 1 of case 2.
Meshing: it is performed at an element size of 0.002m
Avg output temperature 27.5
Setup:
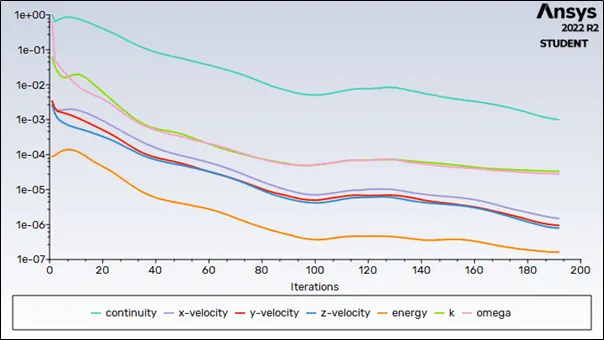
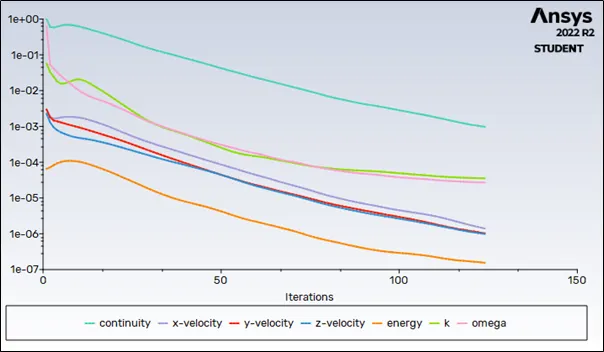
With k- epsilon solver residuals didn’t converge probably due to high inlet velocity after1050 iterations. Changed the solver to K-omega to check the possibilities of early convergence
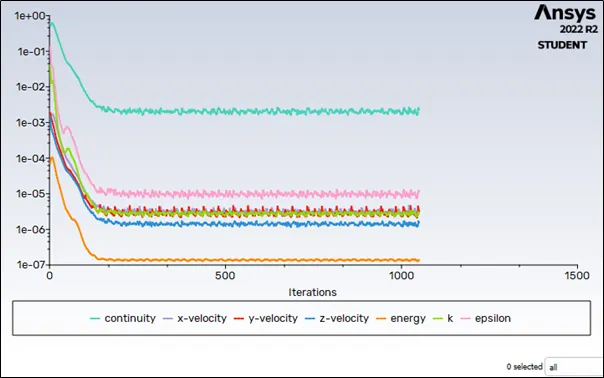
As our velocity increased 4 times k-epsilon model became less effective here while k-omega shows better results and converge after 124 iterations.
Contour Plots:
- Temperature distribution
- Along length of pipe
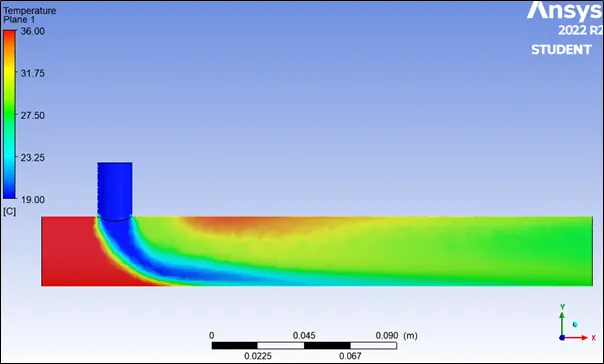
- Along length of pipe
- Velocity Distribution
- Along the length of pipe
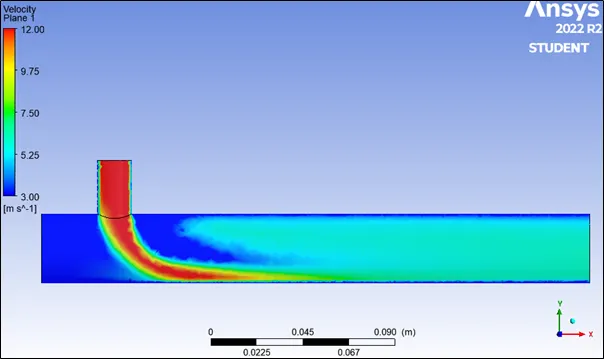
- Along the length of pipe
STREAMLINE PLOTS:
- Temperature distribution
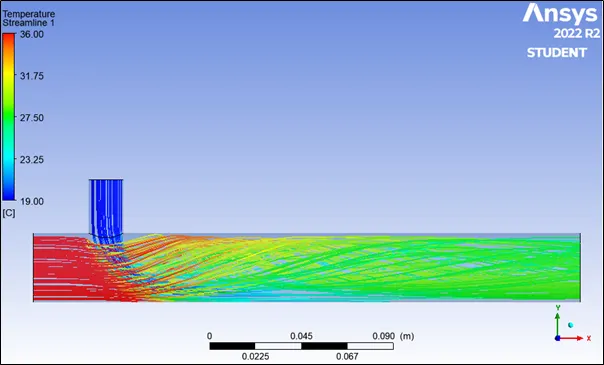
- Velocity distribution
SETUP COMPARISON TABLE:
|
Case 1 |
Case 2 |
||||
|
Subcase 1 |
Subcase 2 |
Subcase 1 |
Subcase 2 |
||
|
Cold air inlet velocity |
6 |
12 |
6 |
12 |
|
|
Cell count |
24789 |
24789 |
141302 |
141302 |
|
|
Solver used |
K-epsilon |
K-epsilon |
k-epsilon |
K-omega |
k-omega |
|
Converged after number of iterations |
148 |
192 |
165 |
268 |
124 |
|
Avg outlet temperature |
30.46 |
27.46 |
30.5 |
27.5 |
|
INFERENCE:
- As the length of pipe increases hot and cold air mixes more properly and gives lower average temperature output
- As momentum ratio increases with constant hot air inlet velocity and hot and cold air inlet temperature