Project 1 - Parsing NASA thermodynamic data
What is file parsing?
File parsing is a process of converting a raw data into a meaningful data which can be interpreted or read to understand what nature does it follow and what can be the inference. Through this we also segregate data and can chose which data to be displayed.
CODE:
clc
clear all
close all

f1 = fopen("THERMO.dat",'r');              % Opening file containing data
% skipping the lines in file to reach required line
tline = fgetl(f1);
tline = fgetl(f1);
f1_int = strsplit(tline,'0 ');

% Calculating global temperature values
global_low_temp = str2num(f1_int{1});
global_mid_temp = str2num(f1_int{2});
global_high_temp = str2num(f1_int{3});

tline = fgetl(f1);
tline = fgetl(f1);
tline = fgetl(f1);

% Taking input from user about species
x = inputdlg('Enter molecule to search:','Input',[1 10]);

% performing while loop till the file end
while ~feof(f1)
    tline = fgetl(f1);
    f1_terms = strsplit(tline,' ');
    if strcmpi(x,f1_terms(1)) ==1;          % comparing species with case insensitive
        disp('Species data available');
        size_1 = length(f1_terms);
        % calculating local temperatures of species entered
        local_temp_min = f1_terms(size_1 -3);
        local_temp_min = str2num(local_temp_min{1});
        local_temp_max = f1_terms(size_1 -2);
        local_temp_max = str2num(local_temp_max{1});
        local_temp_mid = f1_terms(size_1 -1);
        local_temp_mid = str2num(local_temp_mid{1});
        tline = fgetl(f1);

        % Calculating coefficients from file opened
        coeffs = strfind(tline,'E');
        a1 = str2num(tline(1:coeffs(1)+3));
        a2 = str2num(tline(coeffs(1)+4:coeffs(2)+3));
        a3 = str2num(tline(coeffs(2)+4:coeffs(3)+3));
        a4 = str2num(tline(coeffs(3)+4:coeffs(4)+3));
        a5 = str2num(tline(coeffs(4)+4:coeffs(5)+3));

        tline = fgetl(f1);
        coeffs = strfind(tline,'E');
        a6 = str2num(tline(1:coeffs(1)+3));
        a7 = str2num(tline(coeffs(1)+4:coeffs(2)+3));
        a8 = str2num(tline(coeffs(2)+4:coeffs(3)+3));
        a9 = str2num(tline(coeffs(3)+4:coeffs(4)+3));
        a10 = str2num(tline(coeffs(4)+4:coeffs(5)+3));

        tline = fgetl(f1);
        coeffs = strfind(tline,'E');
        a11 = str2num(tline(1:coeffs(1)+3));
        a12 = str2num(tline(coeffs(1)+4:coeffs(2)+3));
        a13 = str2num(tline(coeffs(2)+4:coeffs(3)+3));
        a14 = str2num(tline(coeffs(3)+4:coeffs(4)+3));
        Trange = linspace(local_temp_min,local_temp_max,5000);
        R = 8.314;

        % calculate specific heat using function
        cp = specific_heat(a1,a2,a3,a4,a5,a8,a9,a10,a11,a12,Trange,R,local_temp_mid);

        % calculate entropy using function
        S = entropy(a1,a2,a3,a4,a5,a7,a8,a9,a10,a11,a12,a14,R,Trange,local_temp_mid);

        % calculate enthalpy using function
        H = enthalpy(a1,a2,a3,a4,a5,a6,a8,a9,a10,a11,a12,a13,R,Trange,local_temp_mid);

        % Plotting graphs of each function value against temperature
        figure(1)
        plot(Trange,cp,'LineWidth',3,'Color','r')
        xlabel('Temperature')
        ylabel('Specific Heat')
        title(sprintf('Specific heat graph for %s',string(x)))

        figure(2)
        plot(Trange,S,'LineWidth',3,'Color','g')
        xlabel('Temperature')
        ylabel('Entropy')
        title(sprintf('Entropy graph for %s',string(x)))

        figure(3)
        plot(Trange,H,'LineWidth',3,'Color','b')
        xlabel('Temperature')
        ylabel('Enthalpy')
        title(sprintf('Enthalpy graph for %s',string(x)))

        cd('Plots for species\')            % changing directory where graphs will be saved
        mkdir(string(x))                    % creating directory in that file path
        cd(string(x))                       % Changing directory to new directory

        % Saving all plots in the directory with particular name
        saveas(figure(1),'Cp vs T.jpg');
        saveas(figure(2),'S vs T.jpg');
        saveas(figure(3),'H vs T.jpg');
        cd('F:\MATLAB\Project\Project 1')       % Changing directory back to where code is placed
        fclose('all');
        x = string(upper(x));
        x = convertStringsToChars(x);
        m = mol_weight(x);                      % calculating molecular weight of user entered species
        disp('Molecule entered');
        disp(x);
        disp('Molecular weight: ');
        disp(m);

        break
    elseif strcmpi(x,f1_terms(1)) ==0 && ~feof(f1)
        continue

    else
        disp('Species not found');

    end
end
Above code is generated so as to create an understandable data from the input of thermodynamic values of enthalpy, entropy and specific heat for a particular component and also some coefficients for its calculation and temperature range for each individual items. Data provided by NASA.
Code starts with basics of ‘ clc ’, ‘ clear all’, ‘close all’. We take the input of thermodynamic file named ‘ THERMO.dat ‘ using the command ‘ fopen ‘ in read only format as we don’t have to change anything in the file.
After the file is open we extract the global temperature range and mid temperature. For this we use a command ‘fgetl()’ to jump to next line. Similarly after extracting global temperature, we again use ‘fgetl()’ command multiple times to skip the comments in between.
Here we first ask the user to enter the species name which he wants to get the data for. To take input here we have used ‘inputdlg()’ to get the input and stored in variable ‘x’.
After we reach the first line of data file which provides species data, that line is assigned to a variable named ‘tline’. This line contains species name and local temperature values for that particular species. This is a string value so to split it into individual members in an array, ‘strsplit(‘line to split’,’delimiter’)’, this command is used using the delimiter space in the string.
From this array 1st letter is always the species which is always the main condition to execute further statements in that particular species group.
First we have to check whether this species is available in the data we have or not. To check this we are using ‘while’ loop here with a built in command ‘feof()’. ‘feof()’ runs the code till the end of file. Since, in this case we want it to run till end of life not after the end of file, we use negation symbol ‘~’ which makes this while loop to run till the end of file.
Inside this loop, we create a conditional loop ‘if – else’ to specify what to do when item is present in the file and what message to show if not.
So in the the first if condition species name is checked with data file to the input by user using the ‘strcmpi’ command which checks the string making it case insensitive for better and fast results. If this condition is fulfilled it will get minimum local temperature, maximum local temperature and mid local temperature from the same line of array. After temperature values are extracted, we use the same ‘fgetl()’ command to move to next line which contains the temperature coefficients values. This line and next 2 lines contains this value.
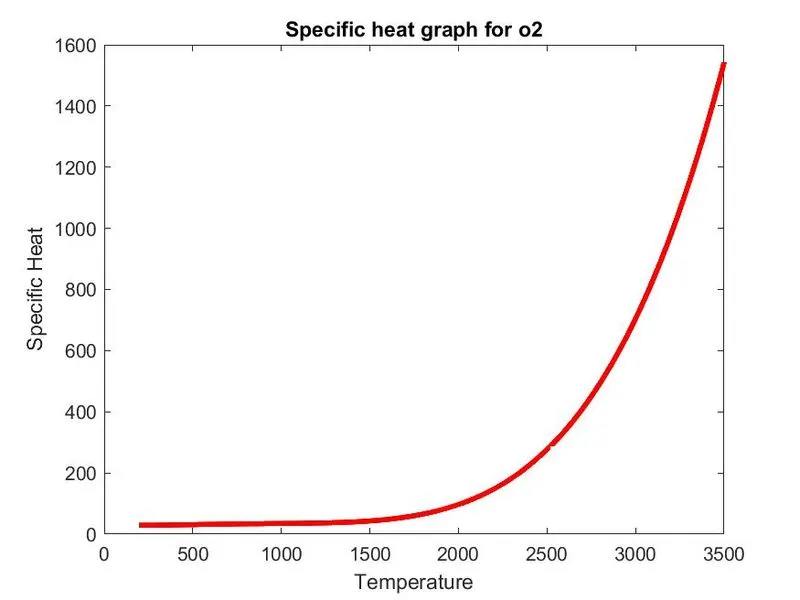
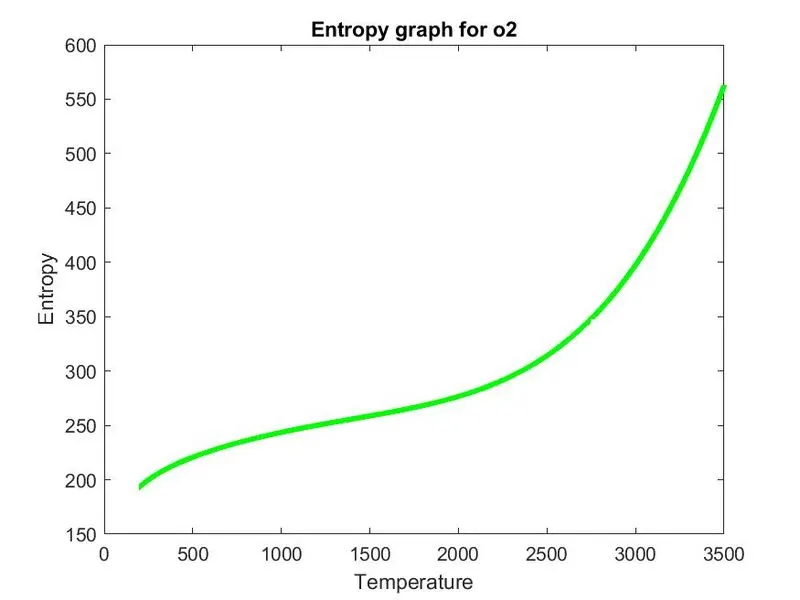
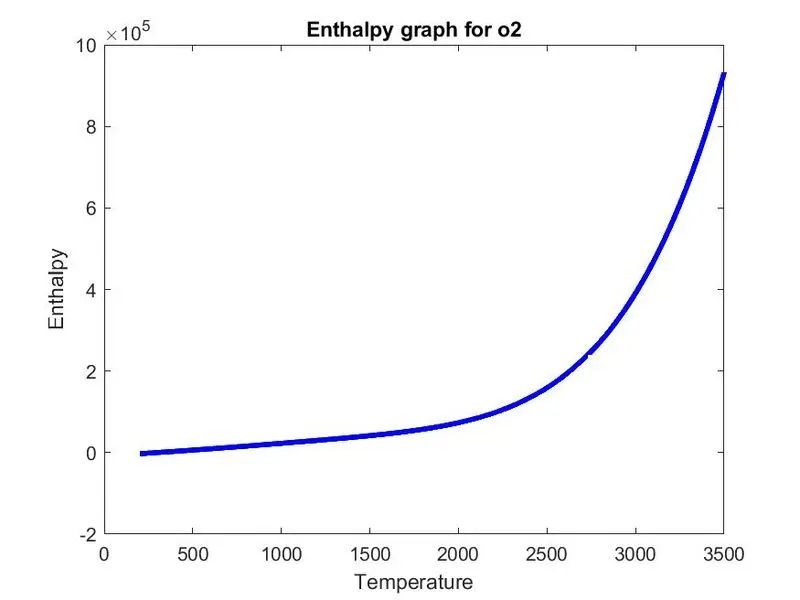
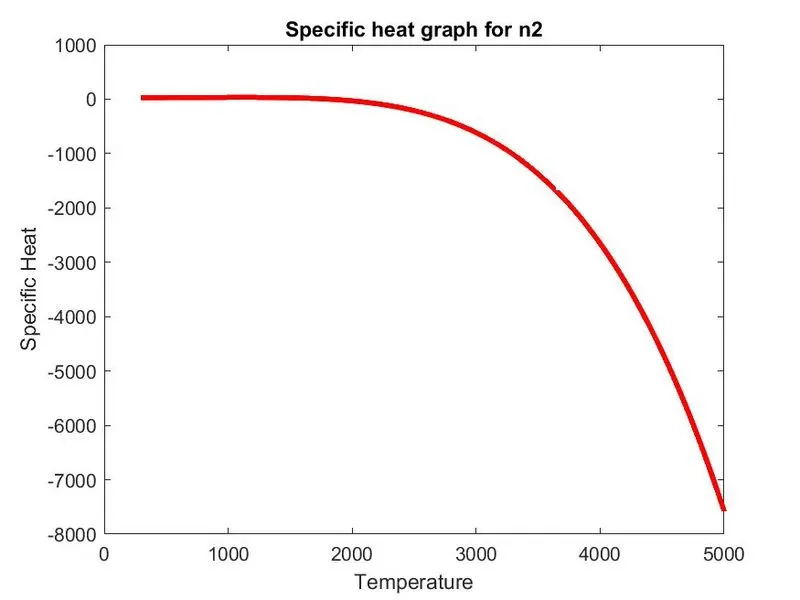
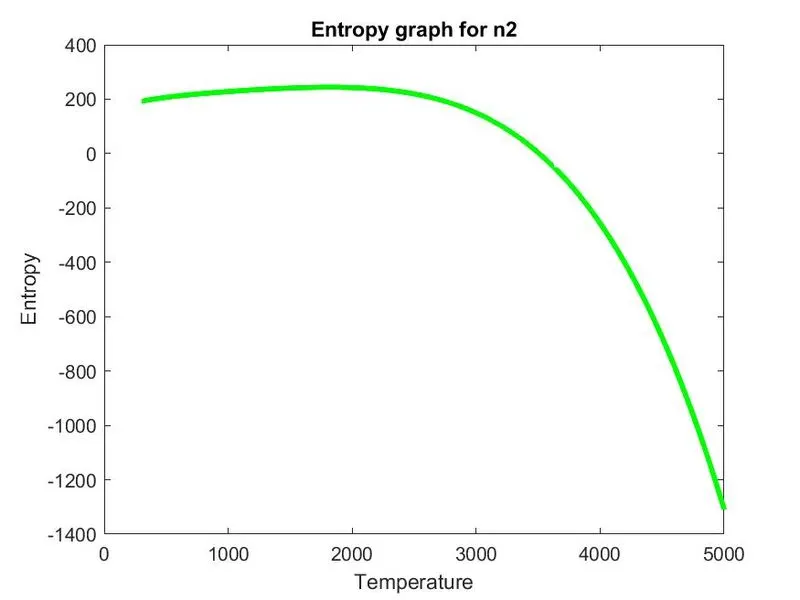
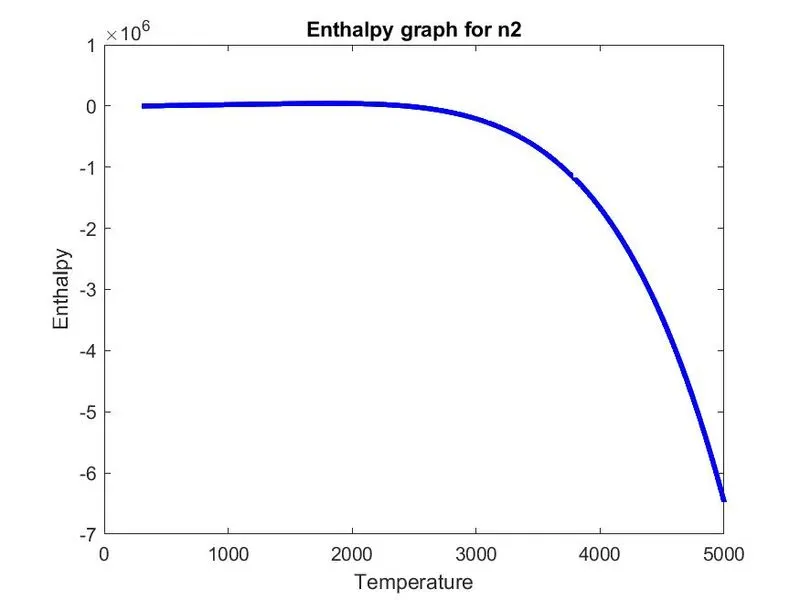
After this, we calculate specific heat, entropy and enthalpy values for the full range of local temperature values for that species. For these values a separate function is created which is attached after this.
Then, we have to plot this value of specific heat, entropy and enthalpy against the specie’s local temperature range with plot having the title relating to species, ‘xlabel’ as temperature and ‘ylabel’ as quantity being plotted.
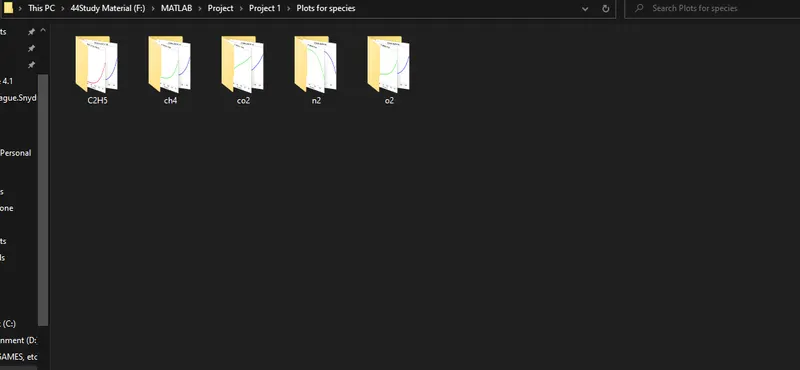
Here we are also saving each plot with some name and in specific folder relating to the species name. To do that we have to create a new folder in current directory using the command ‘mkdir()’ after this is done we have to change the directory to that particular folder using ‘cd()’ command and save different plots in that folder for species being identified using ‘saveas()’ command.
After this we change the directory back to folder where coded file is present using the same ‘cd’ command.
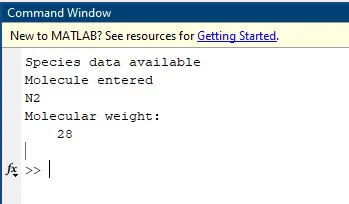
Once this is done, we calculate the molecular weight of that species using the function created for the same. (Function code screenshot is attached after this)
After this, using the ‘break’ command we fall out of the while loop as we identified species and done the operations to it.
When first if condition is not fulfilled it goes to second condition when it’s not there to either continue the while loop if it’s not the end of file or display the message that ‘Species data not available’ if it’s not matching with any element throughout the file.
CODE FOR FUNCTIONS:
- Specific heat function
function [cp]=specific_heat(a1,a2,a3,a4,a5,a8,a9,a10,a11,a12,Trange,R,local_temp_mid) if Trange > local_temp_mid; cp = R * (a1 + (a2 * (Trange)) + (a3 * (Trange.^2)) + (a4 * (Trange.^3)) + (a5 * (Trange.^4))); else; cp = R * (a8 + (a9 * (Trange)) + (a10 * (Trange.^2)) + (a11 * (Trange.^3)) + (a12 * (Trange.^4))); end end - Entropy function
function [S] = entropy(a1,a2,a3,a4,a5,a7,a8,a9,a10,a11,a12,a14,R,Trange,local_temp_mid) if Trange > local_temp_mid; S = R * ((a1 * log(Trange)) + (a2 * (Trange)) + (a3 * (Trange.^2)/2) + (a4 * (Trange.^3)/3) + (a5 * (Trange.^4)/4) + a7); else; S = R * ((a8 * log(Trange)) + (a9 * (Trange)) + (a10 * (Trange.^2)/2) + (a11 * (Trange.^3)/3) + (a12 * (Trange.^4)/4) + a14); end end - Enthalpy function
function [H] = enthalpy(a1,a2,a3,a4,a5,a6,a8,a9,a10,a11,a12,a13,R,Trange,local_temp_mid) if Trange > local_temp_mid H = R .* Trange .* (a1 + (a2 * (Trange)/2) + (a3 * (Trange.^2)/3) + (a4 * (Trange.^3)/4) + (a5 * (Trange.^4)/5) + (a6./Trange)); else H = R .* Trange .* (a8 + (a9 * (Trange)/2) + (a10 * (Trange.^2)/3) + (a11 * (Trange.^3)/4) + (a12 * (Trange.^4)/5) + (a13./Trange)); end end - Molecular weight function
function [m] = mol_weight(x)

mol = ['O','H','C','N','A'];
weight = [16,1,12,14,40];
a = length(x);
b = length(mol);
m=0;

for i = 1:a
    for j = 1:b
        if strcmpi(x(i),mol(j))==1
            m = m + weight(j);
            y = j;

        end
    end


        n = str2num(x(i));
        if n>1
            m = m +(weight(y)*(n-1));
        end

end
% M = m;
end
REQUIRED SCREENSHOTS:
- Species O2, N2 and CO2 graph and screenshots
- O2
- Cp vs T
- S vs T
- H vs T
- Molecular weight command window screenshot
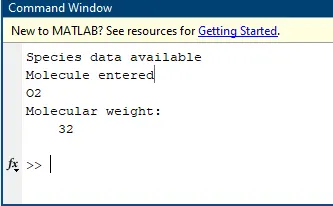
- Cp vs T
- N2
- CP vs T
- S vs T
- H vs T
- Molecular weight command window screenshot
- CP vs T
- CO2
- CP vs T
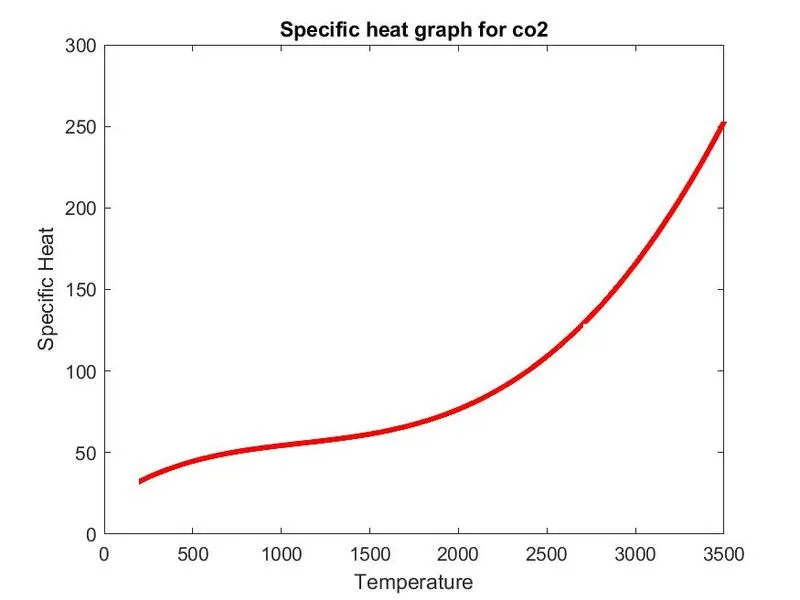
- S vs T
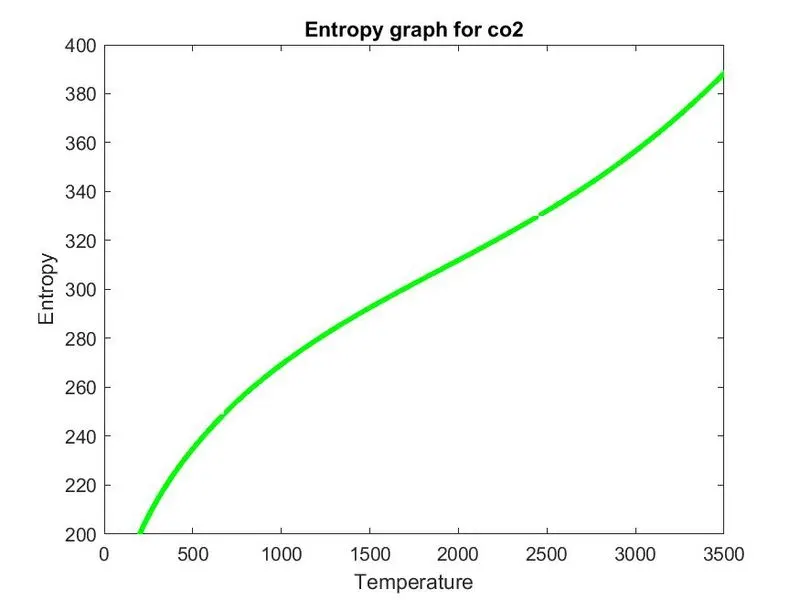
- H vs T
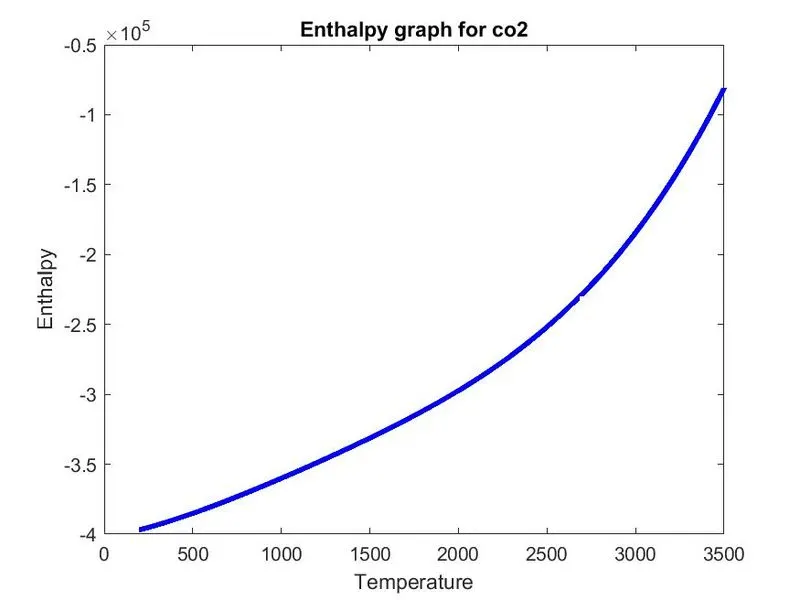
- Molecular weight command window screenshot
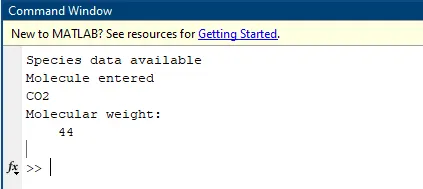
- CP vs T
- O2
- Screenshot of directory where Species data is saved