Week 1- Mixing Tee
Theory:
Your job is to set up steady-state simulations to compare the mixing effectiveness when hot inlet temperature is 360C & the Cold inlet is at 190C.
- Case 1
- Short mixing tee with a hot inlet velocity of 3m/s.
- Momentum ratio of 2, 4.
- Case 2
- Long mixing tee with a hot inlet velocity of 3m/s.
- Momentum ratio of 2, 4.
Momentum ratio = velocity at cold inlet / velocity at hot inlet
In a table, compare the following values from the 2 cases.
Case1
Here we have to check the affect of velocity if we change the velocity cold air, what is affect of mixing affect in long and shot pipe.
So we select the ansys work bench to precede the test.
Select fluid fluent.
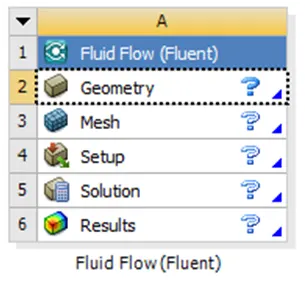
GEOMETERY:
Extract the volume because we have concentrate on internal volume on the tube, the disable the tube and suppress the physical property because, our concentration is only on the internal volumes.
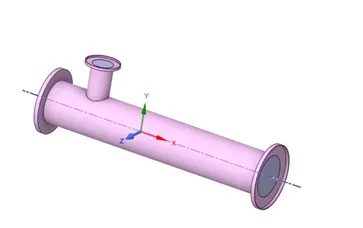
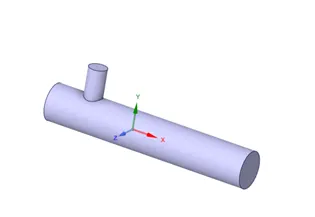
MESH:
Firstly name all the outer faces as
- Inletx: inlet of normal air
- Outlet: outlet of mixture
- Wall: outer wall
- Inlety: inlet of cooled air
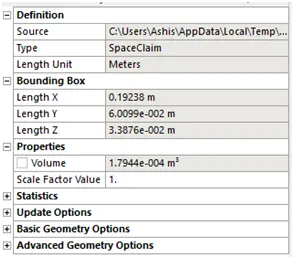 Bondage aria is the aria which cover all the volume in that smalest volume.
Mash>> mash generation
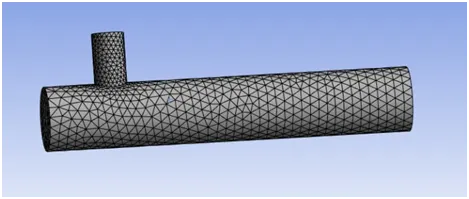
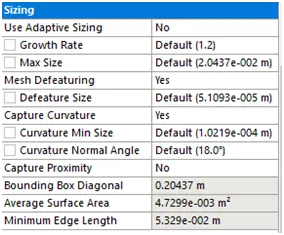
Sizing gives us mash parameters
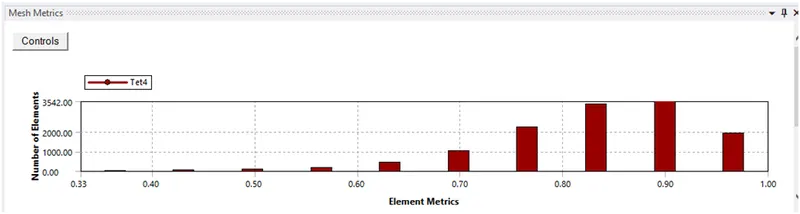
Element quality show the element matrix that should not less than 5%,so here mash was ok.
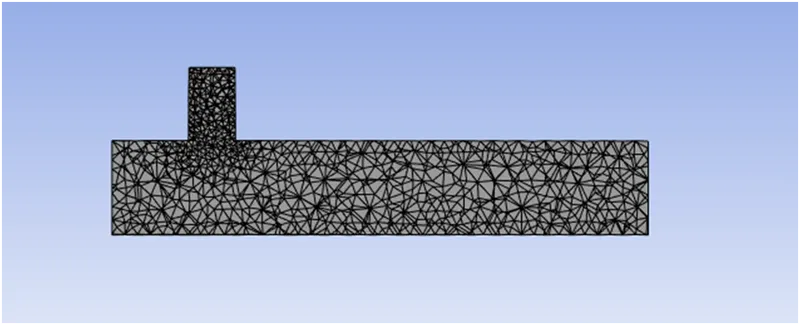
Setup:
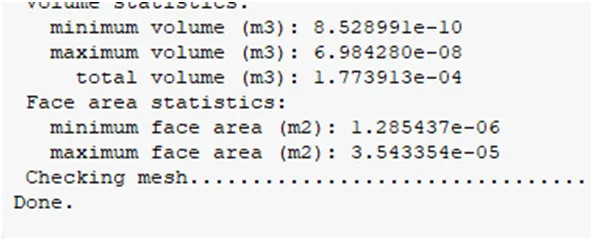 Does the mash check, Found mash was ok.
Setup in physics
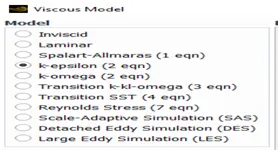
Use k-epsilon model, energy equation, pressure based solution (flow is incompressible) and steady flow.
Air is the working fluid.
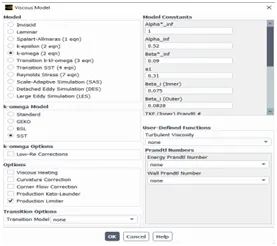
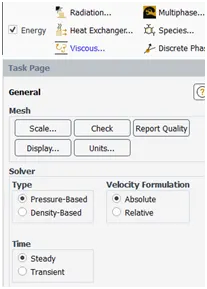
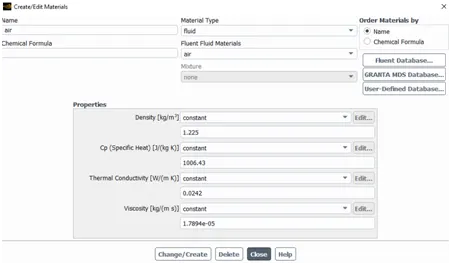
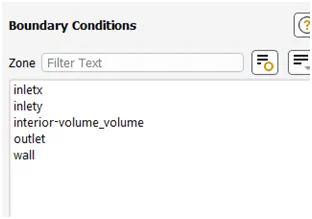
Set the boundery conditions inletx velocity is 3m/s and tempreture as 36DegC.
Inlety velocity is 6M/s and tempreture as 19DegC.
Outlet pressure geuge pressure is Zero.
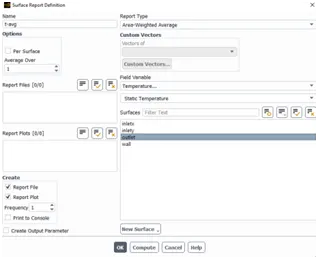
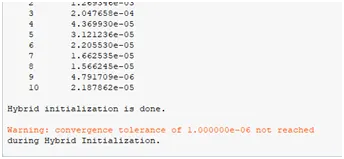
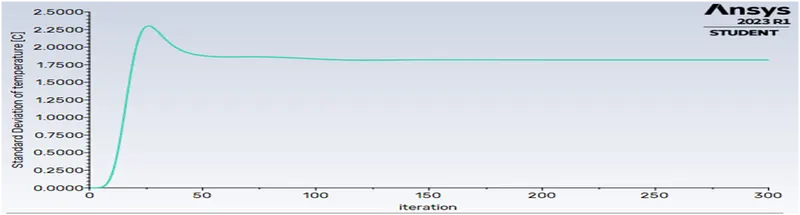
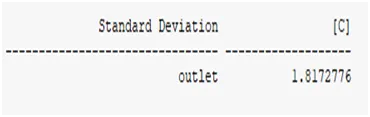
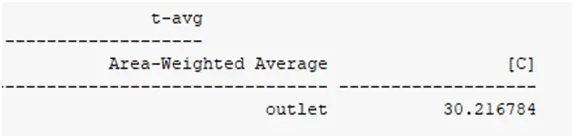
Two report was genrate one is standard deviation another was aria-weighted avarage.
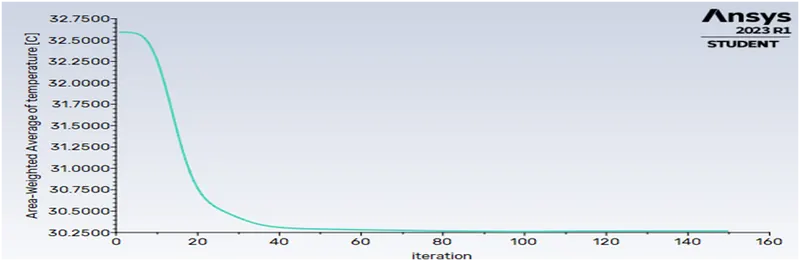
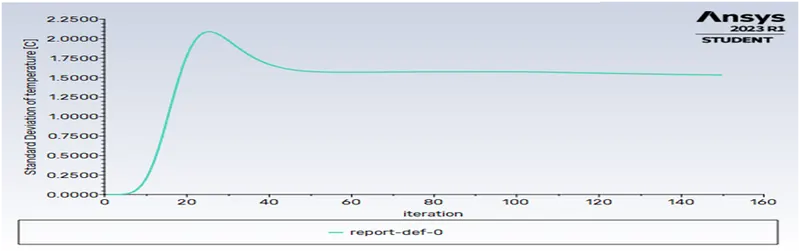
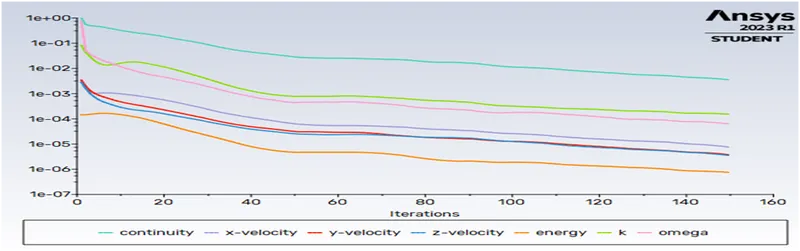
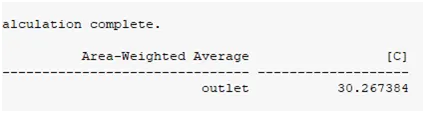
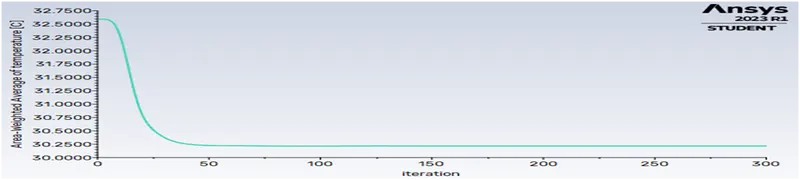
- These are the plot of aria weighted average temperature plots show that average temperature of the outlet temperature is 30.26
- Standard deviation show distribution of statistical data.
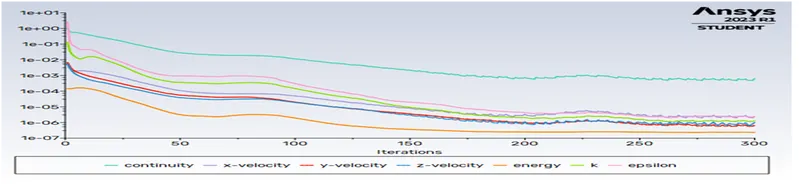
- Scaled residual measure the difference between previous iteration and present iteration, Here we iterate 250 time it stop in 150 because the value converge toward the actual value.
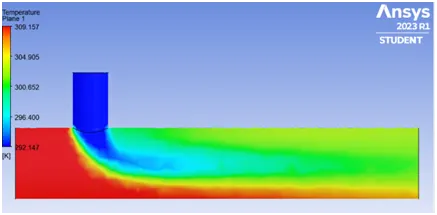
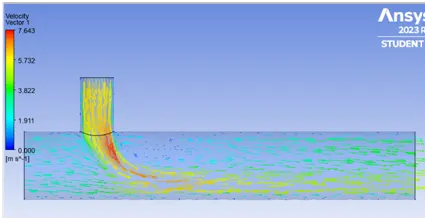
These two reprasent the tempreture and velocity distribution in th XY –section.
Setup as K-epsalan
 .
.
- Here residual value was not straight.
- The standard deviation value was low so the temperature distribution of the temperature is uniform then K-omega.
Case2
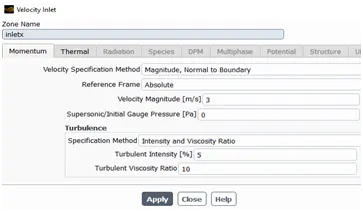
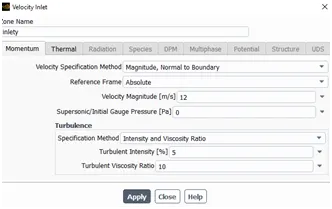
According to the moment ratio is 6 so inlet velocity of the cold air is 12m/s.
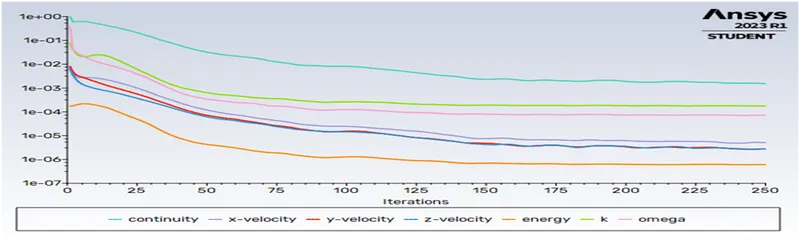
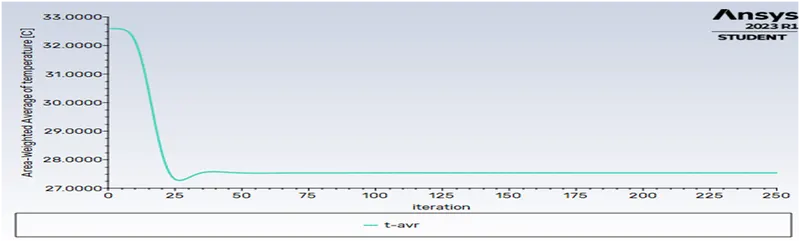
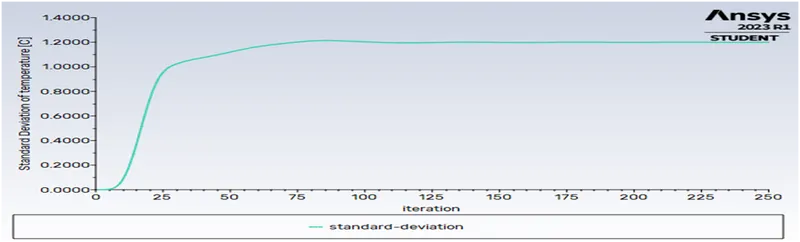
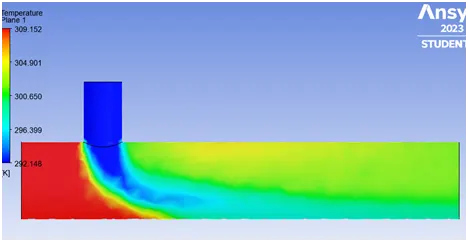
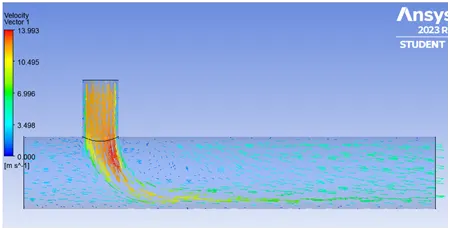
- Here after the 150 iteration, the residual get nearly straight because the we close to actual value.
- The standard deviation value was low so the temperature distribution of the temperature is uniform then moment ratio 2.
- Here output temperature is 5C .
For Long T:
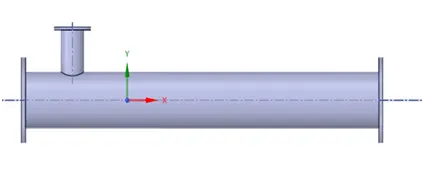
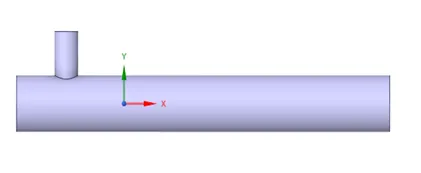
First fig. is the log Tjoint and second fig. is the extracted volume ,because this is the concentrated volume to work.
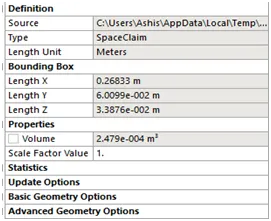

Name the faces as and check the bounding box size then genrate the mash.
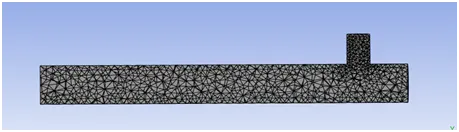
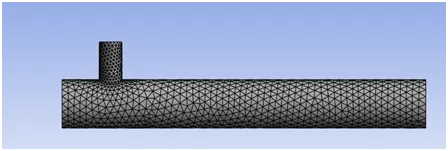
Mash internal and surface view.

Element quality is 40%.
Case1
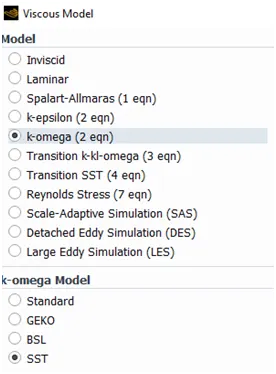 Select the viscous model for K-Omega equation.
 hot air inlet velocity is 3m/s.
 Temperature is 36 Deg C.
Similarly cool air temperature 19 Deg C and velocity 6m/s..
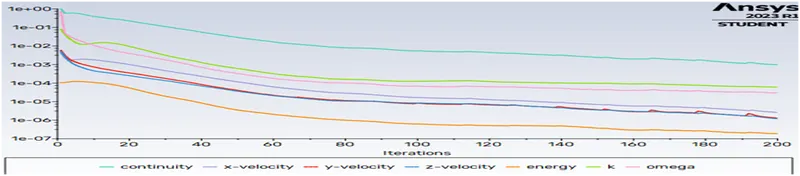
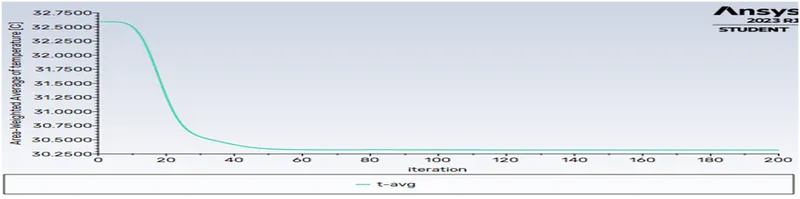
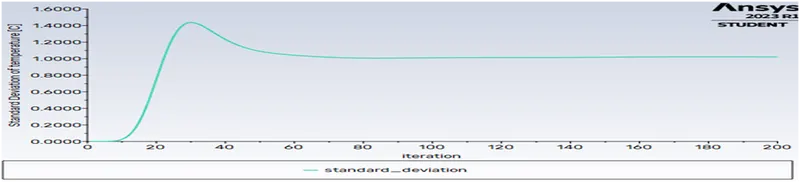
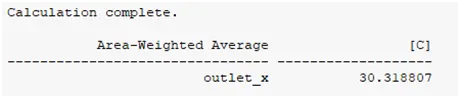

- We iterate 250 times but it was stopped after 200 iteration because the value gets closer to three decimal point of actual value.
- Stranded deviation of Temperature show that temperature was properly distribute then short- T .
- Outlet temperature is 30.3.
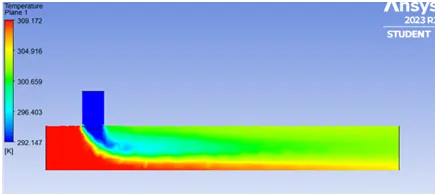
Case2
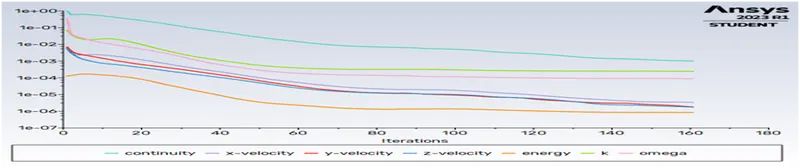

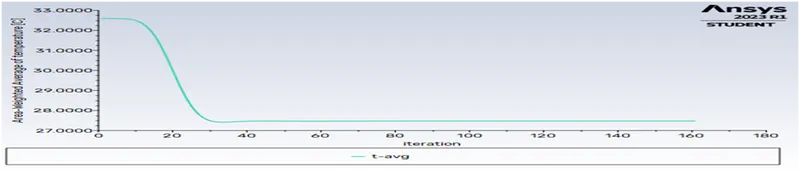


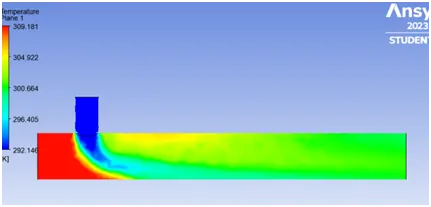
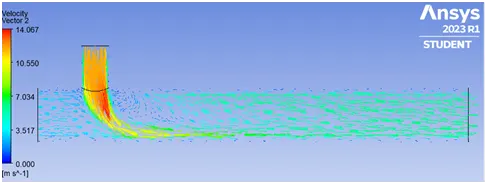
- We found scale residual is closer to the actual value till the 3 decimal point so the iteration was stopped in the 160 iteration.
- Standard deviation was very less so the temperature distribution was uniform.
- There is not creating any effect in the long-T, it only effect the velocity of the cold air.
Conclusion:
1.Outlet tempreture depeands on the velocity of cold air if the velocity hot air is constand.
2.Length of the tube effect the tempreture distribution.In Long-T we get a propere mixture of air.