Week 1- Mixing Tee
AIM :
To perform the CFD flow analysis on the given Short mixing and long tee mixing models for mixing effectiveness for the hot and cold fluids mixing at the tee interface for two momentum ratios.Interpret the result of the mixing and conclude the case comparison.
INTRODUCTION :
The given models areof 2 short and long mixing tee models in which two moving fluids at different temperatures mix.
Here we are study the physics of the mixing and come with solutions that enhance that mixing.
we are given that some input datas to the start our simulation
Given Data
1.Case 1
- Short mixing tee with a hot inlet velocityof 3 m/s T-hot =36 c & T-cold=19 c
- Momentum Ratio of 2 (V-hot=3 m/s,V-cold=6 m/s)
2.Case 2
- Short mixing tee with a hot inlet velocityof 3 m/s T-hot =36 c & T-cold=19 c
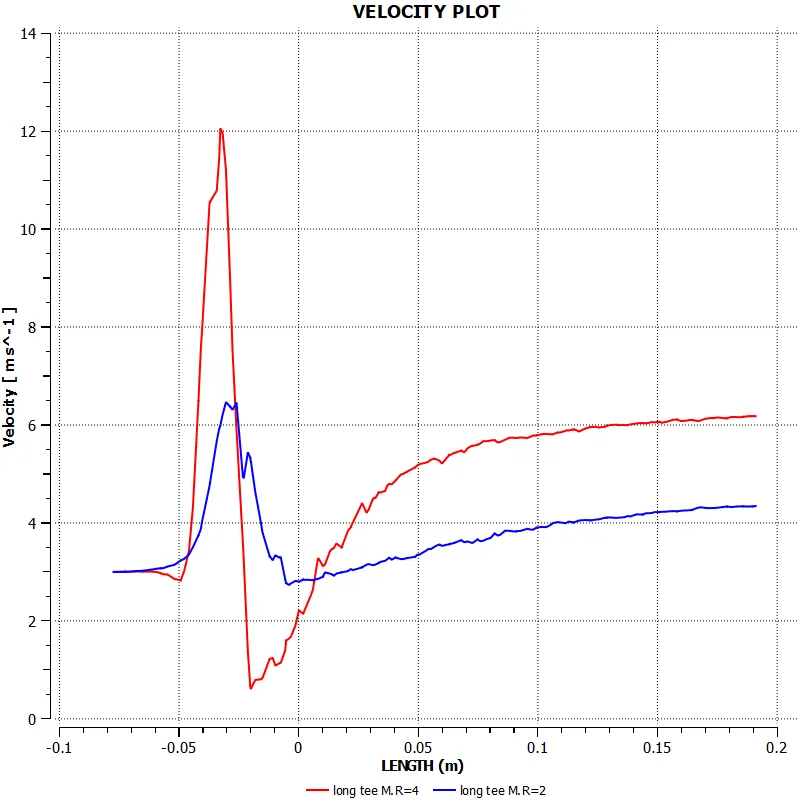
- Momentum Ratio of 4 (V-hot=3 m/s,V-cold=12 m/s)
3.Case 3
- Long mixing tee with a hot inlet velocityof 3 m/s T-hot =36 c & T-cold=19 c
- Momentum Ratio of 2(V-hot=3 m/s,V-cold=6 m/s)
4.Case 4
- Long mixing tee with a hot inlet velocityof 3 m/s T-hot =36 c & T-cold=19 c
- Momentum Ratio of 4 (V-hot=3 m/s,V-cold=12 m/s)
PREPROCESSSING AND SOLVER SETTING
Let us open the ANSYS workbench ,now opening the fluent flow (fluent)
The Fluent workflow is in series of step is
GEOMETRY > MESH > SETUP > SOLUTION > RESULTS
Let us Disuss case 1
GEOMETRY >
In the flued flow right click on the geometry and select new space claim geometry.
Open the FILE > OPEN or Drag to the Short mixing tee model from the model explorer.
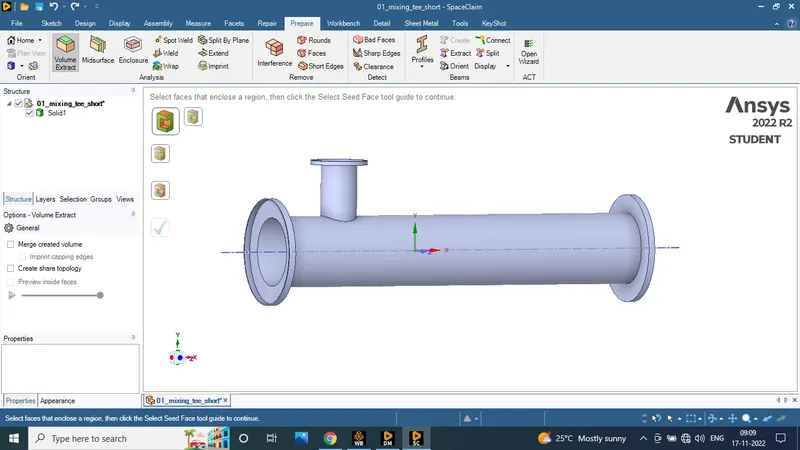
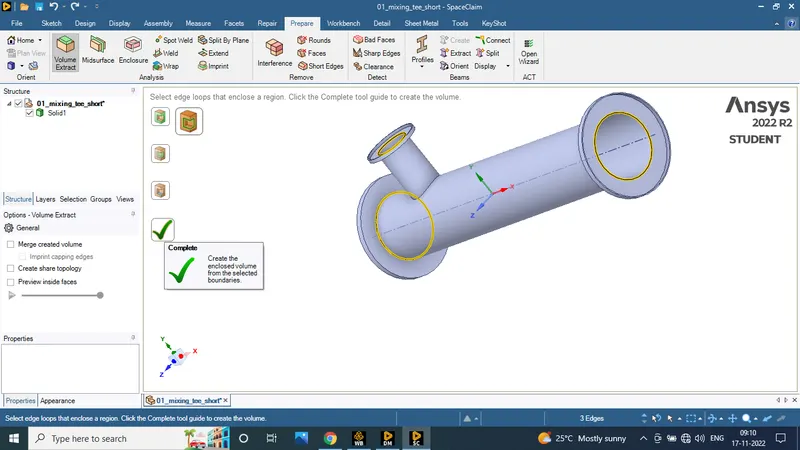
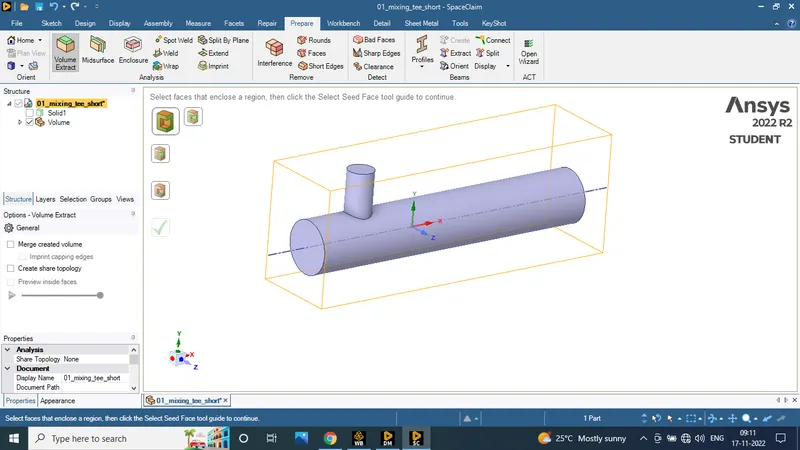
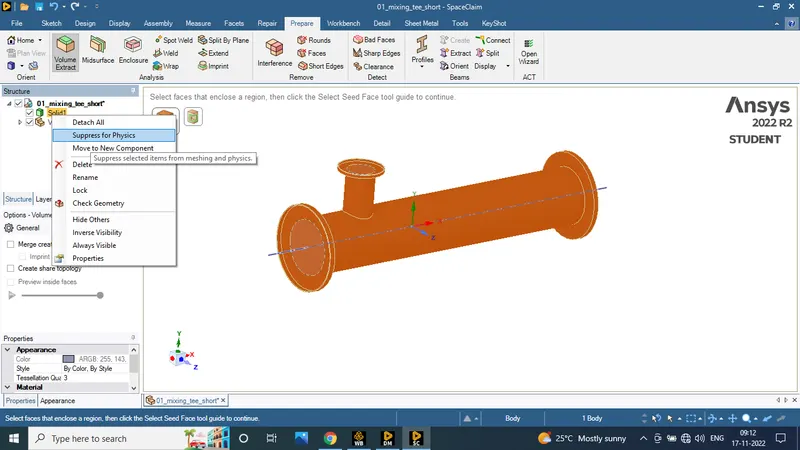
As our area inerest is the fluid volume we will extract the fluid volume using the step PREPARE > VOLUME EXTRACT > SELECT EDGES > GREEN TICK
Finaly we get the volume and we can suppress the shell element for physics by right clicking the shell
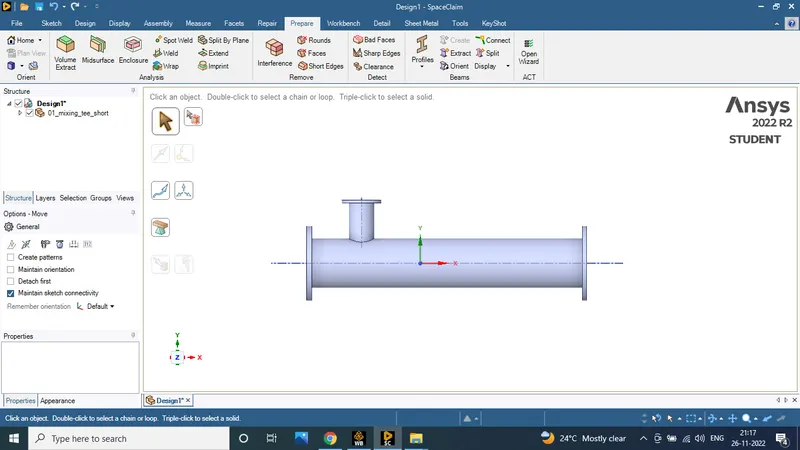
PREPARE > VOLUME EXTRACT > SELECT EDGES > GREEN TICK
MESH
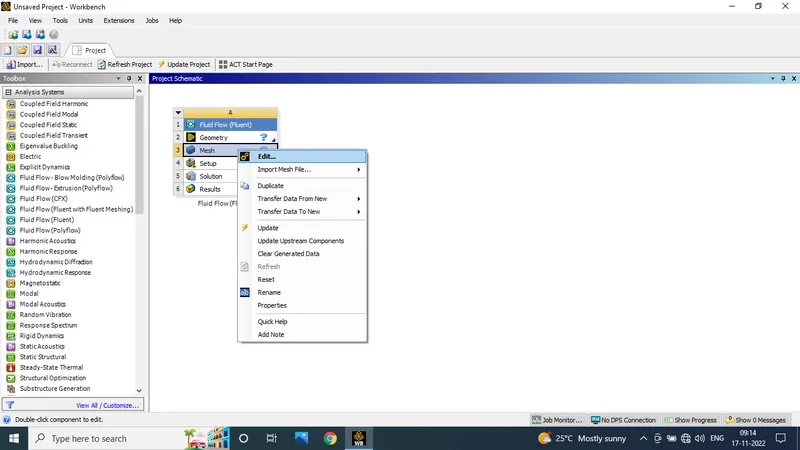
- Right click on the mesh and selecting edit option to open the mesh window
- At earlier we finished the GEOMETRY of the sample
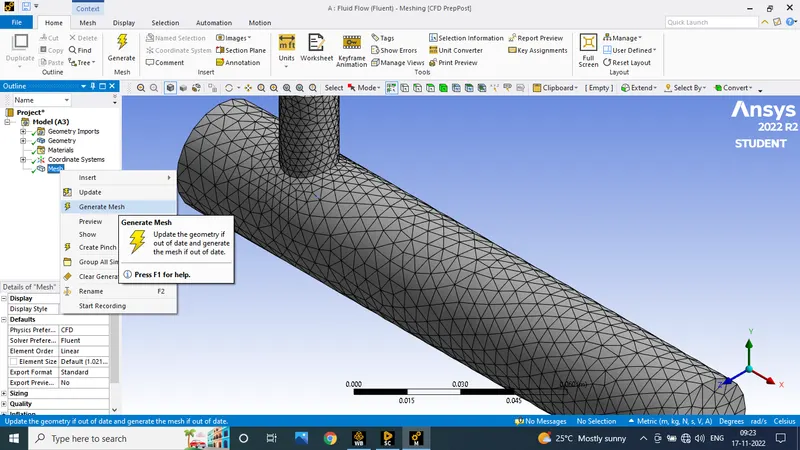
- click on the GENERATING MESH to automatically create the mesh
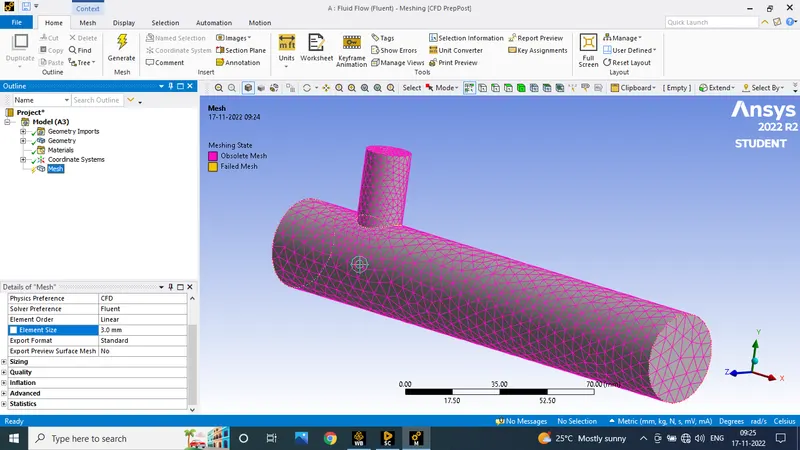
- our interest to create the mesh 3 mm using the mesh edit option
- After creating the mesh to create the name in face vice (A) INLET X,(B) INLET Y,(C) OUTLET,(D) WALL
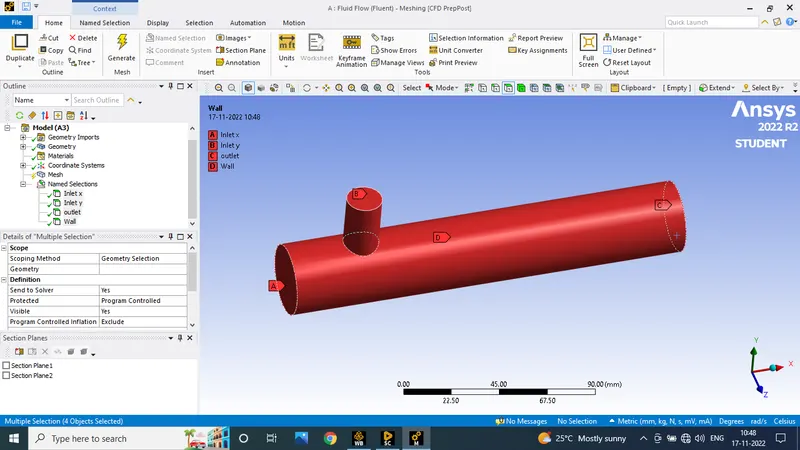
SETUP
Right Click on the setup to click the edit option.open the fluent launcher select 3D,double pricision and select the number of cores as per system conficuration
PHYSICS>ENERGY>VISCOUS>K-EPSILON (2eqn)
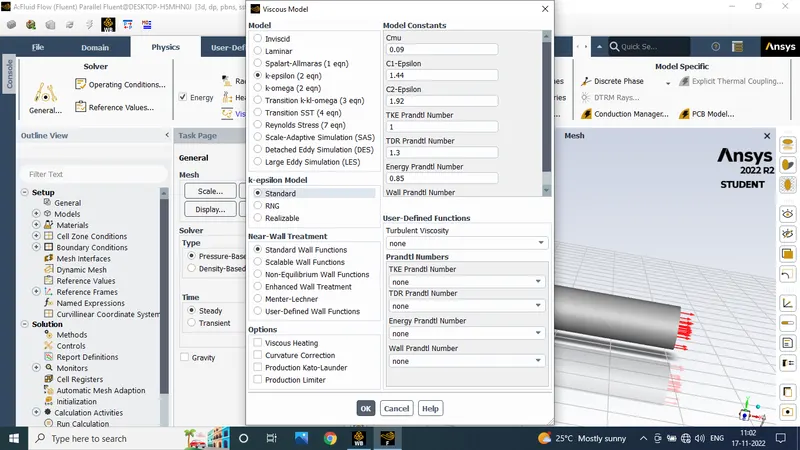
under the material we select air as default material type of material is fluid
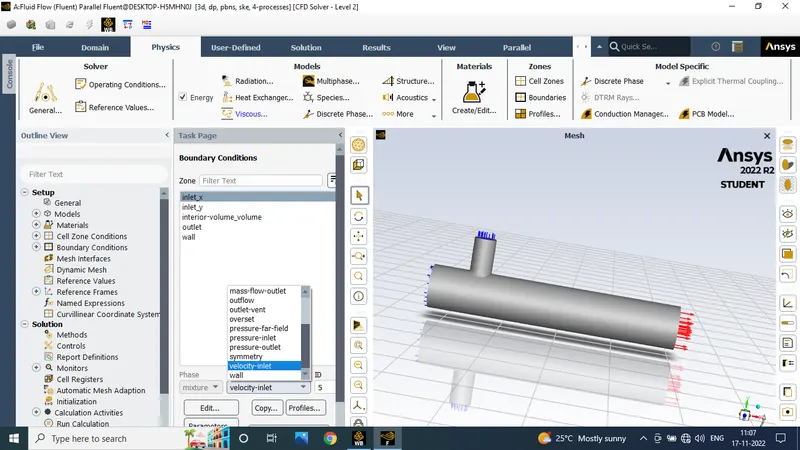
we can go to the Boundary condition as follows
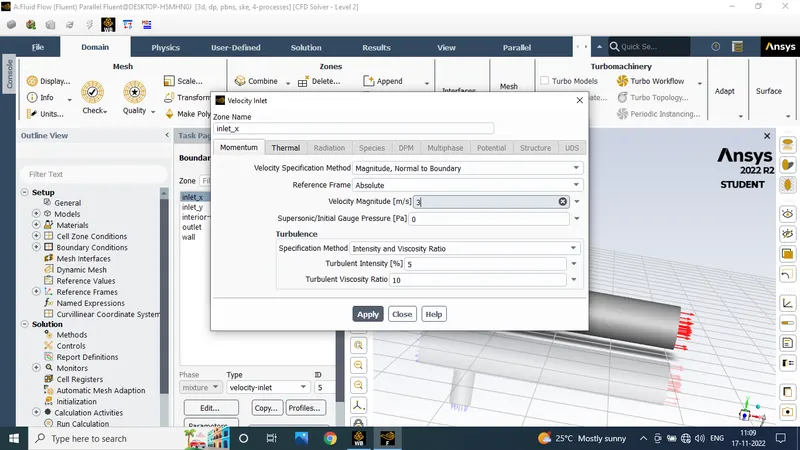
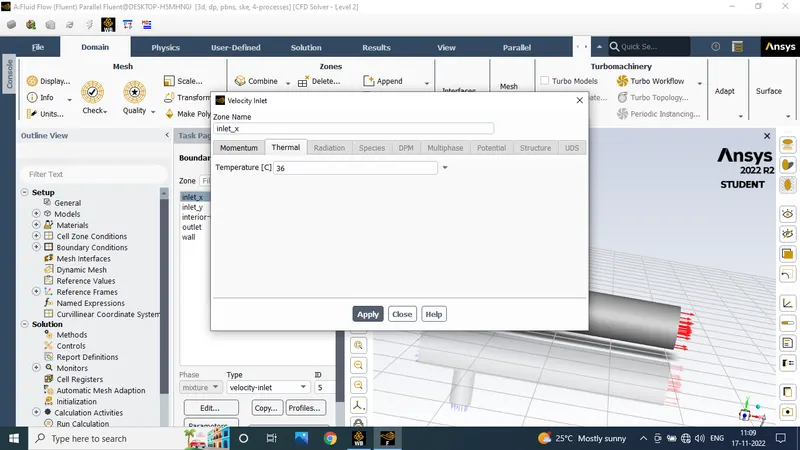
Inlet X: velocity=3 m/s and temperature = 36 c
Inlet Y: velocity=6 m/s and temperature = 19 c
Outlet: pressure outlet
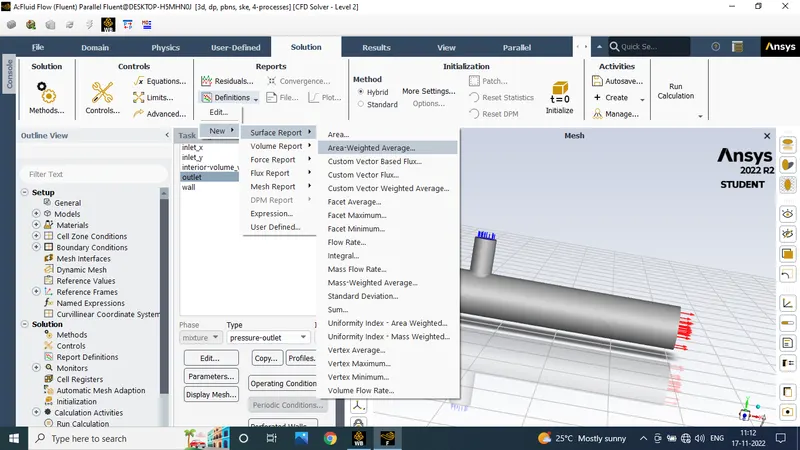
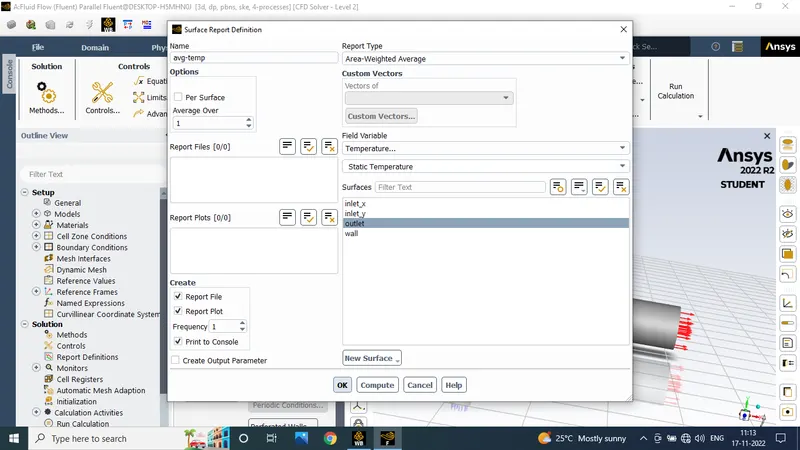
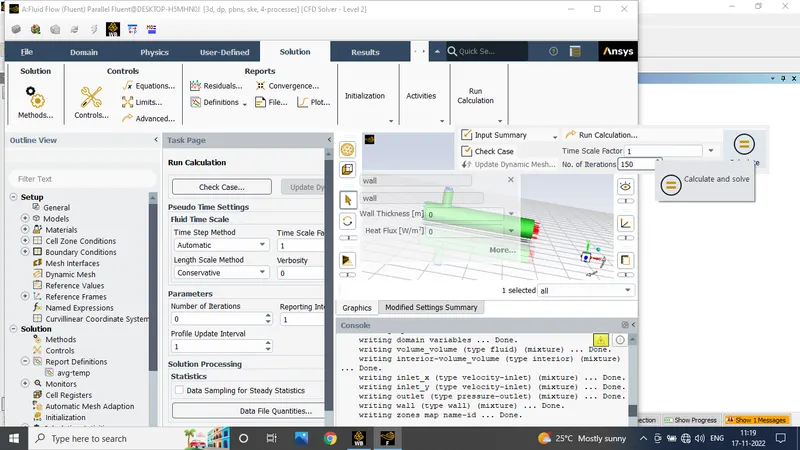
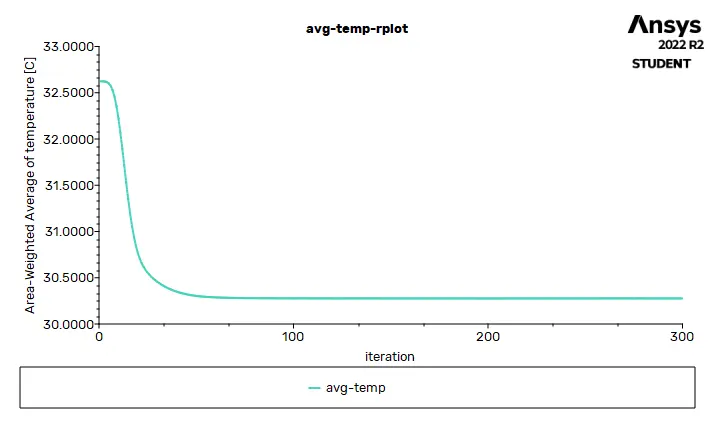
For generating the reports to click the Solution>Reports>definitions>New>Surface Report>Area weighted average for the average temperature for the outlet
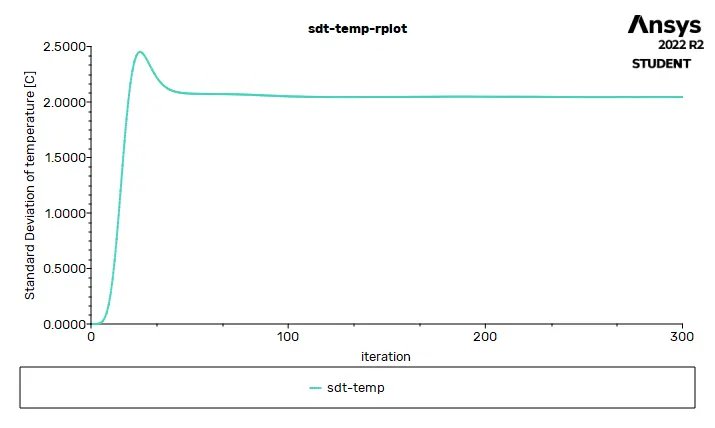
at the same folloe to find the standard temperature of the outlet
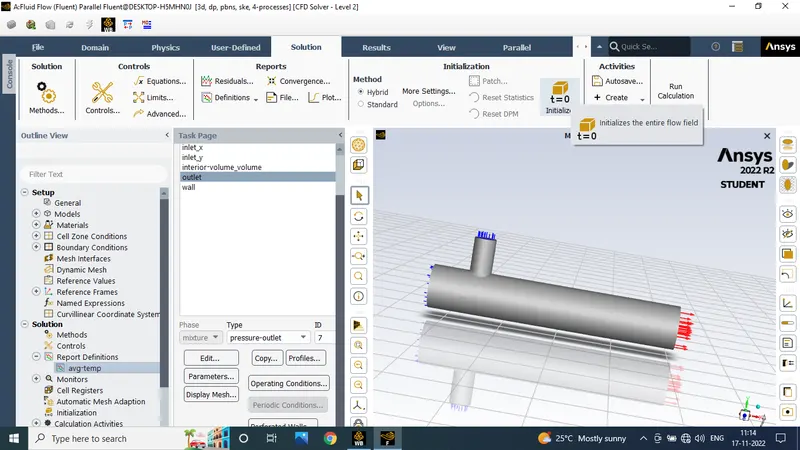
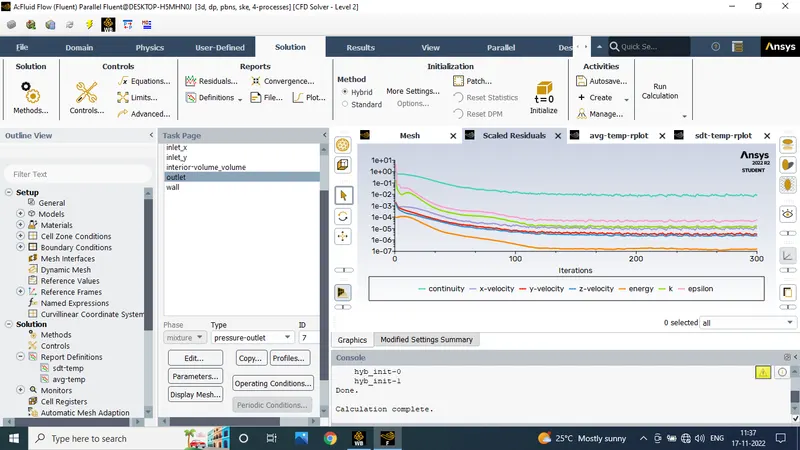
Now, before start the simulation we need to initialize the flow by click the t=0 initialize icon.In the run calculation we can input the number of iterations,(300)
Finaly we get Scaled residuals,average temperature plot and standard deviation plot.
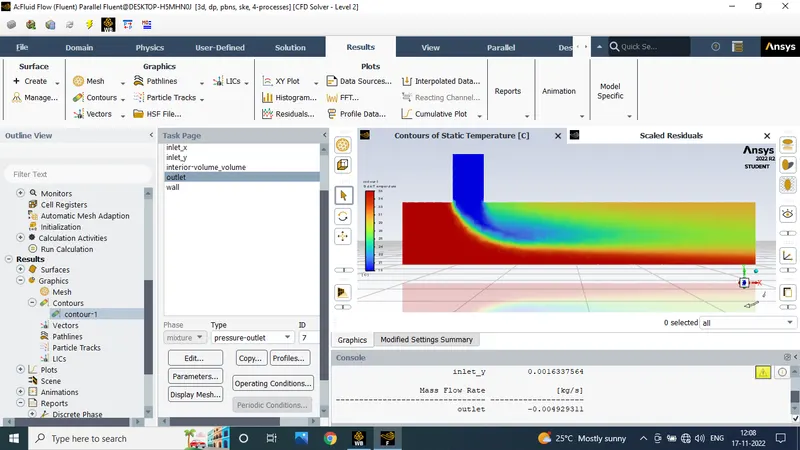
we can use the cut plane . XY plane and make the new contour in Results>Graphics>Contours>New select the cut plane to create the temperature contour and velocity contour.
RESULTS
Duoble click on the result to open the post processor
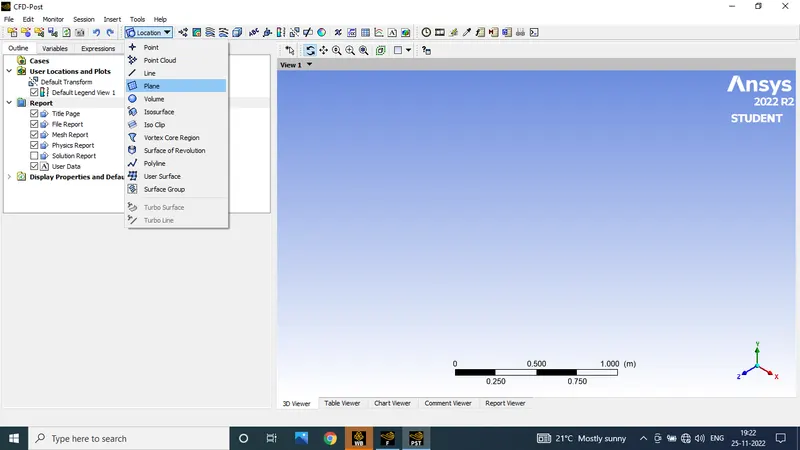
We can create the transverse section plane by Location > Plane and selecting the vector to create the vector plane
We can create a line thats cut through the axix. the line can be collect the all requirment datas
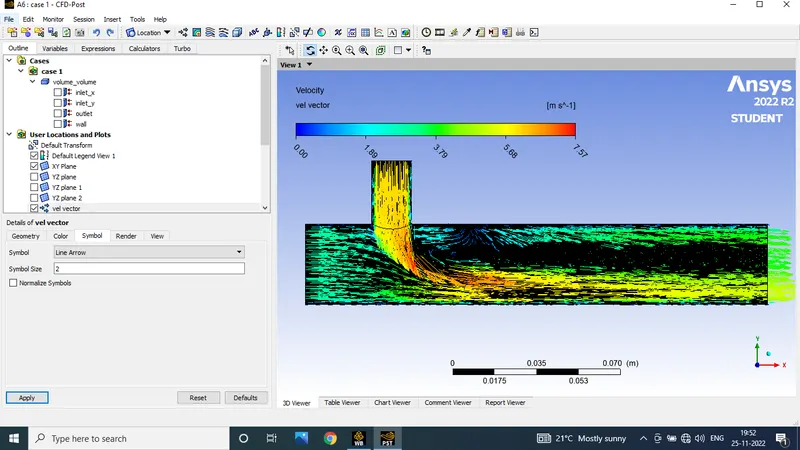
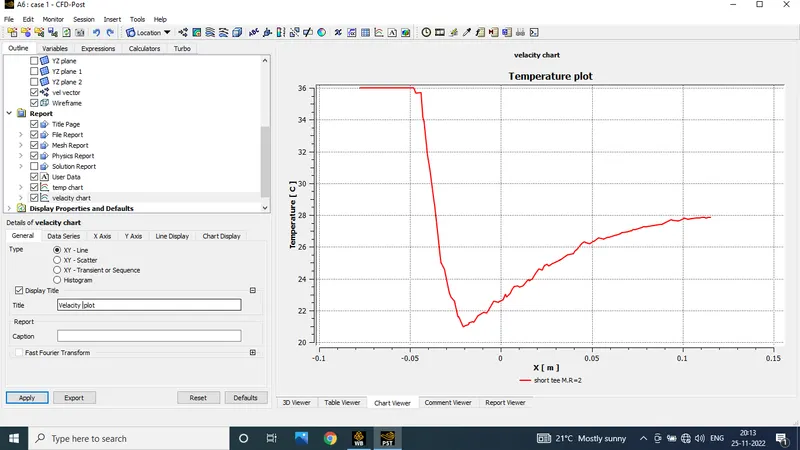
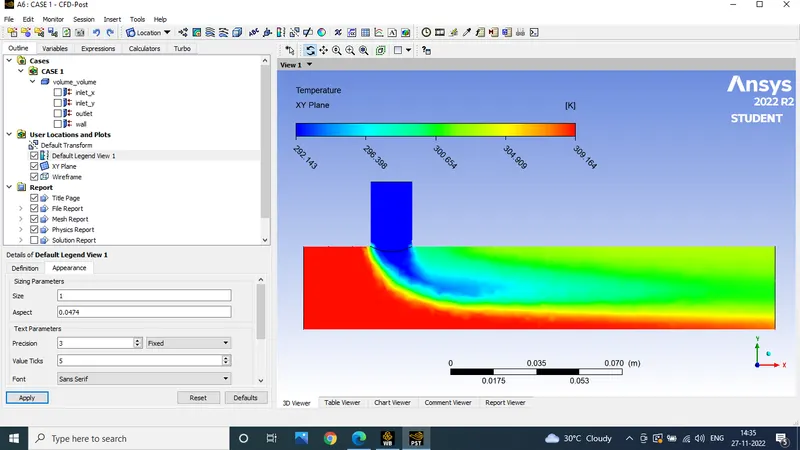
For case to Simply to DUBLICATE the entire Case 1 Fluent file. Only change the inlet Y velocity in the setup and run the simulation and gather the data like case 1.
Similarly we can follow the above steps on Case 3 and 4 for the long mixing tee
RESULTS
To repeating the similar of simulation procedures for all other cases we have find the all datas to compare study.
CONTOUR OF VELOCITY
CASE 1
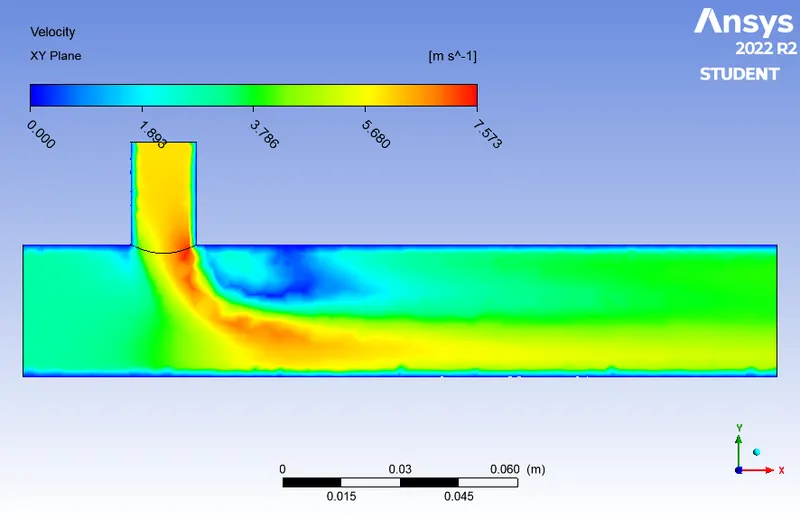
CASE 2
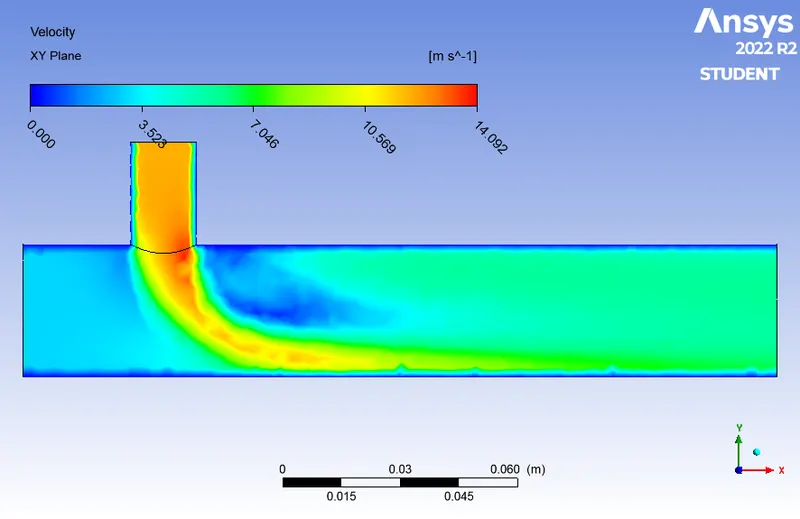
CASE 3
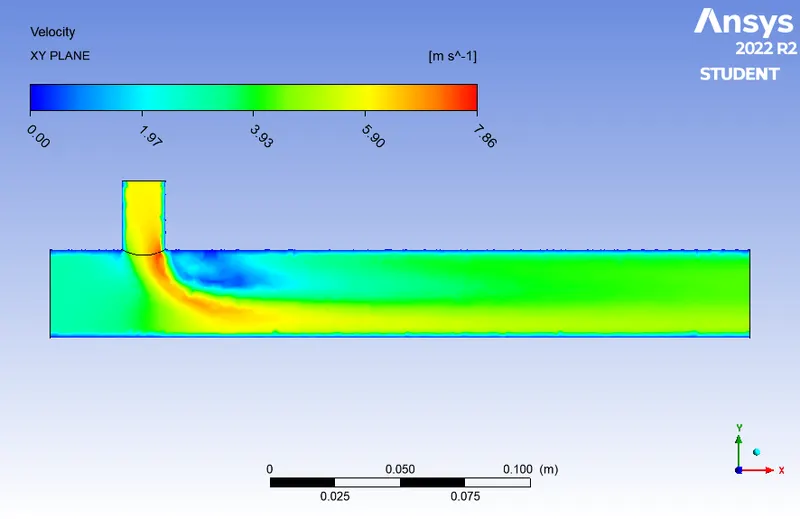
CASE 4
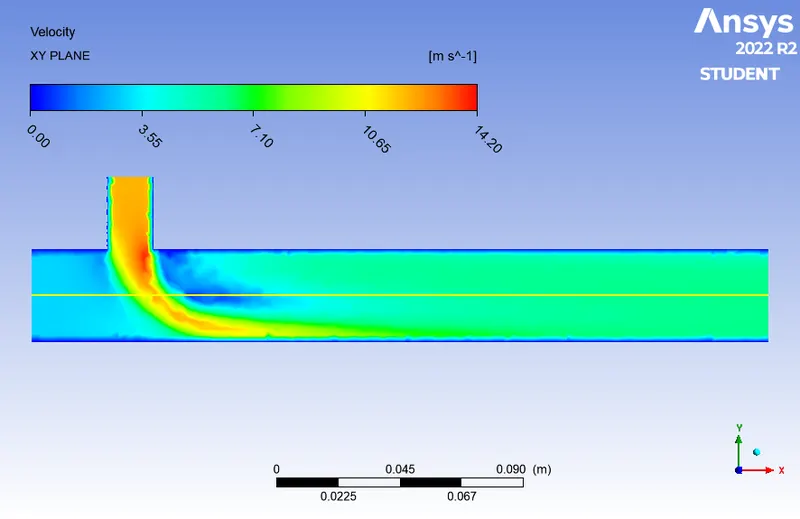
CONTOUR OF TEMPERATURE
CASE 1
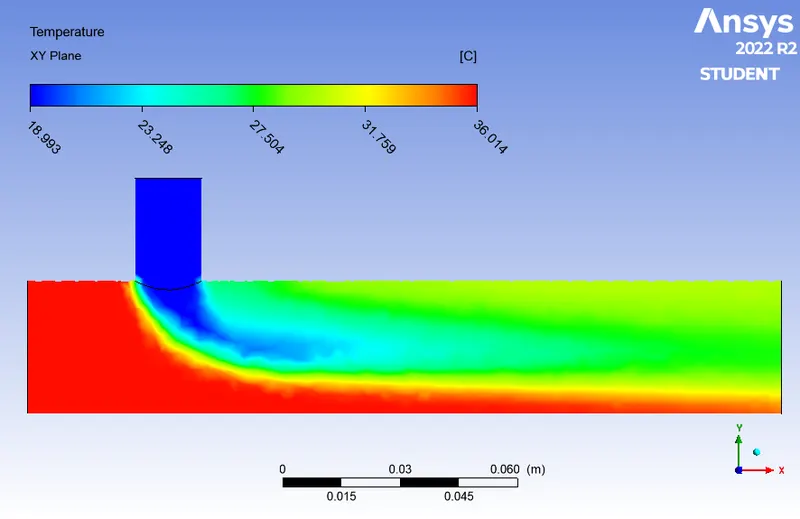
CASE 2
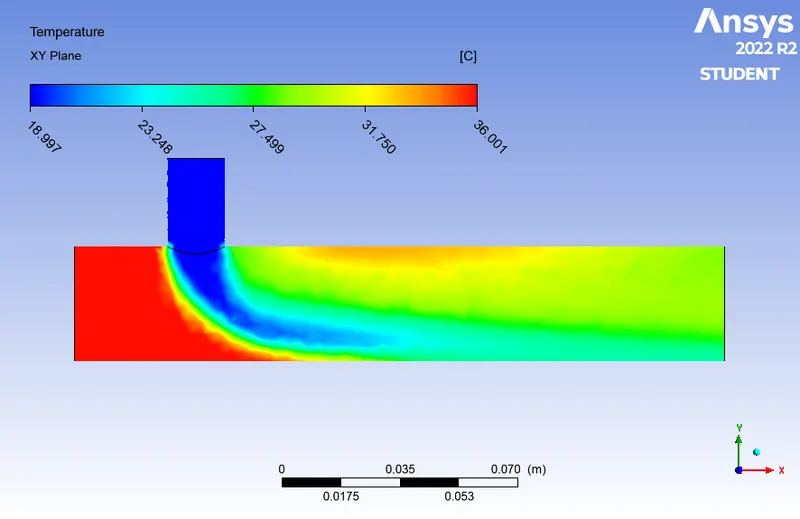
CASE 3
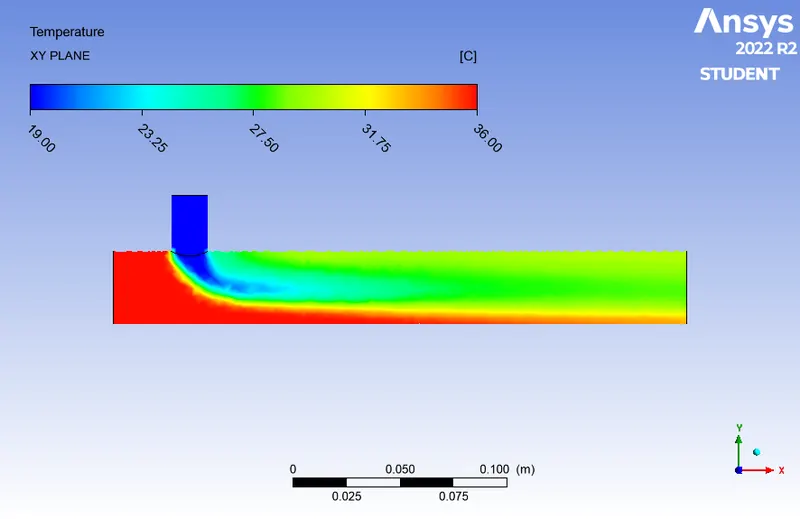
CASE 4
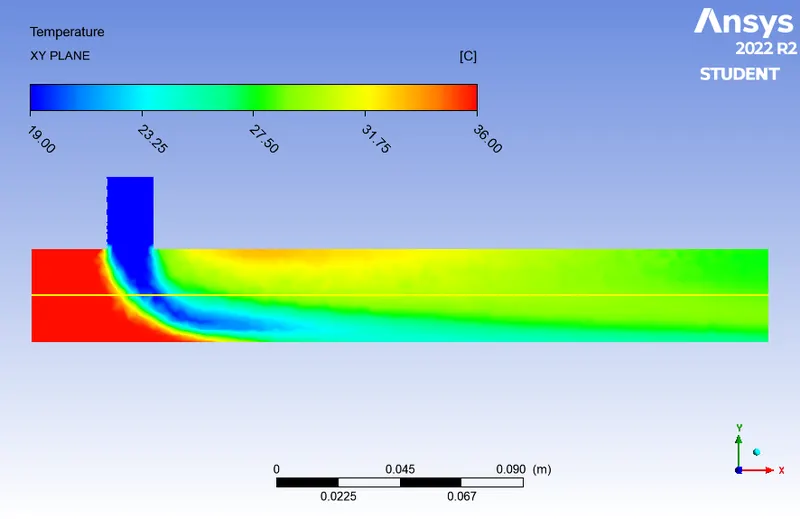
VELOCITY VECTORS
CASE 1
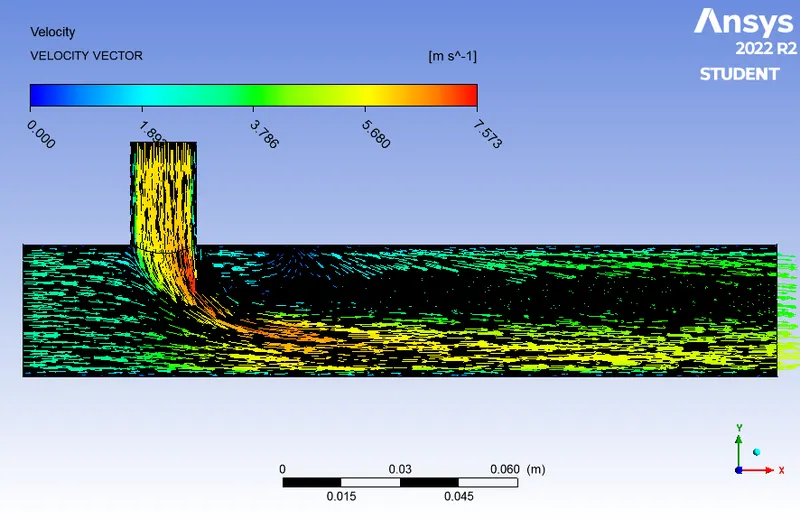
CASE 2
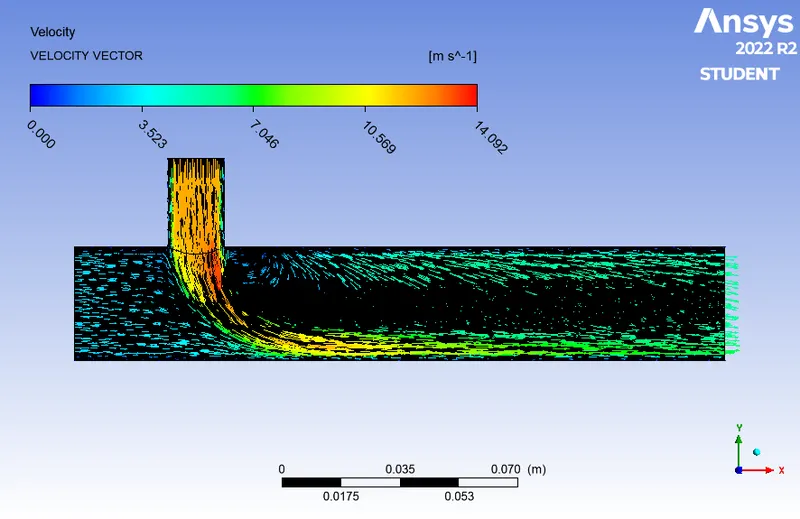
CASE 3
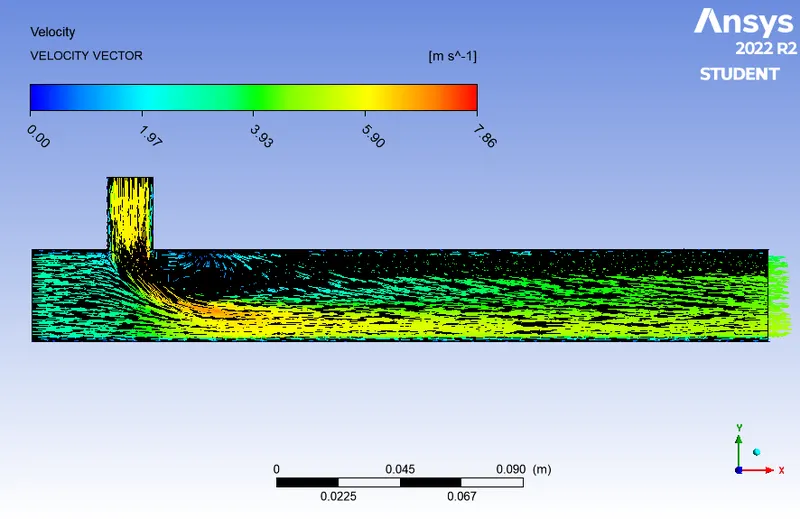
CASE 4
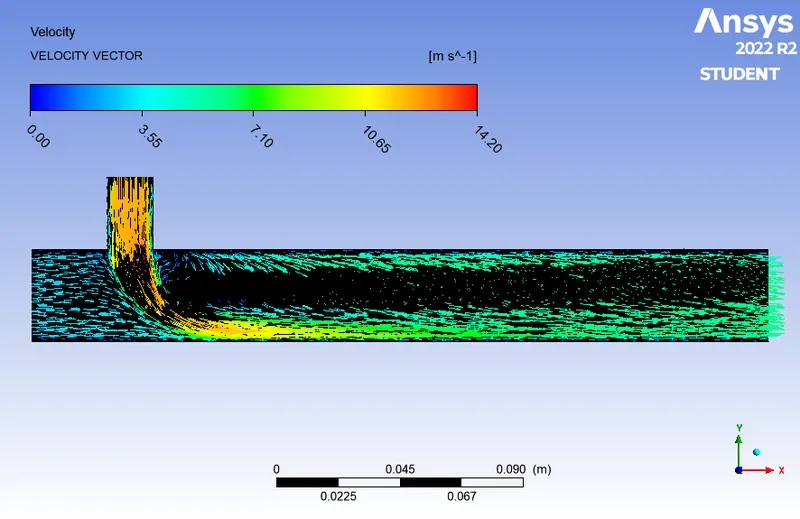
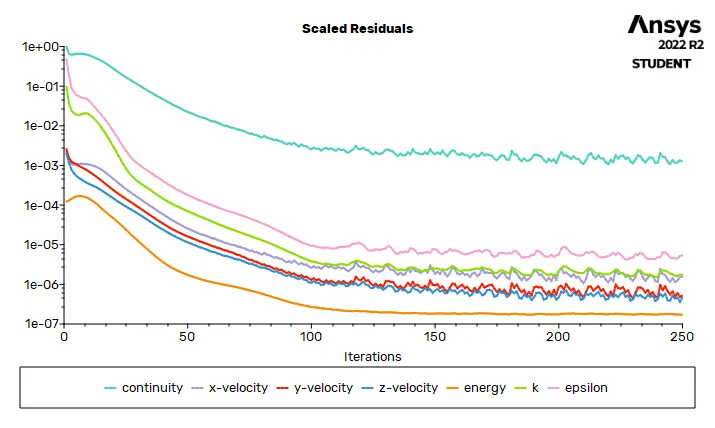
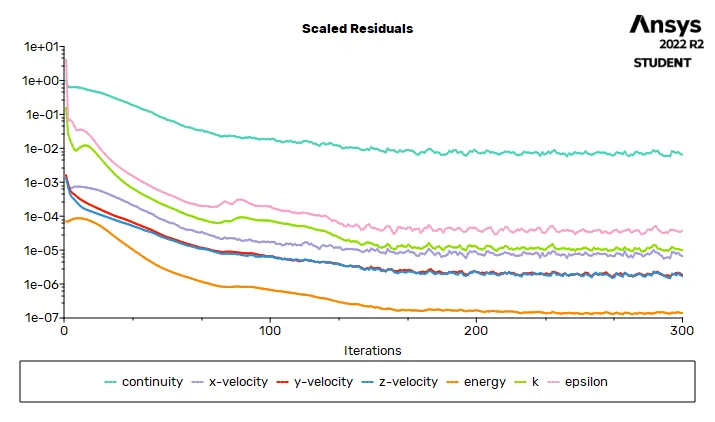
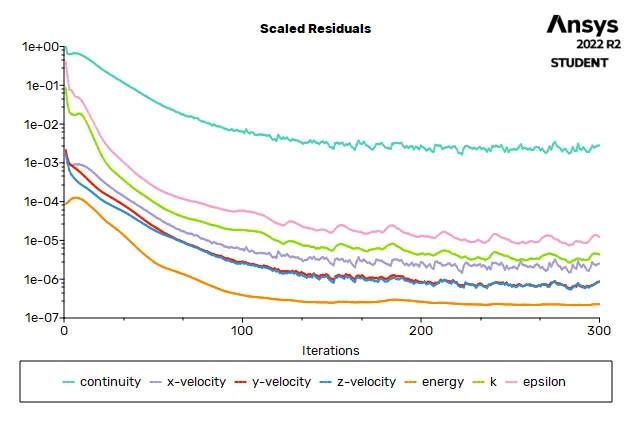
RESIDUALS
CASE 1
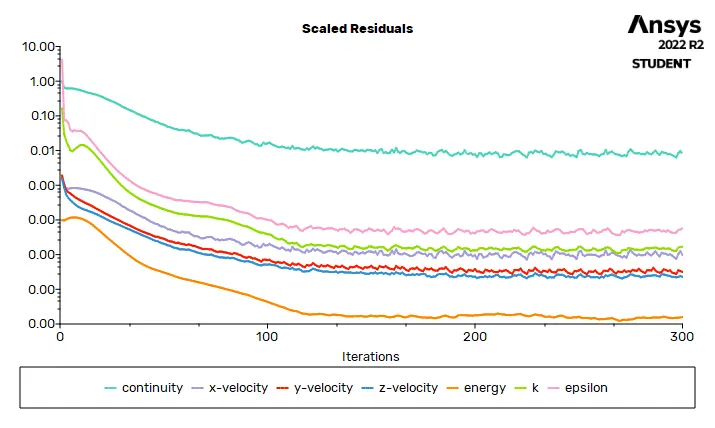
CASE 2
CASE 3
CASE 4
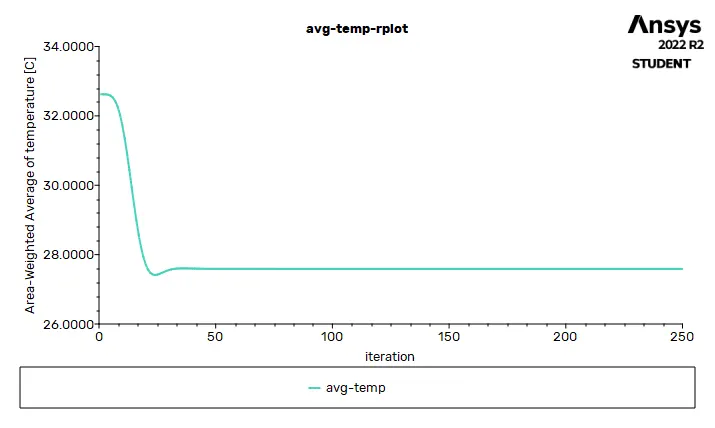
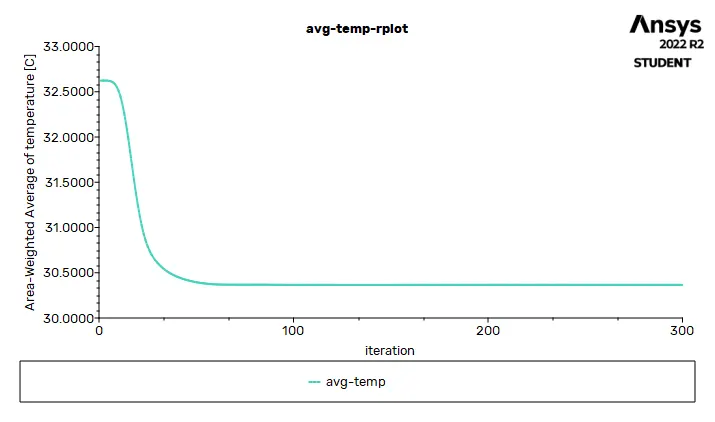
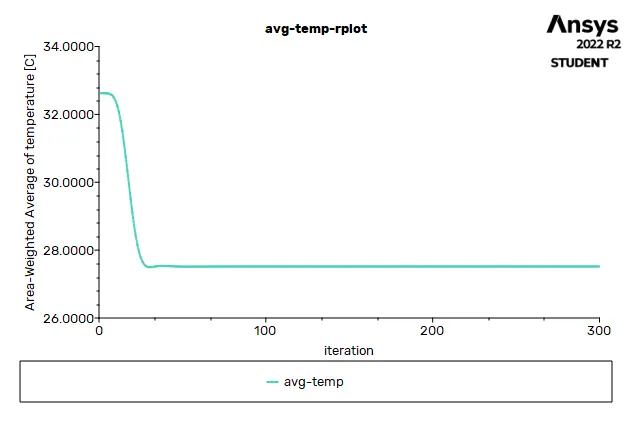
AVERAGE TEMPERATURE PLOT
CASE 1
CASE 2
CASE 3
CASE 4
STANDARD TEMPERATURE PLOT
CASE 1
CASE 2
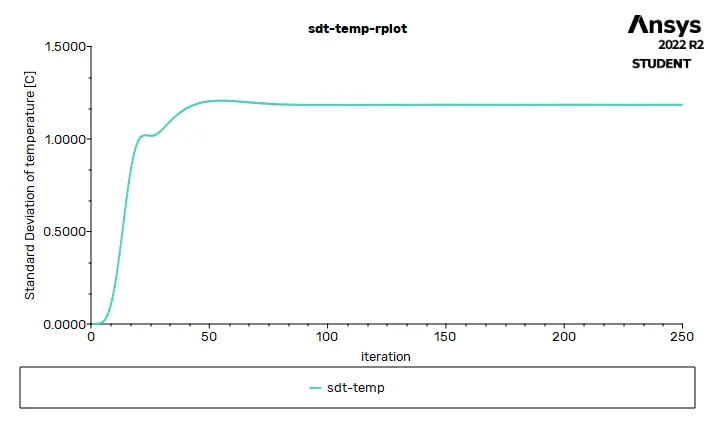
CASE 3
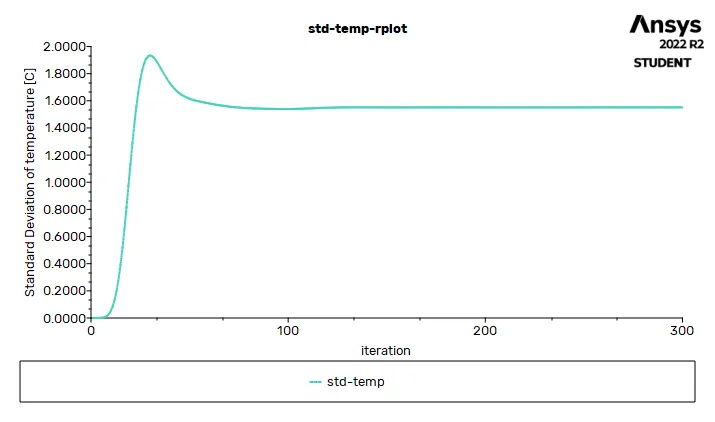
CASE 4
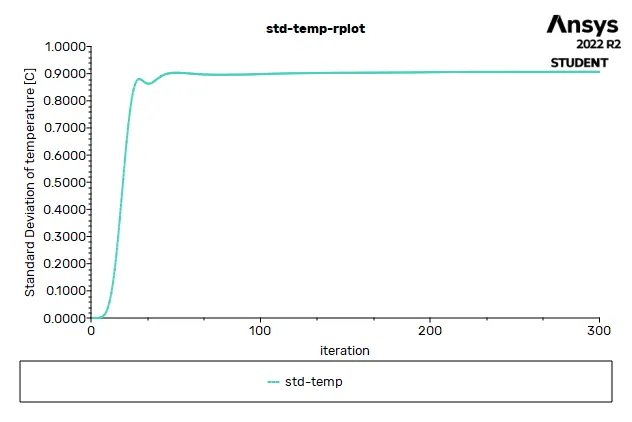
LEANGTH VS TEMPERATURE PLOT
CASE 1
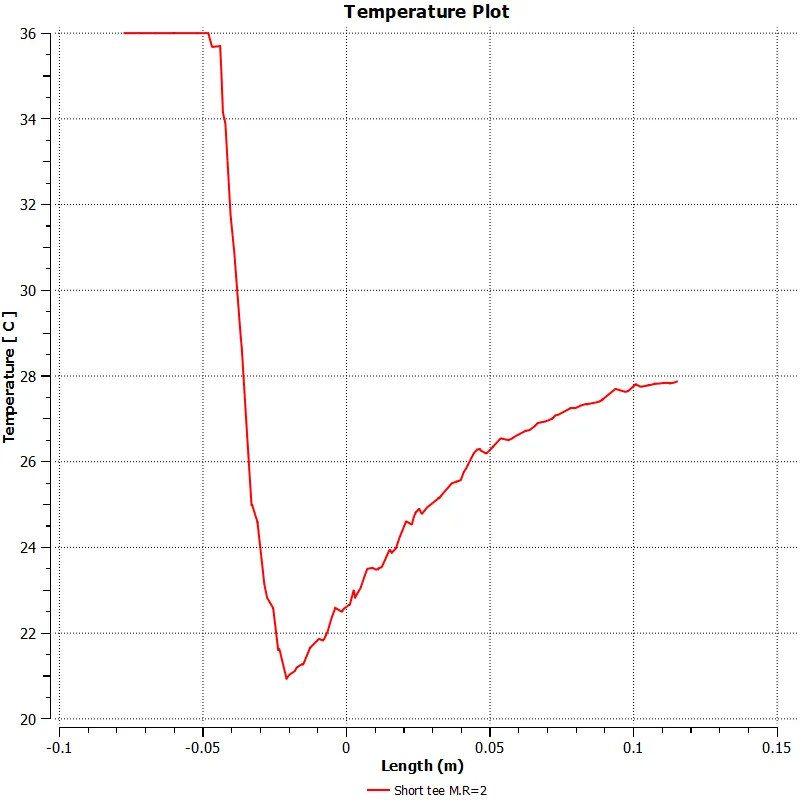
CASE 2
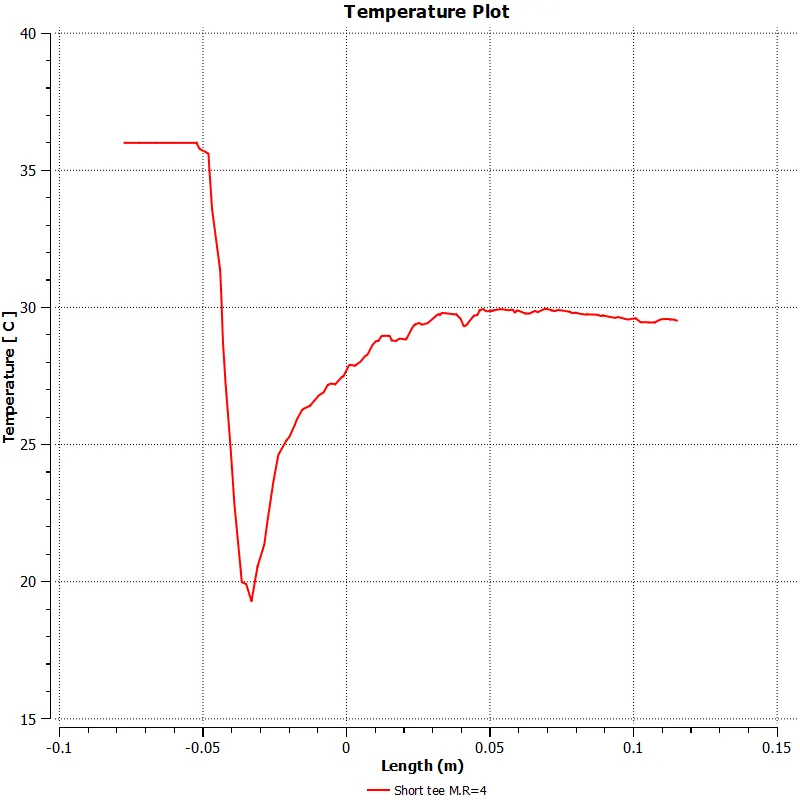
CASE 3
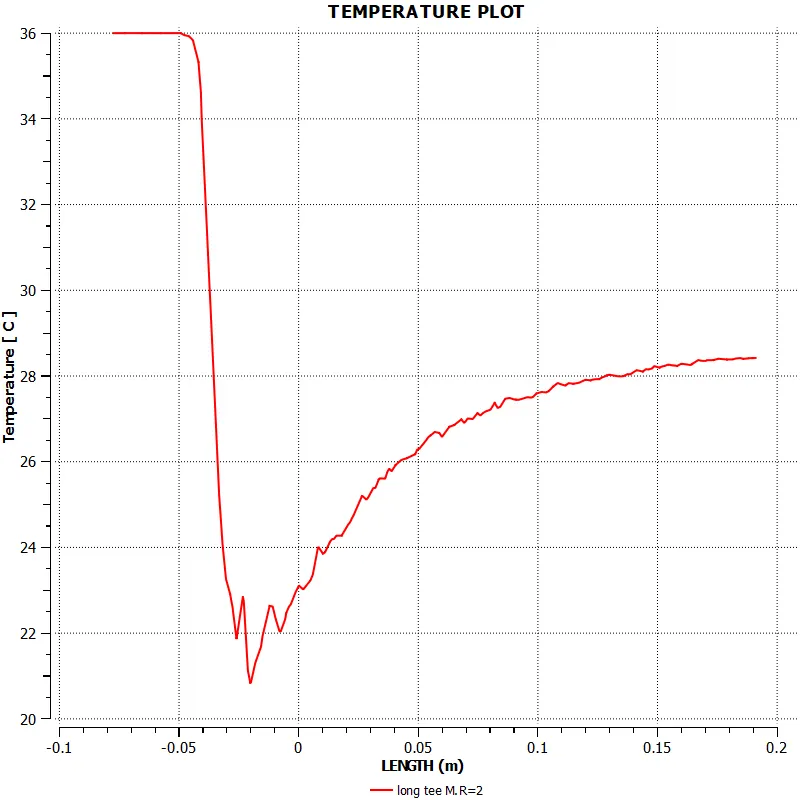
CASE 4
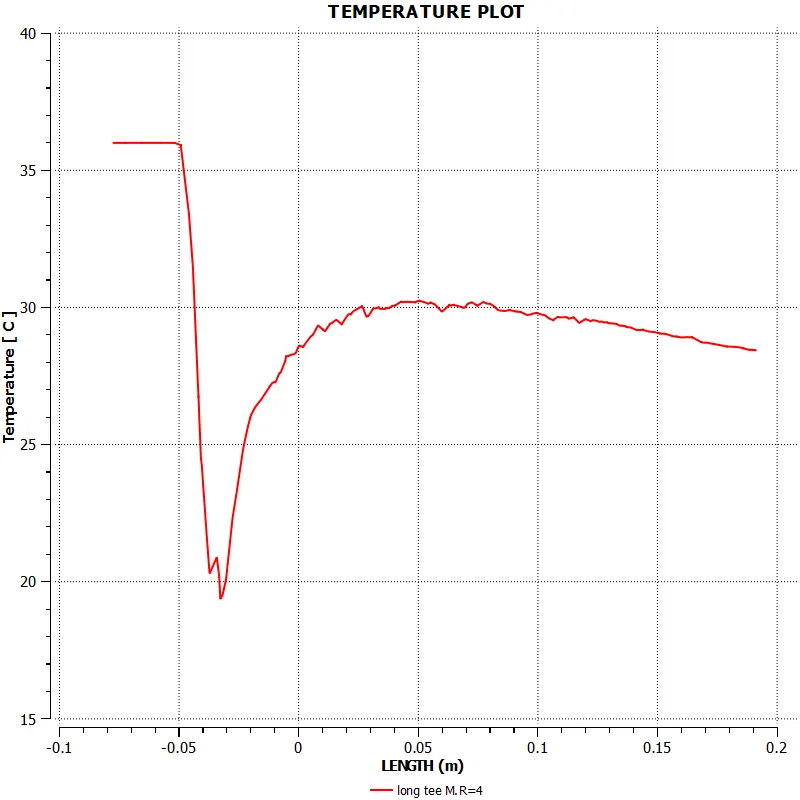
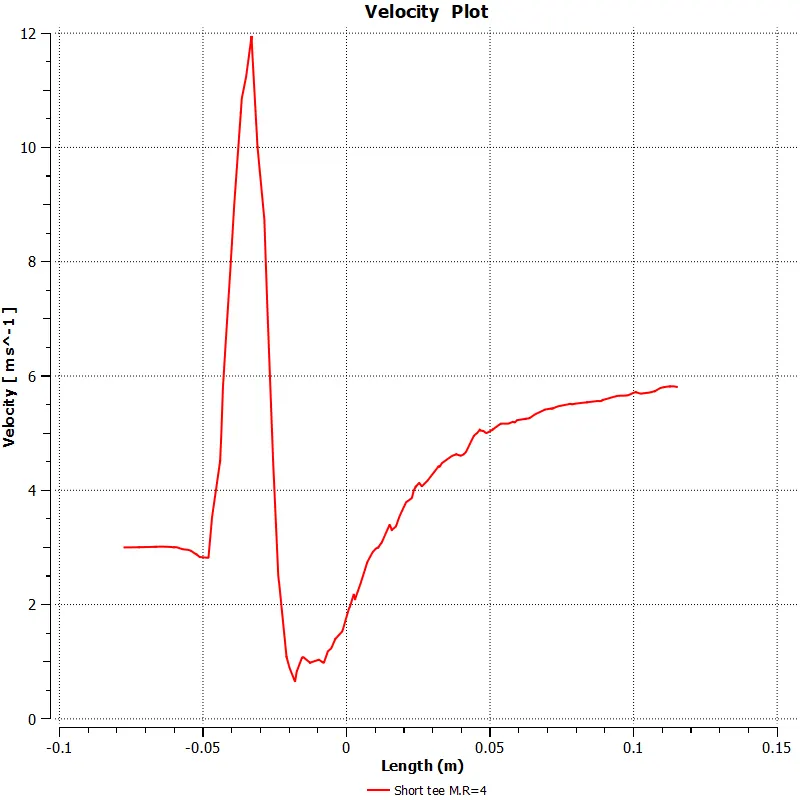
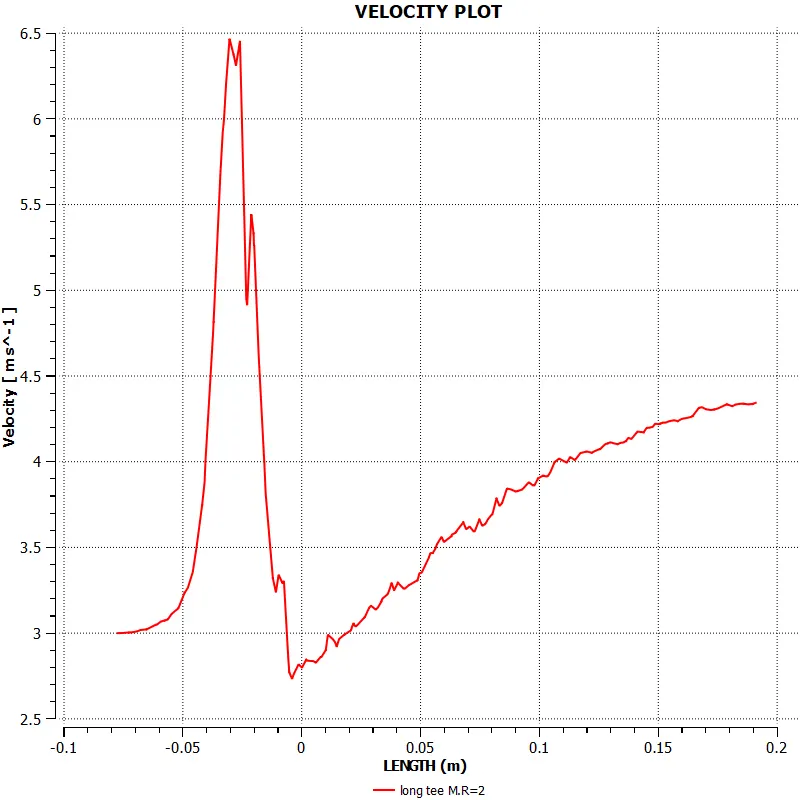
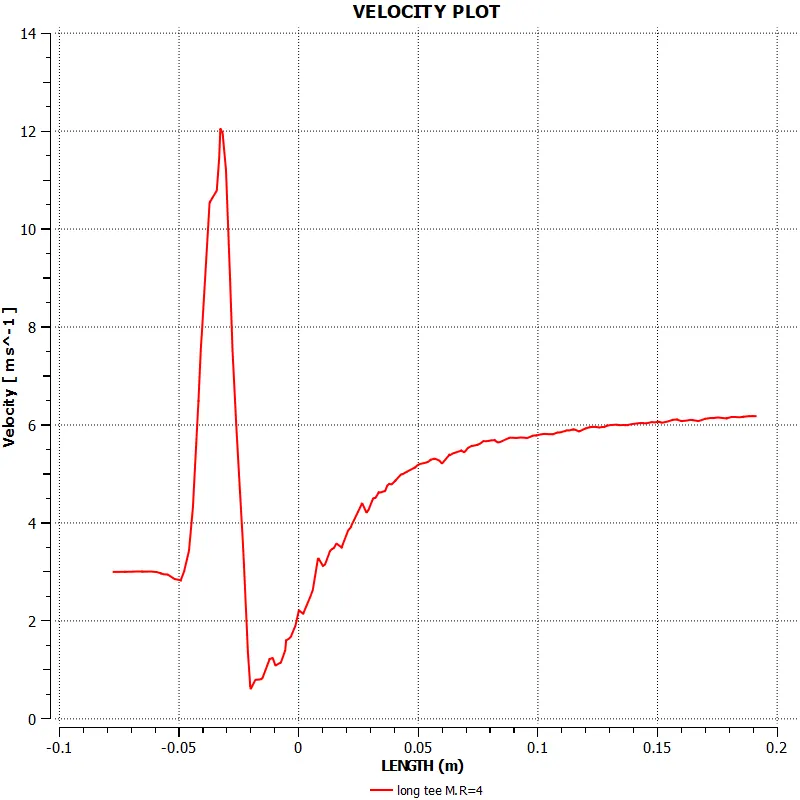
LENGTH VS VELOCITY PLOT
CASE 1
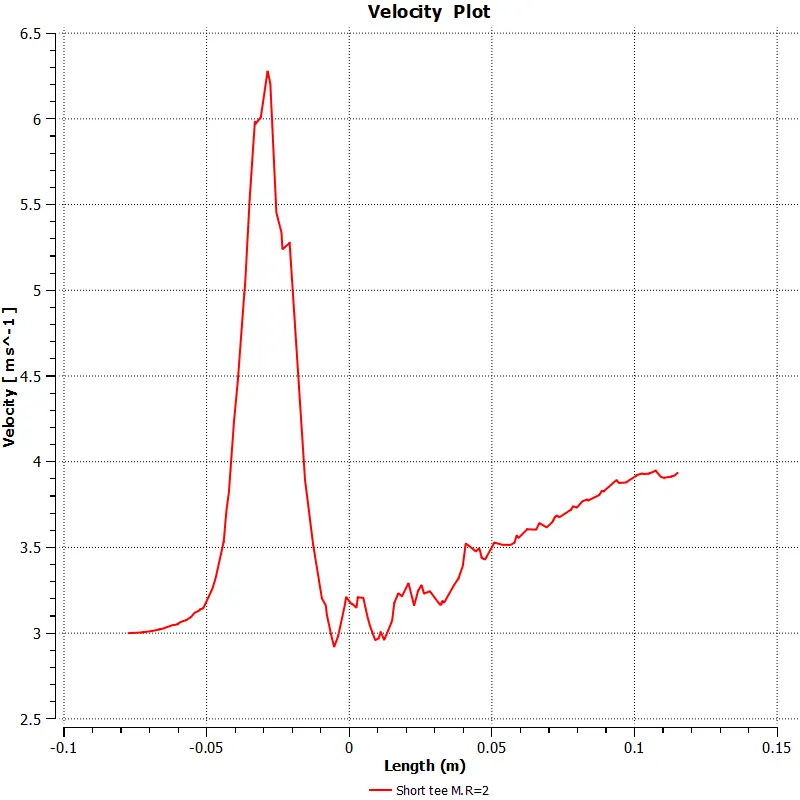
CASE 2
CASE 3
CASE 4
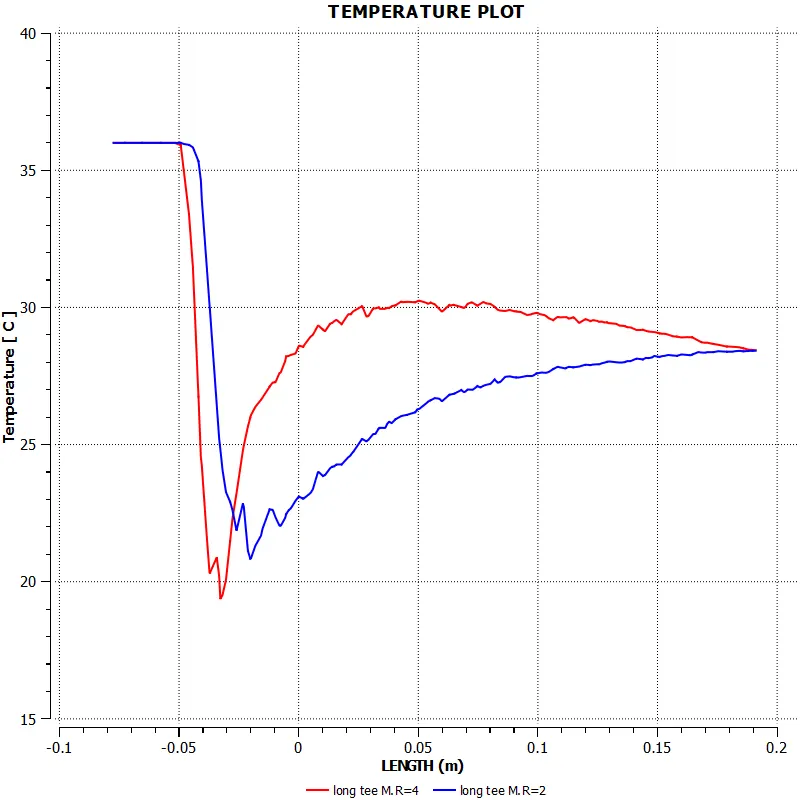
TEMPERATUREN & VELOCITY PLOT COMPARISON FOR SHORT TEE M.R 2 & 4
CASE 1 & CASE 2 TEMP PLOT COMPARISON
CASE 1 & CASE 2 VELOCITY PLOT COMPARISON
CASE 3 & CASE 4 TEMPERATURE PLOT COMPARISON
CASE 3 & CASE 4 VELOCITY PLOT COMPARISON
CONCLUSION
We get the all 4 cases and its comparisons vizualy from the graph and contours.
mesh count for short tee = 40087
long tee = 56935
Avg out let temp case 1 = 30.29
case 2 = 27.58
case 3 = 30.35
case 4 = 27.52
almost all cases are length vise no difference observed in all cases nearly 130 to 150 iterations convergent was founded so
case 2 the momentum ratio 2 and Nos iterations is 129 that case is best in my knowledge