Project 1 - Parsing NASA thermodynamic data
FILE PARSING
PROGRAM
clear all
close all
clc

%% open the dat file and read

f = fopen("THERMO.dat","r")

%% SKIPING THE 1 ST 5 LINES
for o=1:5
    fgetl(f);
end

%% parcing of all the species from the file

for i=1:53

    %% first line of the first species  "o"
    a=fgetl(f)

    %% splitting the string
    b=strsplit(a," ");

    speciesname=b{1};

    %% position of low ,high and mid temp
    Z = length(b);

    %% extracting the local temp
    low_temp=str2double(b{Z-3});
    high_temp=str2double(b{Z-2});
    mid_temp=str2double(b{Z-1});

    %% extracting the coefficinet
    %% line 1
    co_line1=fgetl(f);

    %% finding the positions of E in line 1

    pos_e1=strfind(co_line1,"E");

    %% ALL COEFFICIENTS OF LINE 1
    a1=str2double(co_line1(1:pos_e1(1)+3));
    a2=str2double(co_line1(pos_e1(1)+4:pos_e1(2)+3));
    a3=str2double(co_line1(pos_e1(2)+4:pos_e1(3)+3));
    a4=str2double(co_line1(pos_e1(3)+4:pos_e1(4)+3));
    a5=str2double(co_line1(pos_e1(4)+4:pos_e1(5)+3));


  %% line 2
  co_line2=fgetl(f);

  %% finding the positions of E in line 2

  pos_e2=strfind(co_line2,"E");

  %% ALL COEFFICIENTS OF LINE 2
    a6=str2double(co_line2(1:pos_e2(1)+3));
    a7=str2double(co_line2(pos_e2(1)+4:pos_e2(2)+3));
    a8=str2double(co_line2(pos_e2(2)+4:pos_e2(3)+3));
    a9=str2double(co_line2(pos_e2(3)+4:pos_e2(4)+3));
    a10=str2double(co_line2(pos_e2(4)+4:pos_e2(5)+3));

  %% line 3
  co_line3=fgetl(f);

  %% finding the positions of E in line 3

  pos_e3=strfind(co_line3,"E");

  %% ALL COEFFICIENTS OF LINE 3
    a11=str2double(co_line3(1:pos_e3(1)+3));
    a12=str2double(co_line3(pos_e3(1)+4:pos_e3(2)+3));
    a13=str2double(co_line3(pos_e3(2)+4:pos_e3(3)+3));
    a14=str2double(co_line3(pos_e3(3)+4:pos_e3(4)+3));


 %% save the species in the folder
 mkdir(['C:\Users\ADMIN\Documents\MATLAB\species\',speciesname]);

 %% universal gas constant(R)

R= 8.3144598;

%%  calculating specific heat ,entropy and enthalpy
%% a1-a7 high temp co_effi , a8-a14 low temp co_effi

T=linspace(low_temp,high_temp,1000);

for k = 1:length(T)
    if T(k)>mid_temp

        %% high temp co_effi
        Cp(k)=(a1+a2*T(k)+a3*T(k)^2+a4*T(k)^3+a5*T(k)^4)*R;
        H(k)=(a1+(a2*T(k))/2+(a3*T(k)^2)/3+(a4*T(k)^3)/4+(a5*T(k)^4)/5+a6/T(k))*R*T(k);
        S(k)=(a1*log(T(k))+a2*T(k)+(a3*T(k)^2)/2+(a4*T(k)^3)/3+(a5*T(k)^4)/4+a7)*R;

    else
        %% low temp coeffi

        Cp(k)=(a8+a9*T(k)+a10*T(k)^2+a11*T(k)^3+a12*T(k)^4)*R;
        H(k)=(a8+(a9*T(k))/2+(a10*T(k)^2)/3+(a11*T(k)^3)/4+(a12*T(k)^4)/5+a13/T(k))*R*T(k);
        S(k)=(a8*log(T(k))+a9*T(k)+(a10*T(k)^2)/2+(a11*T(k)^3)/3+(a12*T(k)^4)/4+a14)*R;

    end
end
%% saving the file in the folder

cd(['C:\Users\ADMIN\Documents\MATLAB\species\',speciesname]);

%% plotting

figure(1);
plot(T,Cp,"LineWidth",3,"color","g");
xlabel("temperature");
ylabel("specific heat");
title("species name",speciesname);
legend("Temperature vs specific heat");
grid on;
saveas(1,"specific heat","jpg");

figure(2);
plot(T,H,"LineWidth",3,"color","g");
xlabel("temperature");
ylabel("Entropy");
title("species name",speciesname);
legend("Temperature vs entropy");
grid on;
saveas(2,"Entropy","jpg");

figure(3);
plot(T,S,"LineWidth",3,"color","g");
xlabel("temperature");
ylabel("Enthalpy");
title("species name",speciesname);
legend("Temperature vs Enthalpy");
grid on;
saveas(3,"Enthalpy","jpg");


%% calculating the molecular weight
 elements = ['H','C','N','O','A'];
 Atomic_weight =[1.0079,12.0107,14.0067,15.999,39.948];
 mol_mass=0;

 for l=1:length(speciesname)
     for m=1:length(Atomic_weight)
         if strcmp(speciesname(l),elements(m))
             mol_mass=mol_mass+Atomic_weight(m);
             position=m;
         end
     end
     n=str2double(speciesname(l));
     if n>1
        mol_mass=mol_mass+Atomic_weight(position)*(n-1);
     end
 end
 sprintf('molecular weight of %s is %f',speciesname,mol_mass)
end
fclose(f)
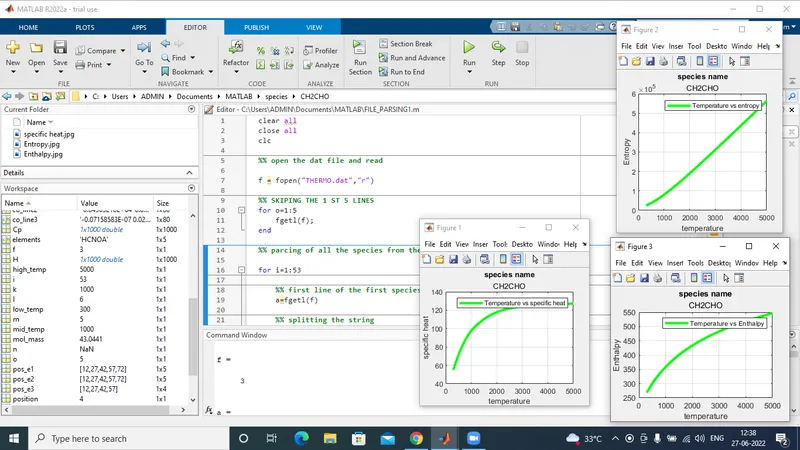
SCREEN SHOT ABOUT THE PROGRAM
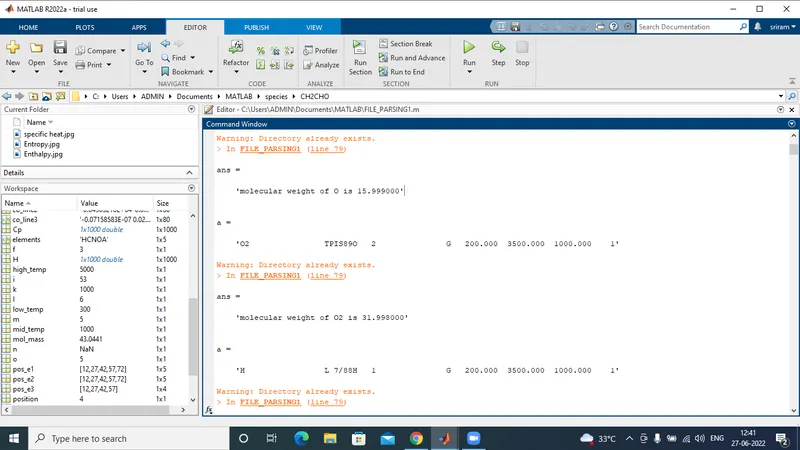
MOLECULAR WEIGHT (SCREEN SHOT FOR COMMAND WINDOW)
SPECIES FOLDERS (53)

PLOT FOR SPECIES
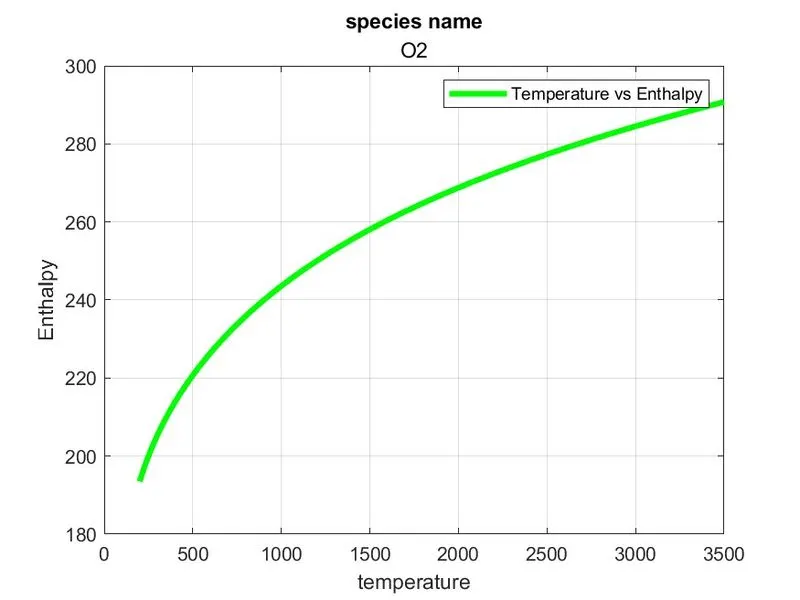
ENTHALPY PLOT FOR O2
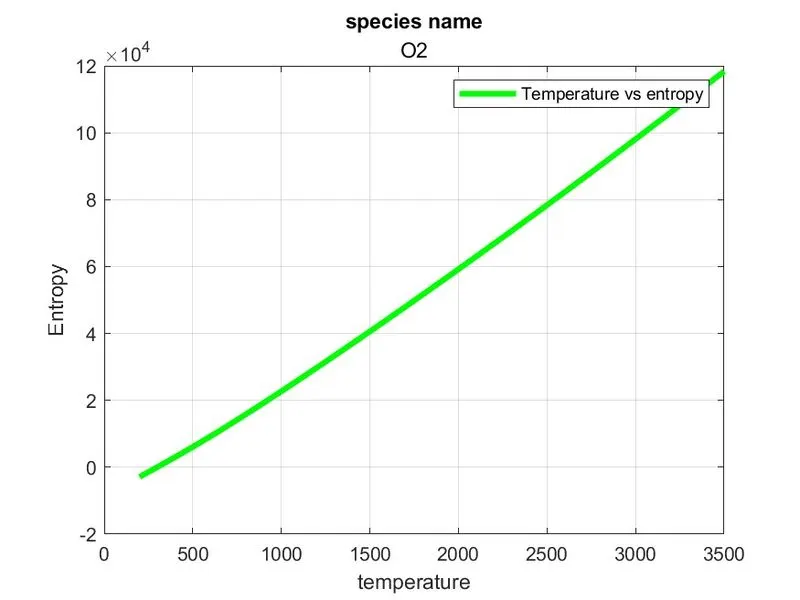
ENTROPY PLOT FOR O2
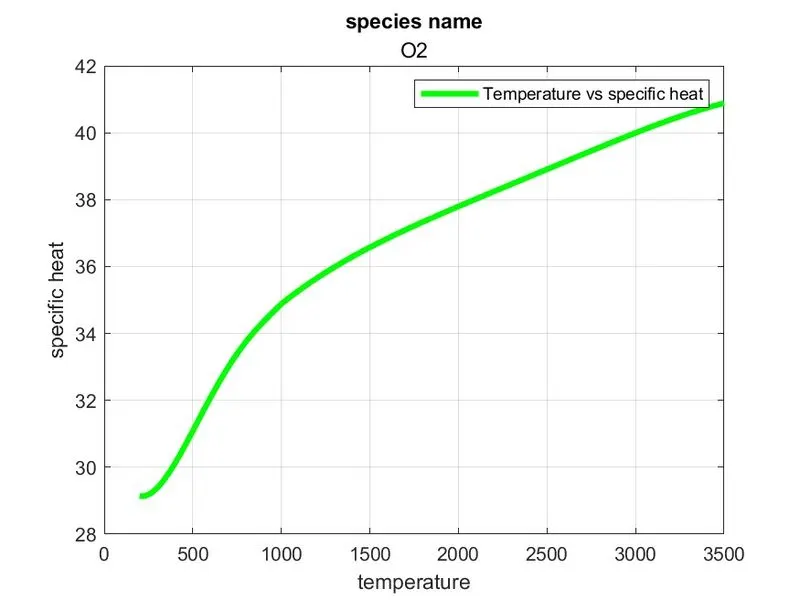
SPECIFIC HEAT PLOT FOR O2
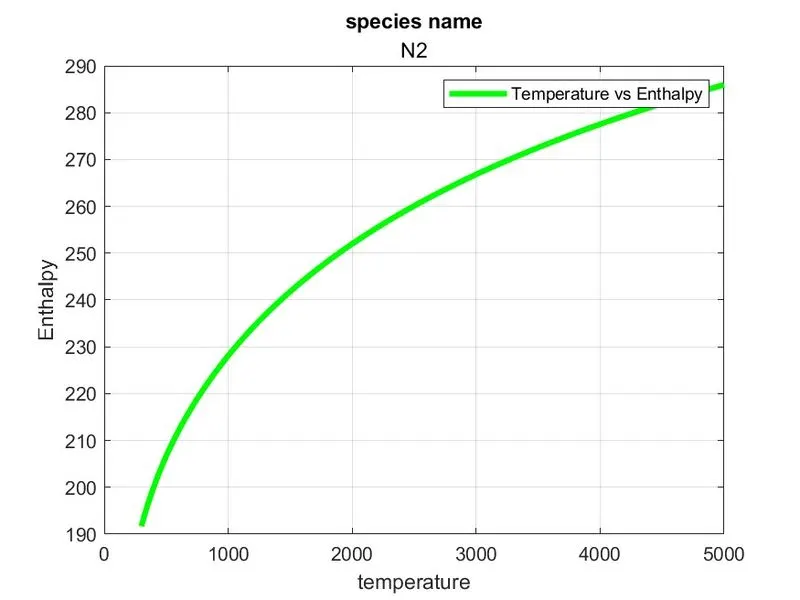
ENTHALPY PLOT FOR N2
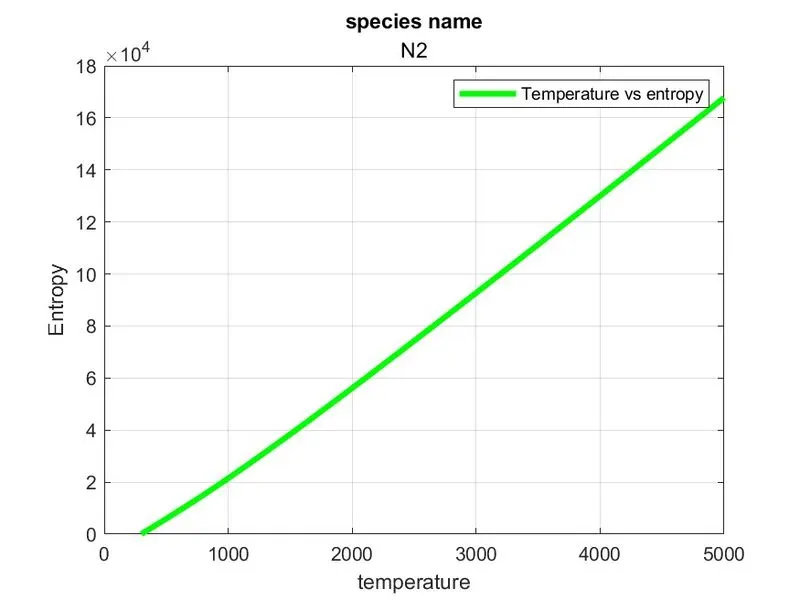
ENTROPY PLOT FOR N2
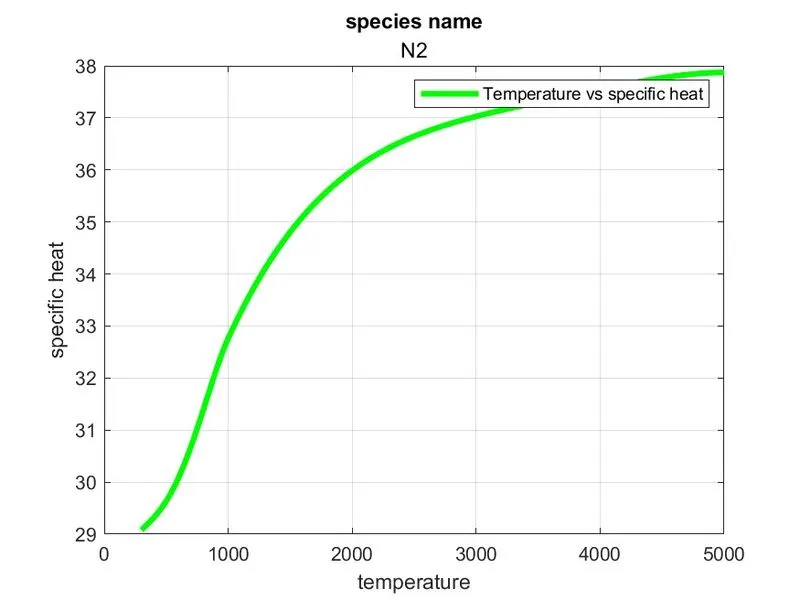
SPECIFIC HEAT PLOT FOR N2
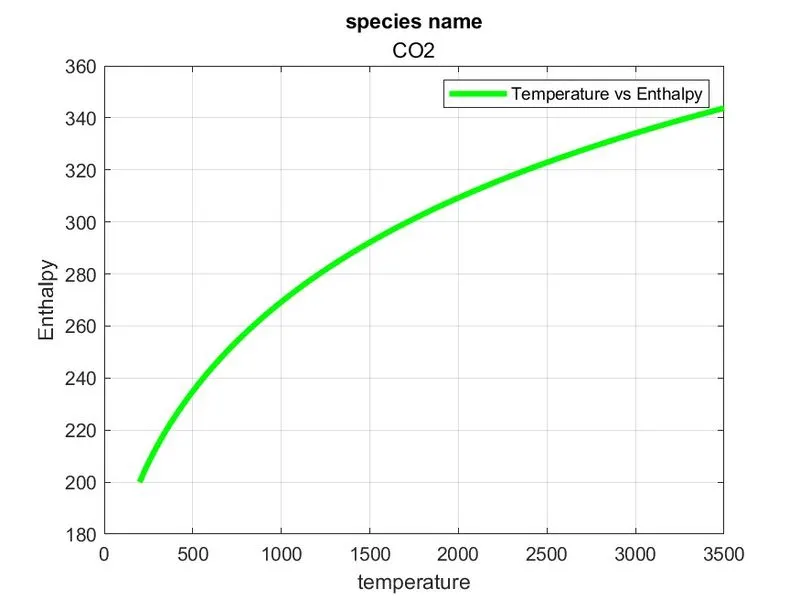
ENTHALPY PLOT FOR CO2
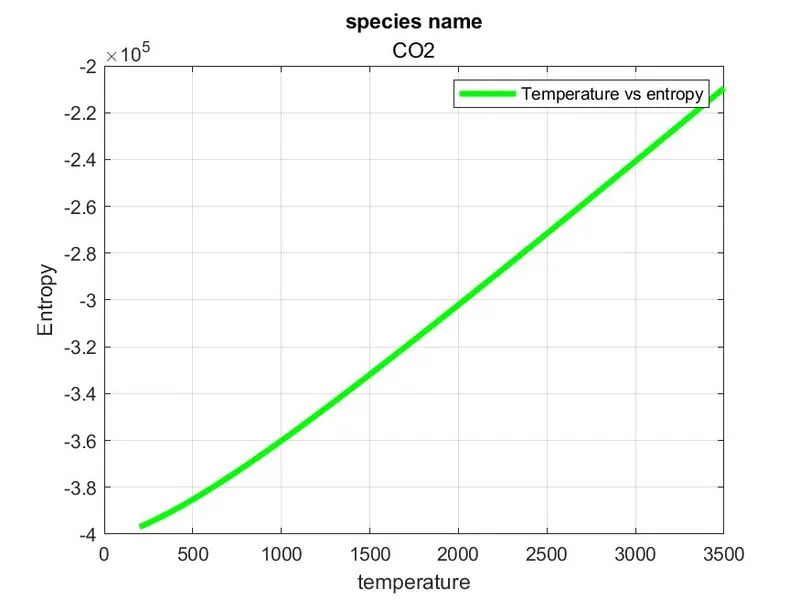
ENTROPY PLOT FOR CO2
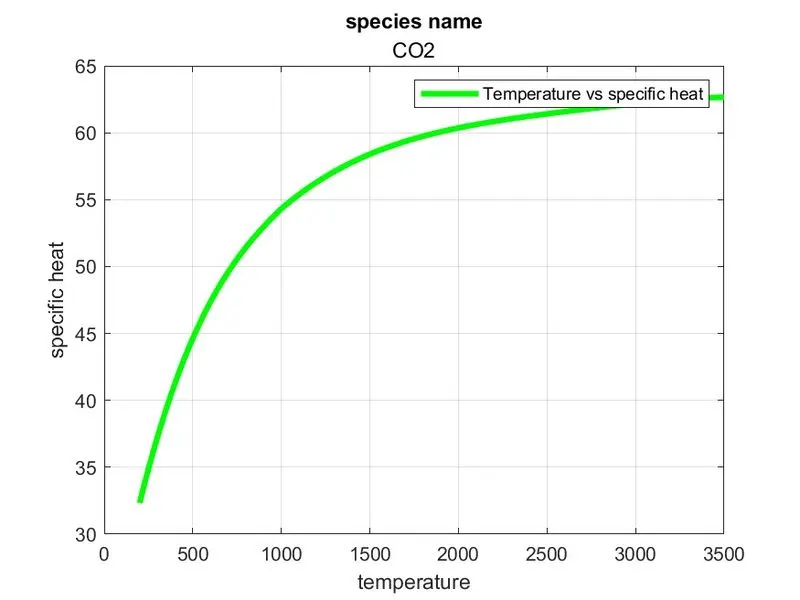
SPECIFIC HEAT PLOT FOR CO2
EXAPLAINATION ABOUT THE PROGRAM
- Download the thermo.dat file in the portal after file is moved to matlab program function location
- after the file was open and read by the firstt stage using fopen command and read command it is denoted by f
- in the thermo.dat file first 5 steps are no values because in this stage we skiping the first 5 lines using for loop and fgetl command
- next stage goes to parsing all the species from the file totaly 53 species having in the dat file
- using the for loop i vector is denoted by 1:53 species and in the loop we use the fgetl command to access the first species that is called o that will be denoted foe vector a
- and next spliting the string of a using strsplit command it will be denoted for b
- in the line length of b to variable z is finded to defind by low high and mid temps
- line number 30 extracting the local temperature by low ,high and mid temp
- and next stage extract the coefficients for line
- find the positions and coeeficients for high temp for line 1
- coefficients of line 1 is a1,a2,a3,a4 and a5 thats are calculated
- line two also same proceture to calculate line 2 coefficients
- line 2 coefficintes are a6,a7,a8,a9 and a10thats are calculated
- line number 62 we find the line 3 coefficients value thats also like line 1 and line 2 proceturs
- the coefficients of line 3 is a11,a12,a13 and a14 thats are calculated
- in next stage to crating the folder automatically to save the species to files
- to use the mkdir command to select the file save area location is mentines on this stage
- universal gas constant R values is 8.314 adding this line
- in this stage to find the enthalpy,entropy and specific heat for the high and low temp
- using the foe loop end if else to calculate the enthalpy , entropy and specific heat for the data using given formula
- given formula used in high and low temperatue to calcute the enthalpy,enrtopy and specific heat
- that the calculating values are saved in the mentiones file using cd command
- plotting the calculated values with respect to the temperature
- three figures find out temp vs enthalpy and temp vs entropy and temp vs specific heat
- titile of the plot and xlabel and ylabel of the plots are mensined in this stage
- that plots are stored in mensiones folder
- final stage is to calculate the molecular weight in all the species
- to use the for loop to find the molecular weight for every species
- the molecular weight sprinted by command windows using sprintf command
- finaly we find the plots and molecular weight and file parsing.
- the 53 species folders are mensiones in above screen shot