Week 3 - Solving second order ODEs
2ND ORDER ODE
MAIN PROGRAM
%% 2nd order ODE using matlab

clear all
close all
clc

%% inputs
%%damping coefficient
b=0.05;
%% gravity
g=9.81;
%% length of rope
l=1;
%% mass of ball
m=1;
%%initial conditions
%%angular displacement =0
%% angular velocity = 3
theta_0=[0;3];

%% time points
%% generating 200 values b/w 0-20sec usimg linspace command
t_span=linspace(0,20,200);

%% solve solve odes
%% using the ode45
[t,results]=ode45(@(t,theta)ode_func(t,theta,b,g,l,m),t_span,theta_0);

%% ploting
%% angular displacement
plot  (t,results(:,1))
hold on
%% angular velocity
plot (t,results(:,2))
xlabel('time')
ylabel('plot')
legend({'displace','velocity'})


%% to defind pivot point of pendulam & plot
x0=0;
y0=0;
plot(x0,y0,'Marker','o')

%% to extract the first column of a results and assigned it to y
%% theta/angular displacement
y = results (:,1);


%% to create image for each time value
ct = 1;
for i = 1:length(t_span)
    x1=l*sin(y(i));
    y1=-l*cos(y(i));
    plot([x0 x1],[y0 y1],'LineWidth',3,'marker','o')
    hold on
    plot (x1,y1,'Marker','o','color','y','markersize',30,'MarkerFaceColor','r')
    hold off
    title({'simple harmonic motion';'of a pendulam'},'color','g')
    axis([-1 1 -2 0])
    pause(0.03)
    xlabel('time')
    ylabel('angular displacement&angular velocity')

    %% all figures are convrting into frames
    M(ct)=getframe(gcf);
    ct=ct+1;

end
%% movie creation
movie(M);
videofile = VideoWriter('second_order_odes.avi','Uncompressed AVI');
open(videofile);
writeVideo(videofile,M);
close(videofile);
FUNCTION PROGRAM
function [dtheta_dt]= ode_func(t,theta,b,g,l,m)

theta1=theta(1);
theta2=theta(2);
dtheta1_dt=theta2;
dtheta2_dt=(-b/m)*theta2-(g/l)*sin(theta1);
dtheta_dt=[dtheta1_dt;dtheta2_dt];

end
SCREEN SHOT ABOUT THE PROGRAM
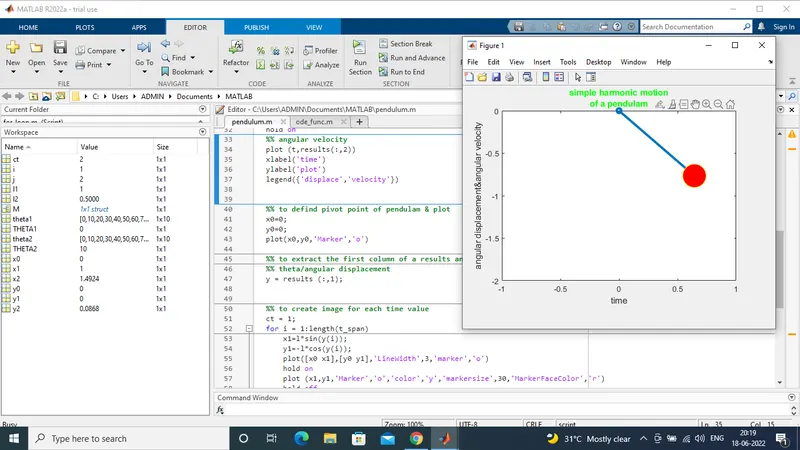
EXPLAINATION ABOUT THE PROGRAM
- Input values are given to the first stage that input values are damping coefficient b=0.05, gravity g=9.81, length l=1, mass of the ball m=1 and angular velocity 3
- generating the 200 values between 0-20sec usung linspace command for time points
- this stage using the ode45 function for all the given values
- plotting the angular displacement and angular velocity for this stage using the plot command
- then to difine the pivot point of pendulum and plot the values using the marker command
- the extract first column of a results are denoted by y
- in this stage to create the image for each time values using for loop
- in the forloop stage plot,hold on ,hold off,title,pause,xlabel and ylabel command
- in the for loop stage all the figures are converting into frames using getframe command
- finaly the result of pendulum plot is creted by movie using the videofile command
- this video file drive link is attached to below
RESULT
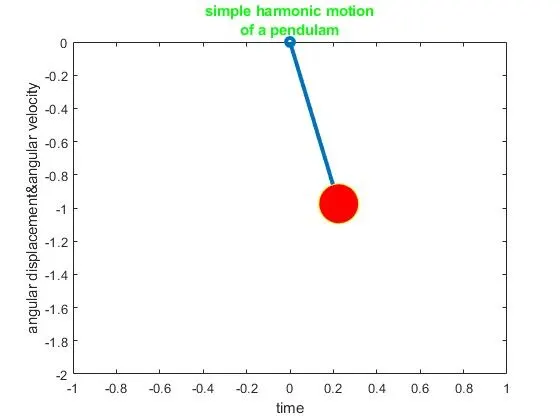
VIDEO FILE LINK
https://drive.google.com/file/d/1WZpsB8FEzTNs4kFUgN_5vPnrojycRnfj/view?usp=sharing