Week 1- Mixing Tee
Aim: The main aim of the project is to investigate the effect of geometric parameters and momentum ratio on effectivness of the mixing tee.
Introduction: Mixing tee is a device which efficiently mixes two fluids of different chemical or physical properties into a single stream.Mixing tee's are most commonly used in petrochecmical industries, nuclear and thermal power plants.Due to enormous number of applications it is very much essential to visualize and to investigate the mixng process and effects of other geometric parameters on it.In our study Ansys fluent module is used for visulazing and investigating the physics.
To find out the effect of momentum ratio on outlet temperature, the oulet temperature is obatined for different momentum ratio's ( 2 and 4) by keeping the hot inelt velocity of 3m/s constant for both the cases.
To find out the effect of length on the outlet temperature , the sort and lonf mxing tee's are compared for same input parameters.
In our analysis the mesh size , the input parameters and the solution setup for both the cases remains the same.
Simulation approach: This section gives a brief description about the methodology incorporated and also explains about the parameters
considered for the work.
| 1. Geometric modelling |
| 2.Meshing |
| 3.Selection of material and defining bounday conditions |
| 4.Problem setup |
| 5.Results |
| 6.Conclusion |
1. Geometric modelling : The geometry of the mixing pipe is modelled in CATIA and imported directly to the ansys space claim module.
In this study two geometry models are utilized those are:
a) short mixing tee
b) long mixing tee
The only difference between these two geometries are their lenghts.
In the spaceclaim module the fluid volume of both the models were extracted.
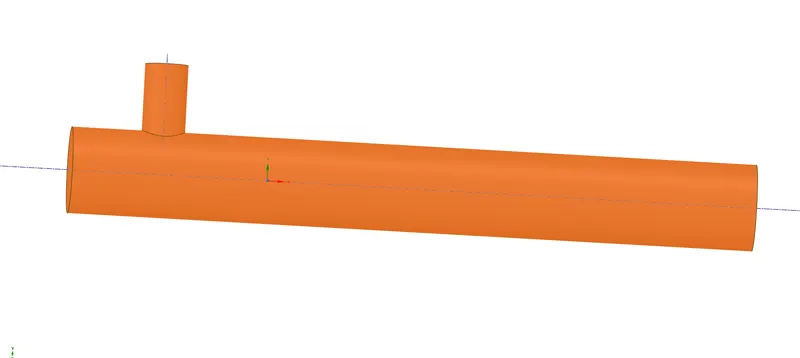
Fig 1: Long mixing tube
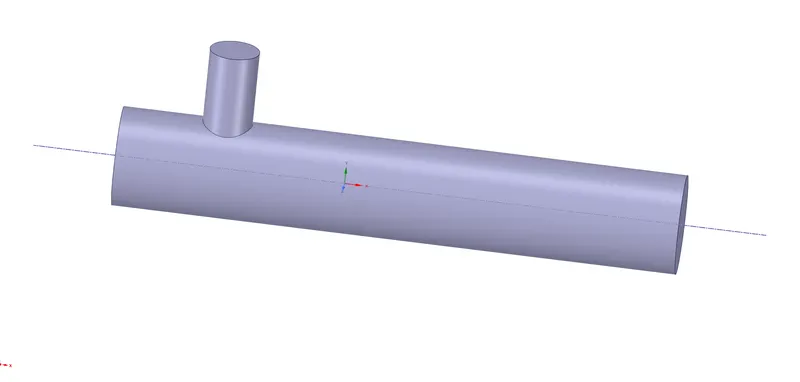
Fig 2 : Short mixing tube
2.Meshing : For both the models ansys mehing module is used.
Steps involved in meshing:
a)For both the cases, the extracted fluid volume is further sub-divided as cold-inlet, hot-inlet,wall and outlet as shown in the figue 3.
b)The meshing is carried out by using appropriate mesh size .For both the cases the mesh size is kept 1.5e-3 m.The main reason for using a particular mesh size is explained in the grid independence test section.
note: As the process and parameters used for both the geometries are same .So only image of short mxing tee is shown.
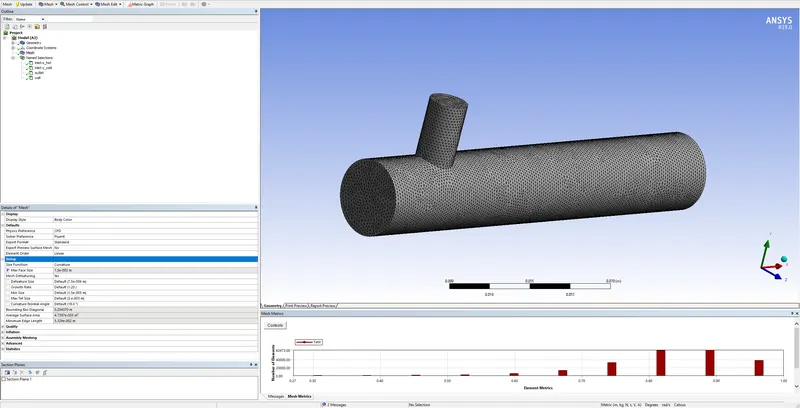
Fig 3 : Short mixing tee -meshing
Grid independence test: Basically this test helps us to find out the optimum grid size which need to be sued for the analysis.
A mesh is said to be grid independent if the output paramentrs does not vary with the mesh size.So it is carried out by performing the same analsyis for different mesh sizes ranging from coarse to finer mesh and keeping track on the output parametrs.
In our study grid independce is test is performed by varying the mesh size from 5 e-3 m to 1e-3 m.During the course of it the output parameter temperature and velocity are noted down.
A graph is plotted between the no of elements and outlet velocity and outlet temperature and shown below.
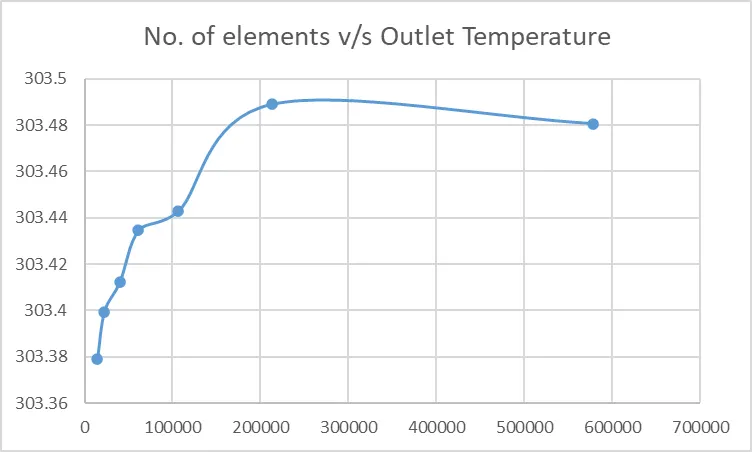
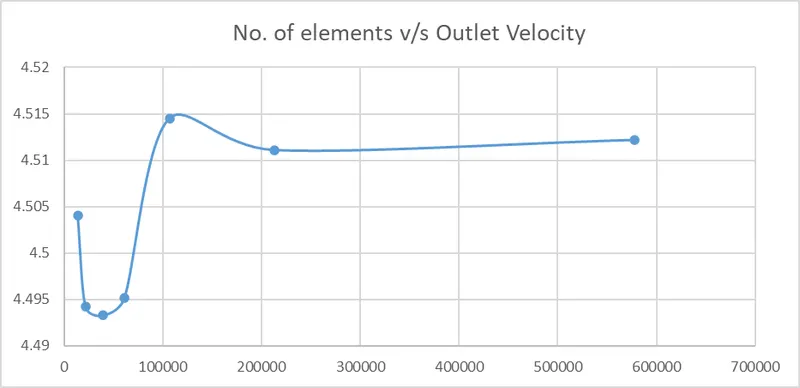
From the above graph we can clearly observe that the output parameters are constant when the number of elements are in the range of 200000 to 350000. So in this region the output parameters are constant irrespective of the mesh size so the mesh size correspong to this region is considered as the mesh size for our analysis.
3)Selection of materail and boundary conditions:
For our study the fluid which is considered is air and the mxing tee material is aluminium.
The bounday conditions inlet-hot and inlet-cold temperature for both the cases is considered to be 36 `ºc` and `19 ºC` respectively.
For wall adiabatic and no slip condition is incorporated.
The hot-inlet and cold-inlet velocity of both the tee's are varied considered depending upon the case.
4)Problem setup
In this section the main or core of the physics is setup.
The goverining equations , number of iterations, the selections of required output parameters are done in this section.
Since temperature is invovled in this study energy equation is considered .
For turbulence model K-`epsilon` model and k-`omega`model is considered for short mixing tee analysis to understand when to use them and to find out their effect on the output.
In case of long mixing tee K-`epsilon`turbulence model with standard wall functions is used as turbulence model .
For our case K-`epsilon`turbulence model is considered to be optimal and reason behind this will explained in the later section of this report.
5)Results:
Average velocity at outlet , cell count and number of iterations for convergence are shown below.
| momentum ratio | Cell Count |
Outlet temperature (K) |
No of iterattions | |
| Short mixing tee | 2 | 213490 | 303.48 | 392 |
| 4 | 213490 | 300.71 | 541 | |
| long mixing tee | 2 | 289760 | 303.58 | 486 |
| 4 | 289760 | 300.63 | 700+ |
The convergence plots for all the cases are shown below:
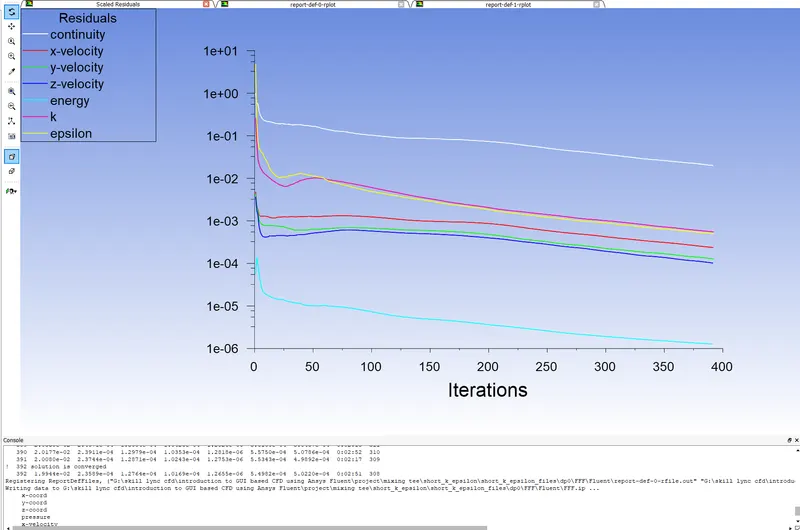
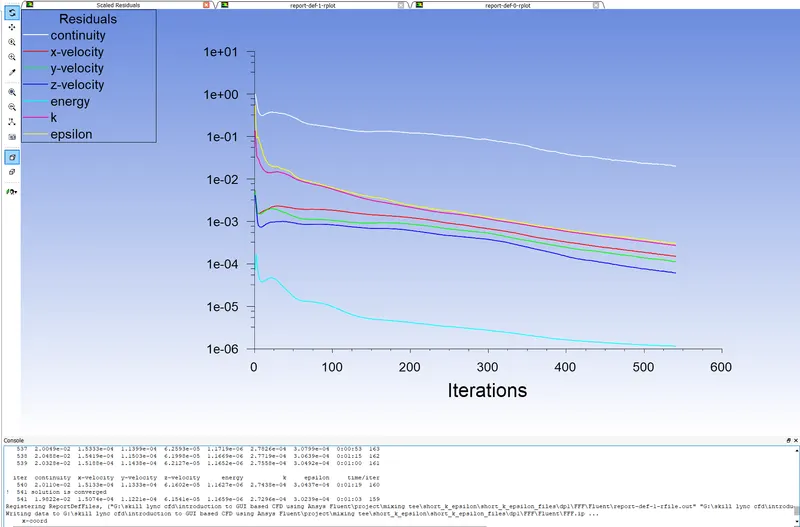
Fig 4 : Convergence plot short mixing tee - momentum ratio - 2 Fig 5 : Convergence plot short mixing tee - momentum ratio - 4
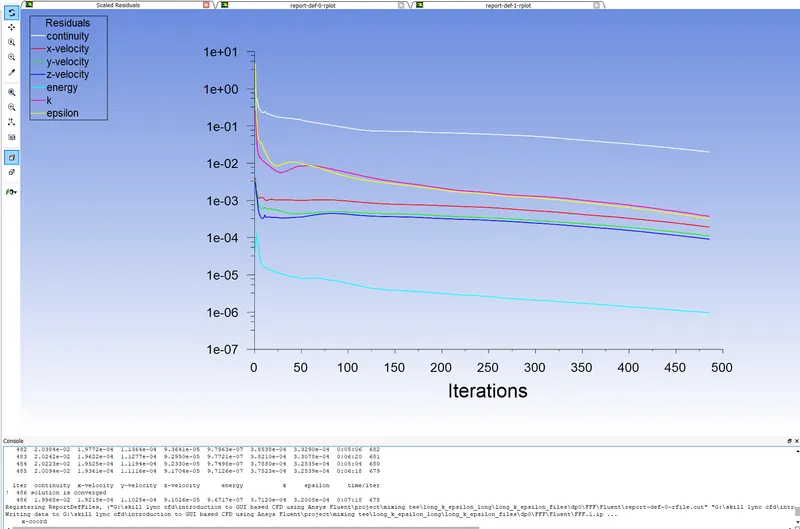
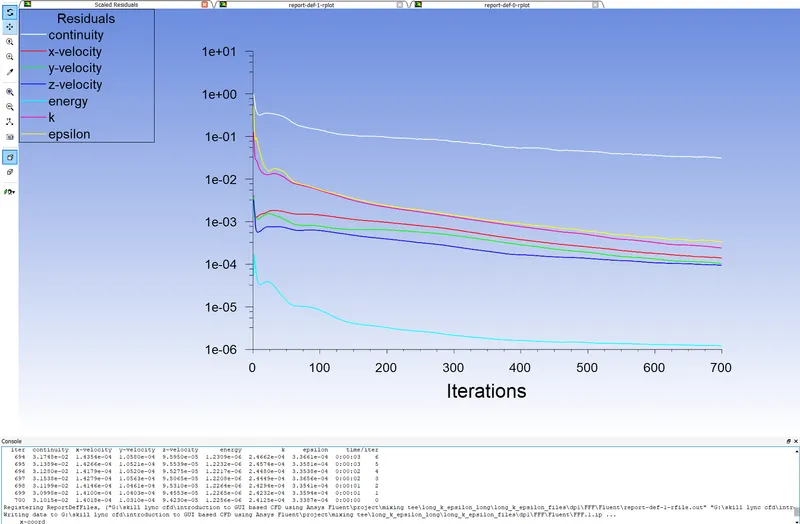
Fig 6 : Convergence plot long mixing tee - momentum ratio - 2 Fig 7 : Convergence plot long mixing tee - momentum ratio - 4
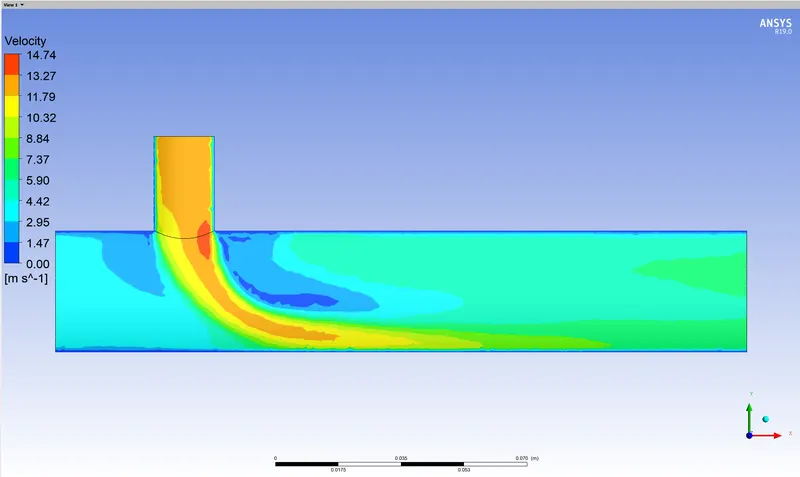
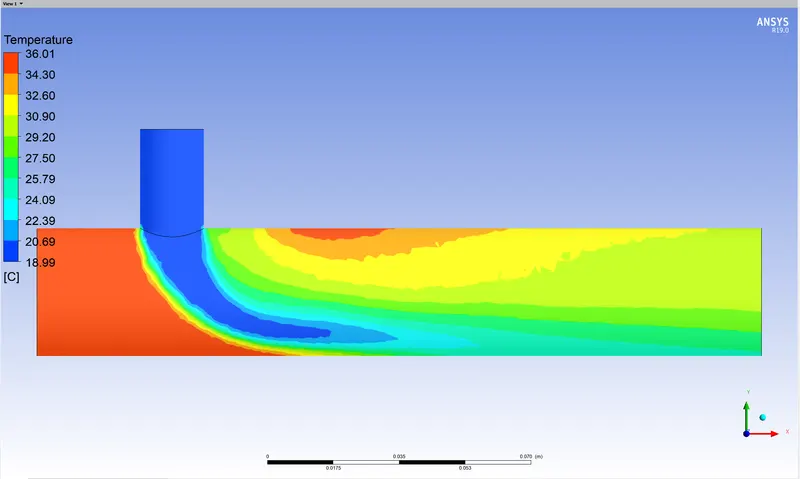
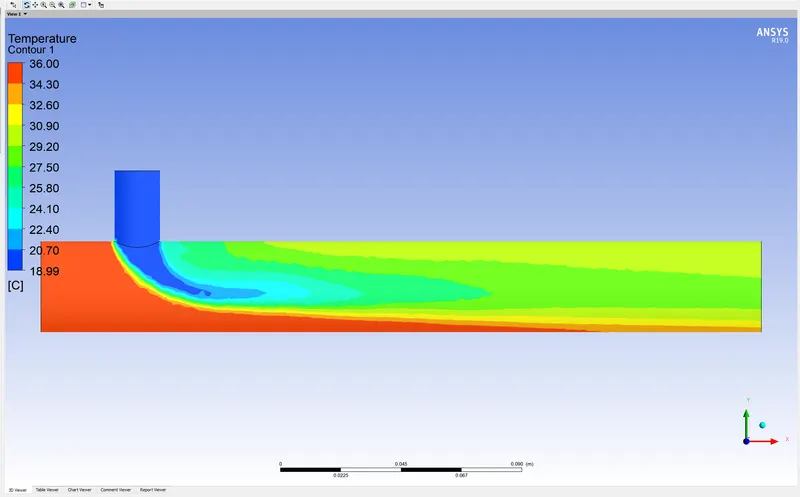
The velocity, temperautre plots and contours for both the cases are shown below:
Velocity and temperature contour along the cut seection: Short tee momentum ratio 4
Velocity and temperature contour along the cut seection: Shor tee momentum ratio 2
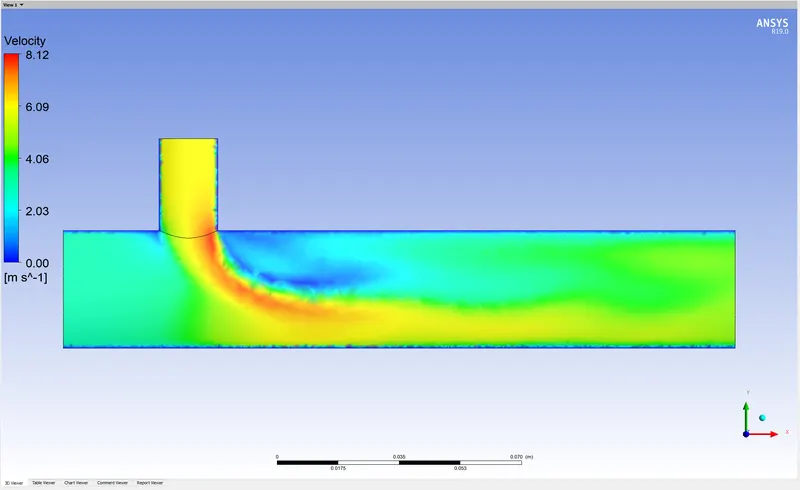
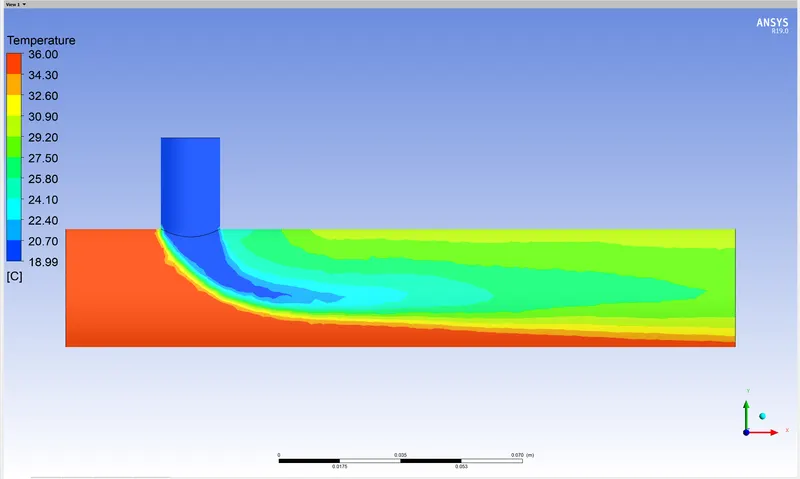
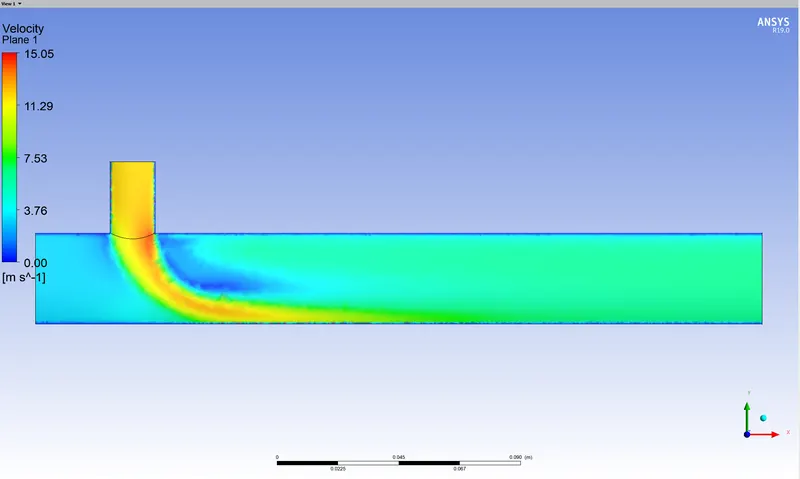
Velocity and temperature contour along the cut seection: long tee momentum ratio 4
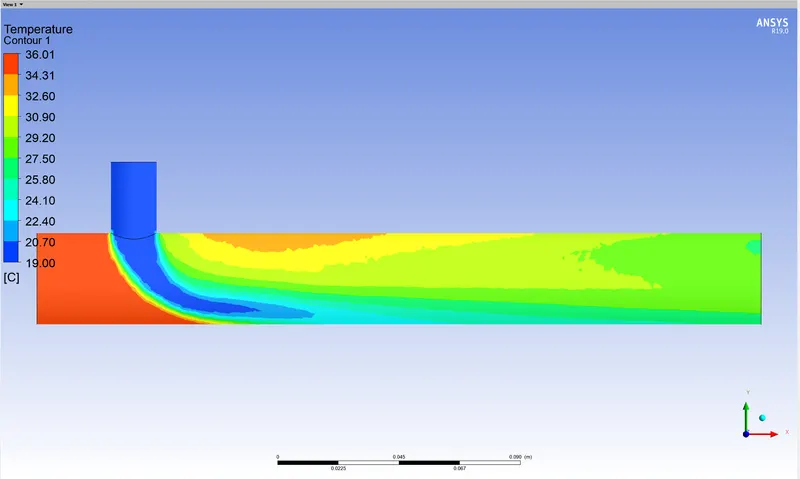
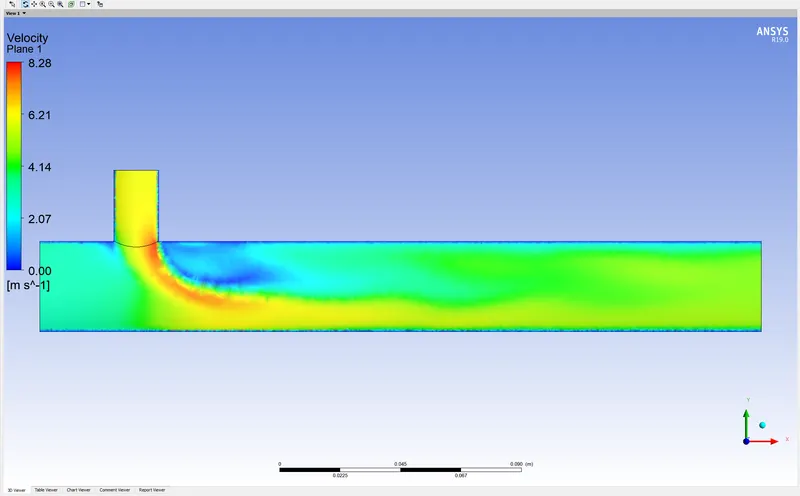
Velocity and temperature contour along the cut seection: long tee momentum ratio 2
Conclusion:
a)Why K-`epsilon` turbulence model is used instead of k-`omega`:
By using the same input parametrs and mesh configuration short tee analsyis is carried out by using k-`omega` model and the resulting contours are presented below:
Velocity and temperature contour along the cut seection: short tee momentum ratio 4 ( k-`omega`)
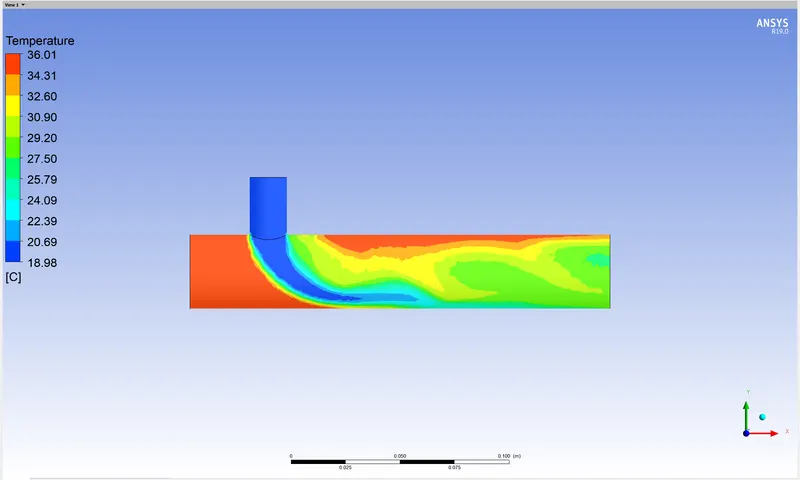
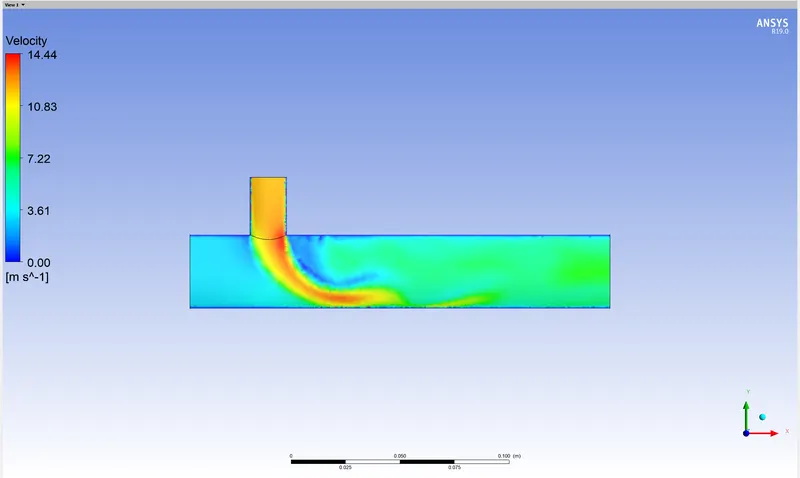
By comparing this contours with the K-`epsilon` model contours we can clearly see that in case of k-`omega` model there is distortion in mid section of the pipe .In other words the K-`epsilon` model is predicting the flow away from the wall much better than k-`omega` model.
The main conclusion is that k-epsilon is used when investigation region is away from the wall and k-omega need to used when the investigation region is near the wall .
In our case the wall is adiabatic in nature so it better to use k-epsilon model insteead of k-omega .
Important note: When the outlet temperature is compared there is no much difference in values between these two models but when we obseve the contours there is notable differences.
b)Effect of momentum ratio and length on mixing quality and outlet temperature.
Effect of momentum ratio : As the momentum ratio increases ,the outlet temperature decreases which indicates better mixing and this can also be clearly observed in temperature contours.
Effect of length : When we compared the results of short tee and long tee there was noticable diffrence in outlet temperature .
So we can conclude that moemntum ratio has more impact on mixing quality than the lenght of the tee.So to increase the efficiency of the mxing it is better to increase the momentum ratio than incraeasing the length .